Sample Category Title
GBP/JPY Weekly Outlook
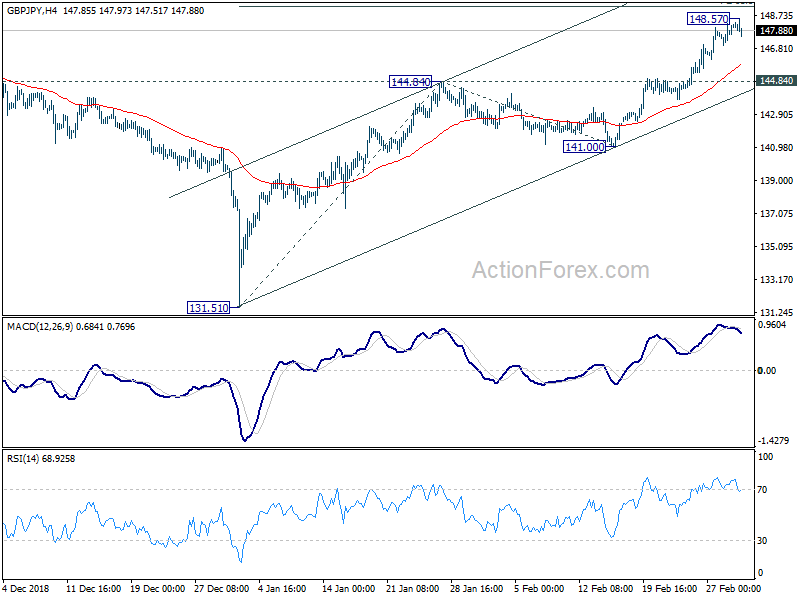
GBP/JPY's rally from 131 51 accelerated to as high as 148.57 last week before forming a temporary top and retreated. Initial bias is neutral this week for some consolidation first. Downside of retreat should be contained by 144.84 resistance turned support to bring rise resumption. On the upside, break of 148.57 will target 149.48 resistance first. Decisive break there will target 100% projection of 131.51 to 144.84 from 141.00 at 154.33 next.
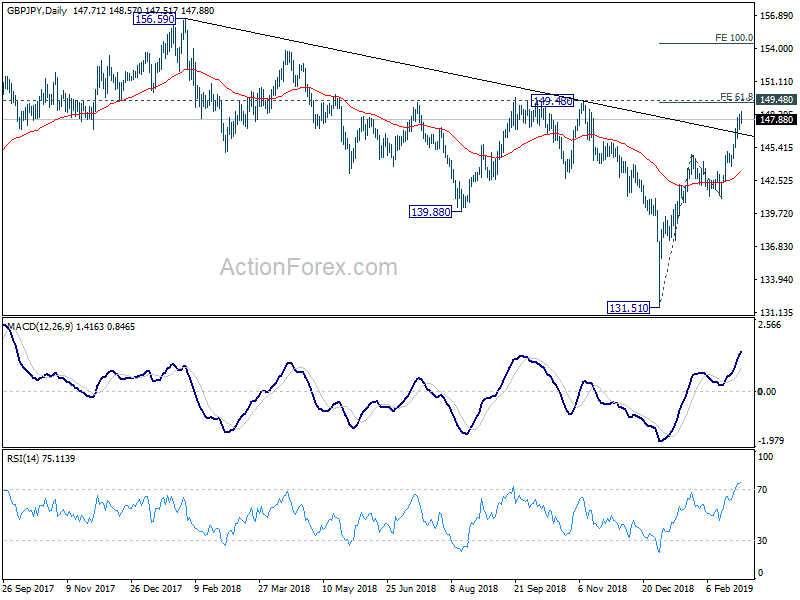
In the bigger picture, the strong rebound from 131.51 suggests that medium term fall from 156.59 (2018 high) has completed already. The corrective structure of such decline in turn argues that it's the second leg of the corrective pattern from 122.36 (2016 low). And this pattern is starting the third leg. On the upside, decisive break of 149.48 will pave the way to 156.59 resistance and above.
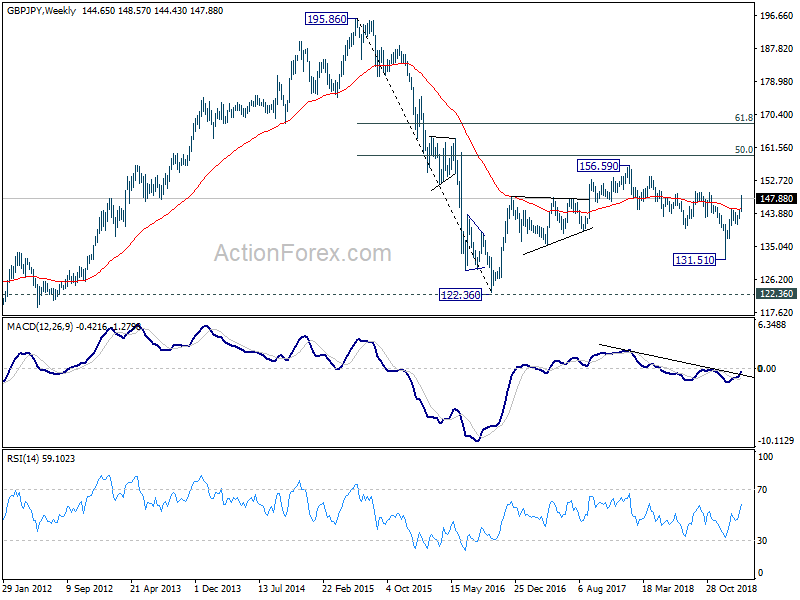
In the longer term picture, the rise from 122.36 (2016 low) to 156.59 (2018 high) doesn't display a clear impulsive structure. Thus, we're treating price actions from 122.36 as a corrective pattern. In case of an extension, strong resistance is likely to be seen at 50% retracement of 195.86 (2015 high) to 122.36 at 159.11 to limit upside. On the downside, break of 131.51 support will bring 122.26 low back into focus.
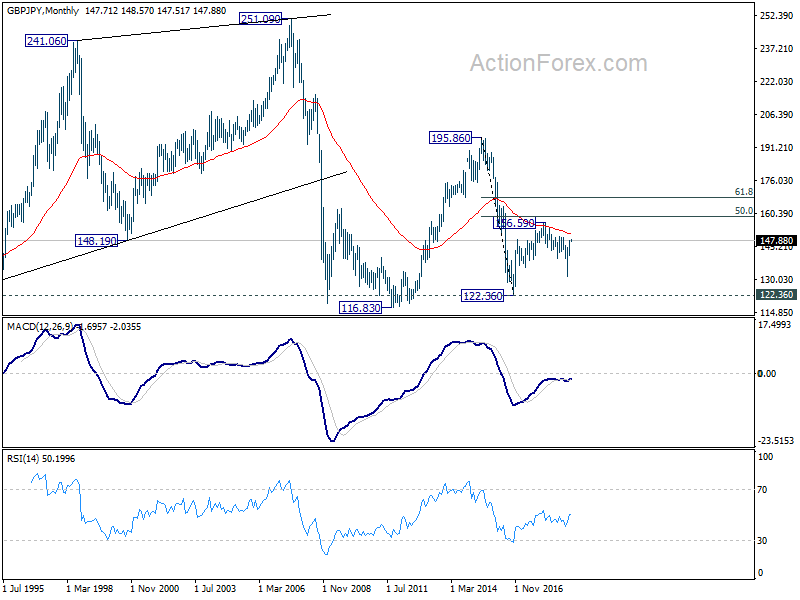
EUR/JPY Weekly Outlook
EUR/JPY rose strongly to as high as 127.50 last week before closing at 127.19, as rise from 118.62 extended and accelerated. Initial bias remains on the upside for 61.8% retracement of 137.49 to 118.62 at 130.28 next. On the downside, break of 126.60 minor support will turn intraday bias neutral and bring consolidations first. But downside of retreat should be contained by 124.23/125.95 support zone to bring rise resumption.
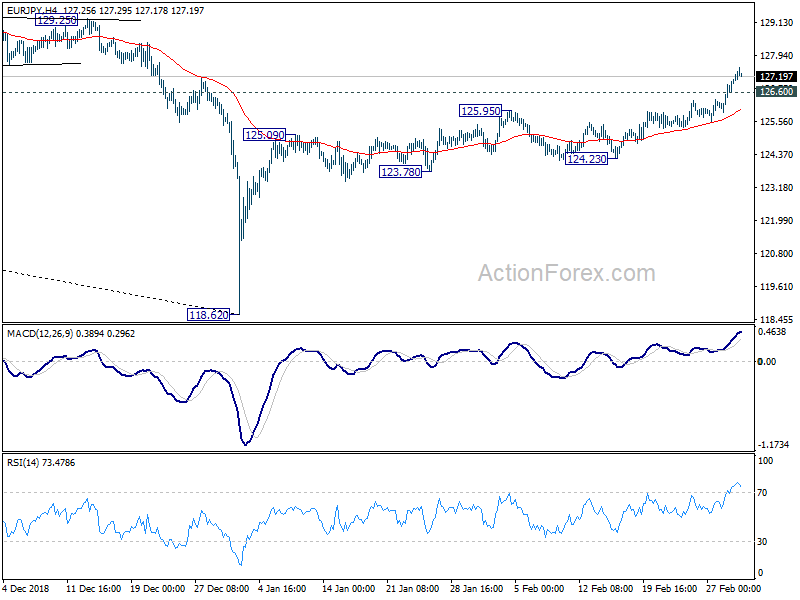
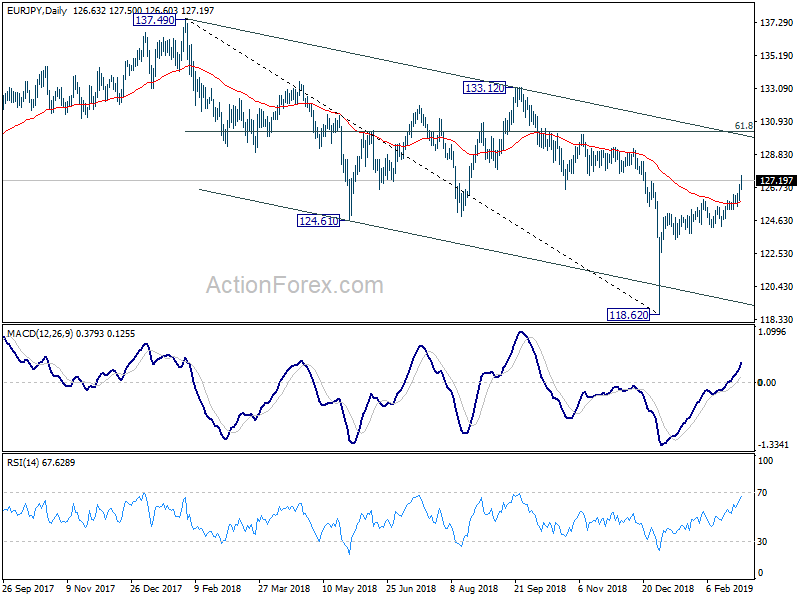
In the bigger picture, current development argues that medium term decline from 137.49 (2018 high) has completed with three waves down to 118.62 already. Decisive break of 133.12 resistance will confirm this bullish case. And whole up trend from 109.03 (2016 low) might resume through 137.49 in that case. On the downside, break of 124.23 support will invalidate this case and turn focus back to 118.62 instead.
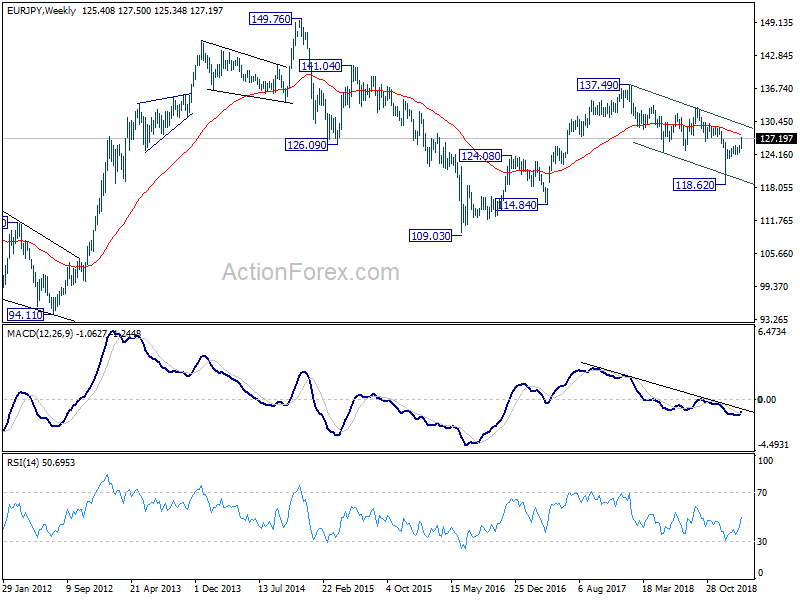
In the long term picture, EUR/JPY is staying in long term sideway pattern, established since 2000. Fall from 137.49 is seen as a falling leg inside the pattern and could have completed. Break of 133.12 resistance will likely send EUR/JPY through 137.49 towards 149.76 (2014 high).
EUR/GBP Weekly Outlook
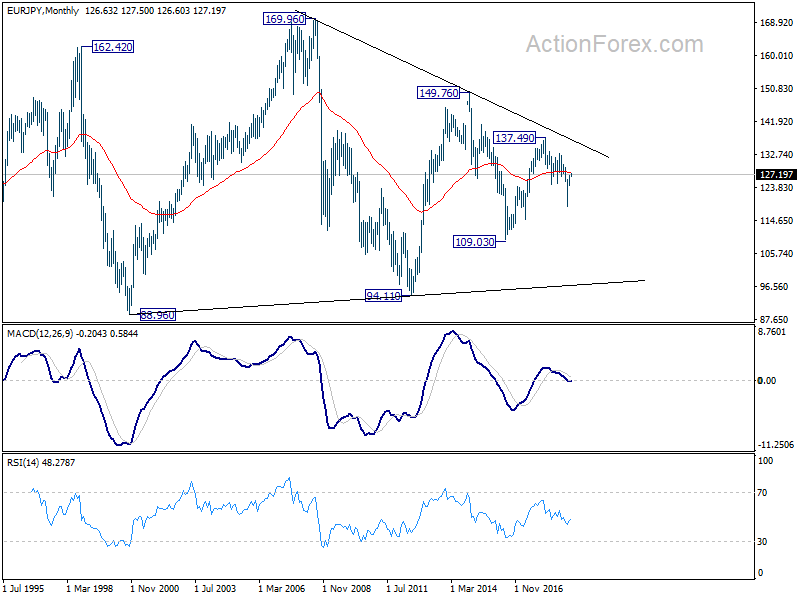
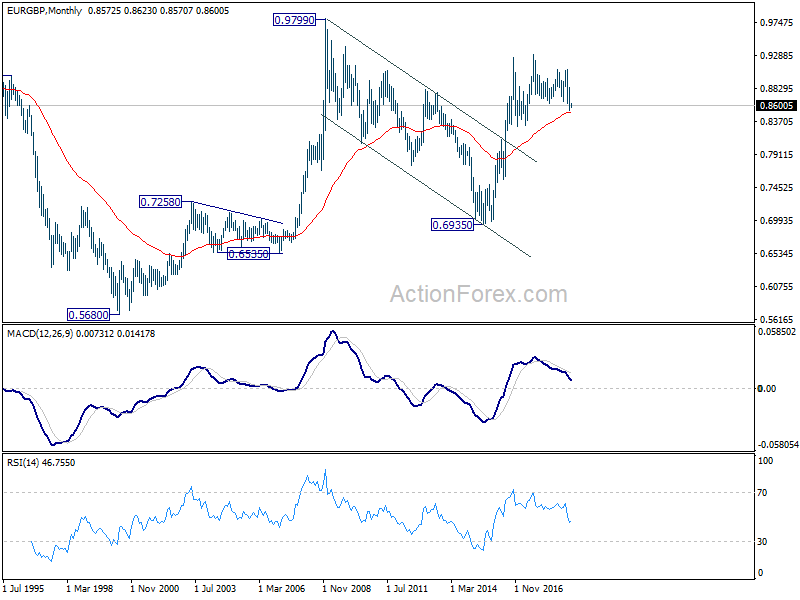
EUR/GBP dropped sharp to 0.8529 last week and took out 0.8620 key support. The development suggests resumption larger decline from 0.9305. As a temporary low is in place, initial bias is neutral this week for some consolidations first. Upside of recovery should be limited well below 0.8840 resistance to bring fall resumption. On the downside, break of 0.8529 will target long term projection target at 0.8416 next.
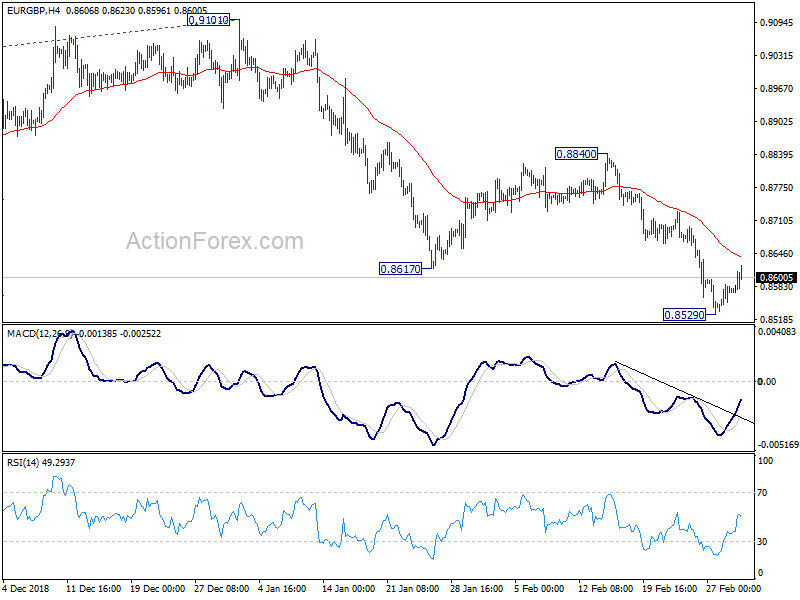
In the bigger picture, EUR/GBP is seen as staying in long term range pattern started at 0.9304 (2016 high). Current fall from 0.9305 (2017 high), is seen a a falling leg inside the pattern. Such decline is now targeting 100% projection of 0.9305 to 0.8620 from 0.9101 at 0.8416 and possibly below. But for now, we'd expect strong support around 0.8312 support to contain downside and bring rebound.
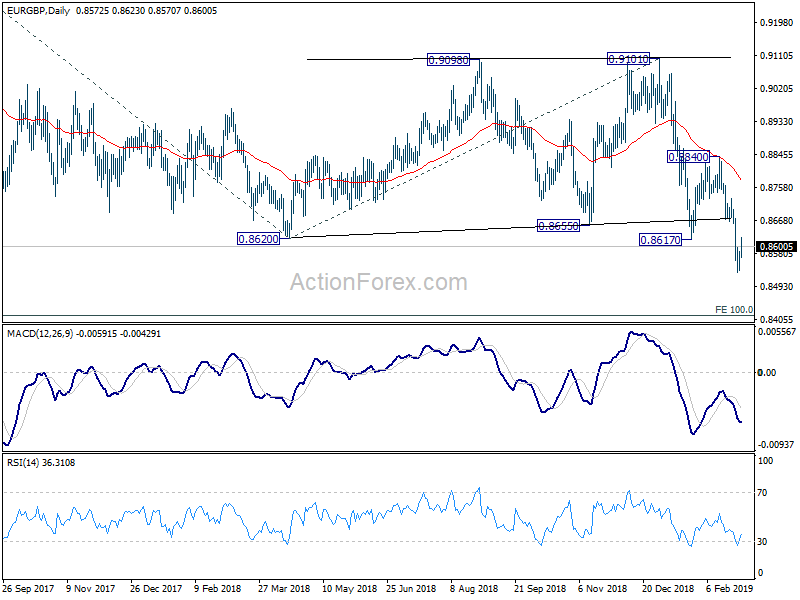
In the long term picture, we're holding on to the view that rise from 0.6935 (2015 low) is resuming the up trend from 0.5680 (2000 low). As long as 050% retracement of 0.6935 to 0.9304 at 0.8120 holds, further rise should be seen through 0.9305 to 0.9799 and above down the road.
EUR/AUD Weekly Outlook
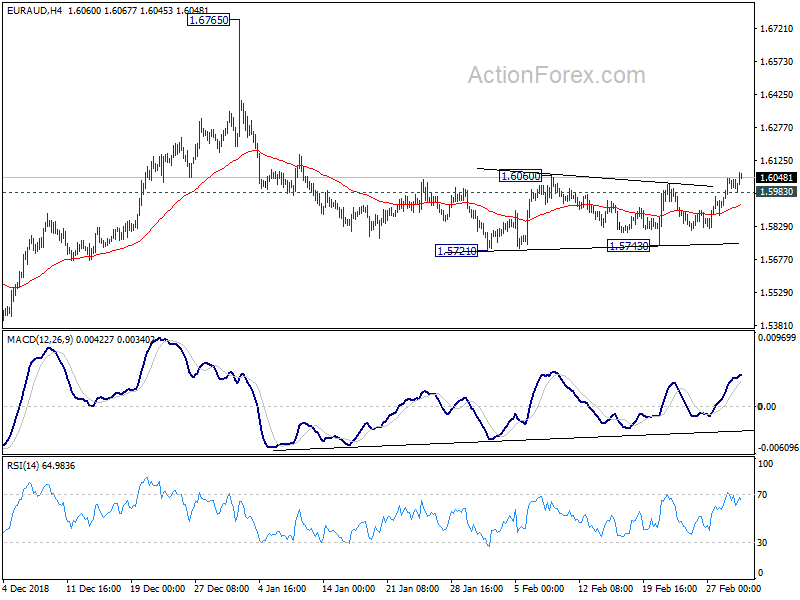
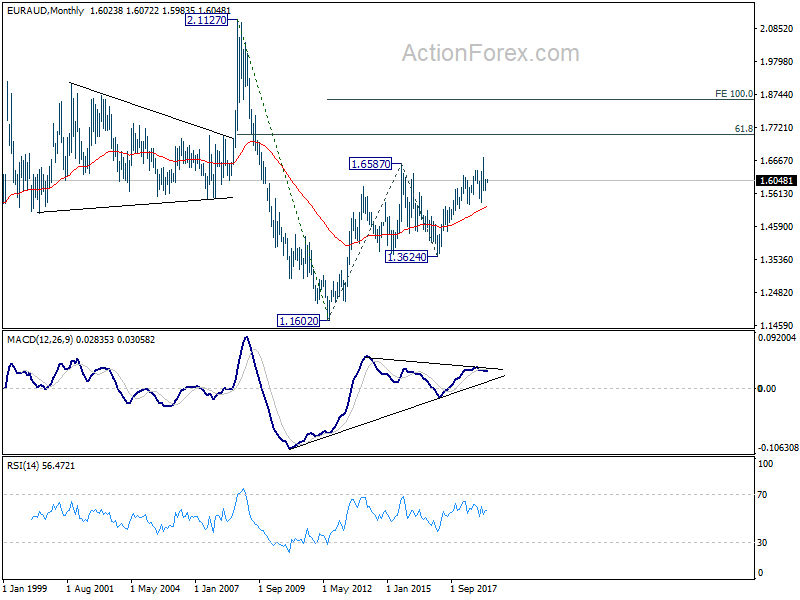
EUR/AUD rebounds strongly last week and the breach of 1.6060 resistance argues that decline from 1.6765 has completed. Initial bias is cautiously on the upside this week. Sustained trading above 1.6060 will confirm and target 1.6765 resistance next. On the downside, though, below 1.5983 minor support will dampen this bullish case and turn bias neutral again.
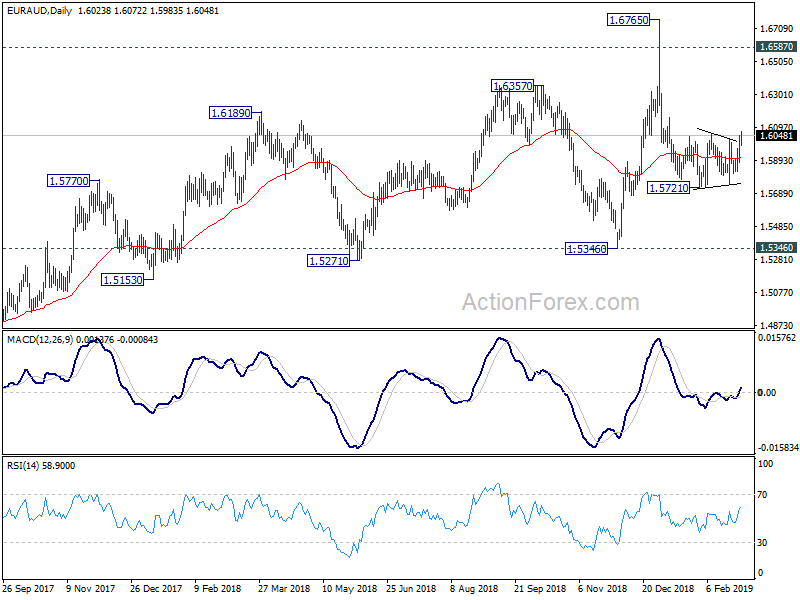
In the bigger picture, as long as 1.5346 support holds, outlook will remain bullish. Uptrend from 1.1602 (2012 low) is expected to resume sooner or later. Break of 1.6765 will target 61.8% retracement of 2.1127 (2008 high) to 1.1602 at 1.7488 next. However, firm break of 1.5346 key support will indicate trend reversal, with bearish divergence condition in weekly MACD, and turn outlook bearish.
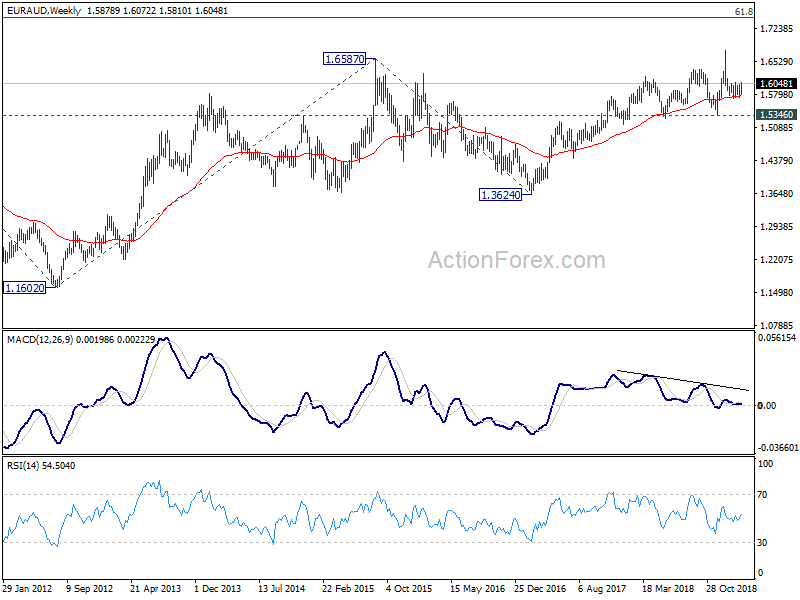
In the longer term picture, the rise from 1.1602 long term bottom (2012 low) is still in progress for 61.8% retracement of 2.1127 to 1.1602 at 1.7488. Firm break there will pave the way to 100% projection of 1.1602 to 1.6587 from 1.3624 at 1.8069. This will remain the favored case as long as 1.5346 remains intact.
EUR/CHF Weekly Outlook
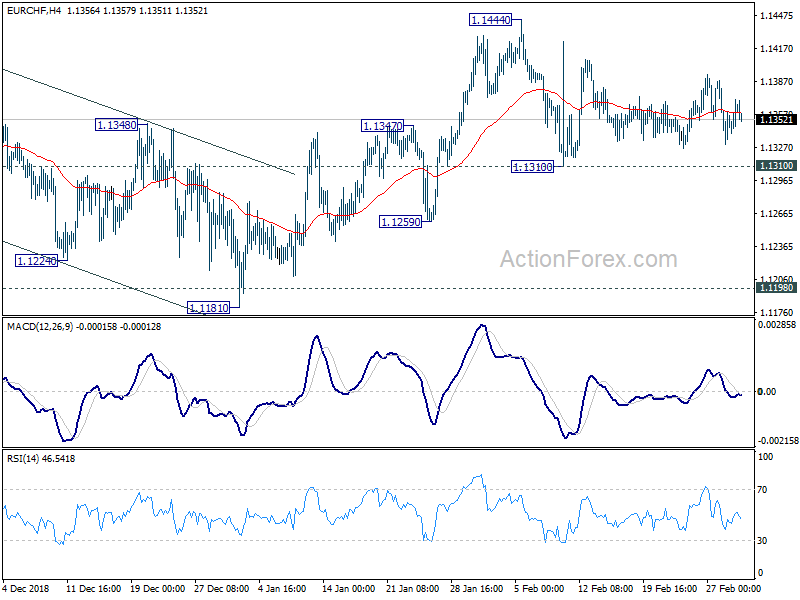
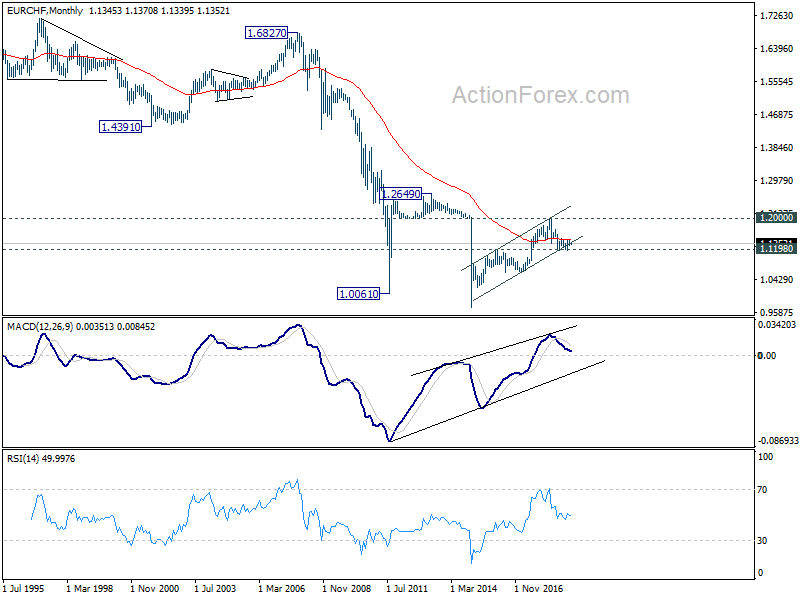
EUR/CHF continued to stay in consolidation inside 1.1310/1444 last week. Outlook is unchanged and initial bias remains neutral this week first. Further rise is in favor as long as 1.1310 support holds. On the upside, break of 1.1444 will resume the rebound from 1.1181 and target 1.1501 key resistance next. On the downside, firm break of 1.1310 will indicate completion of the rebound. In that case, intraday bias will be turned back to the downside for 1.1181 low again.
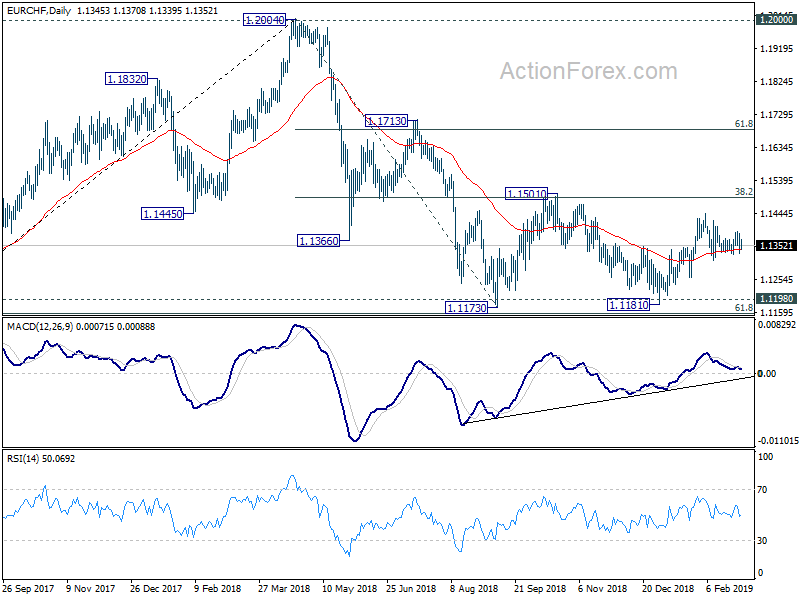
In the bigger picture, price actions from 1.2004 medium term top is seen as a correction only. Downside should be contained by 1.1154/98 support zone to complete it and bring rebound. Decisive break of 1.1501 (38.2% retracement of 1.2004 to 1.1173 at 1.1490) will confirm completion of the correction. Further rise should be seen to 61.8% retracement at 1.1687 and above next.
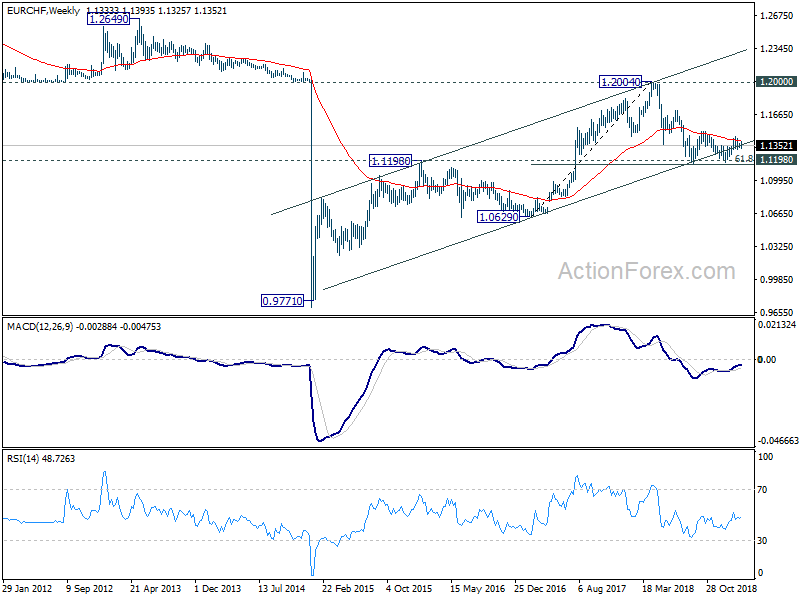
In the long term picture, as long as key support zone of 1.1198 (2016 high) and 61.8% retracement of 1.0629 to 1.2004 at 1.1154 holds, A break of 1.2 key resistance is still expected in the medium to long term. However, sustained break of the mentioned support zone will mark reversal of the long term trend. In that case, 1.0629 key support will be back into focus.
Treasury Yield Surged on Abating Global Risks and Bets on Bottoming in Economic Slowdown
There were so many high profile events last week. In the end, the positive ones were more than enough to offset the negative ones. US-China trade truce was extended indefinitely and it looks closer than ever to have deal. MSCI's increase of weighting of Chinese stocks gave China another huge boost. Chance of no-deal Brexit faded much with UK Prime Minister Theresa May's new arrangements. On the other hand, escalation of Pakistan-India tensions and the collapse of Trump-Kim summit in Vietnam just gave the markets very brief impact.
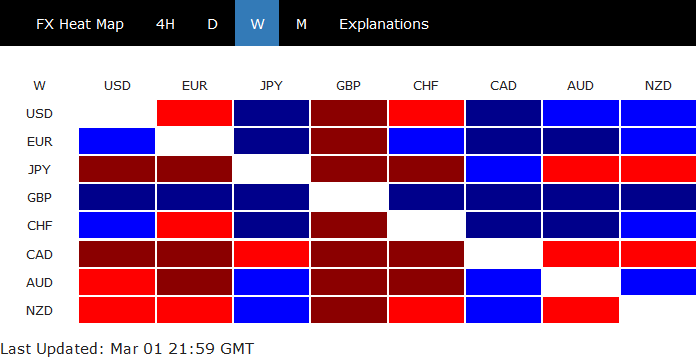
While economic data released during the week were mixed, talks of bottoming in global slowdown emerged, as risks are abating. The turn in sentiment pushed treasury yields sharply higher. Yen suffered broad based selloff as yield gaps widened sharply, with 10-year JGB staying negative. Though, Canadian Dollar took the weakest spot as much weaker than expected Q4 GDP suggested that its economy could be left behind by others. Late selloff in oil prices also did no favor to the Loonie. Sterling ended as the strongest, followed by Euro. But late strength in Dollar suggests that it's catching up very quickly.
Progress made in US-China trade talks, but nothing is done until everything is done
It appeared that sufficient progress were made in US-China trade negotiations to convince Trump to announce extension of trade truce indefinitely early last week. The news set a positive tone for the global financial markets, in particular in China. US Trade Representative is going to publish formal notice in the Federal Register next week, confirming that the rate of additional duty for the products covered by the September 2018 action will remain at 10 percent until further notice."
Comments from the US official regarding the negotiation were generally positive even though USTR Robert Lighthizer sounded cautious. In his testimony to House Ways and Means Committee, Lighthizer said "real progress" were made and US could "turn the corner" in the economic relationship with China". But "much still needs to be done" before an agreement is reached, and "more importantly, after it is reached."
Treasury Secretary Steven Mnuchin, said the team is working on a 150-page, very detailed, document for "significant", "structural" commitments from China. Mnuchin hoped to "make progress this month". And, "if we do, there will be a summit of the Presidents". National Economic Council Director Larry Kudlow hailed that "Lighthizer has worked miracles on this Chinese deal," and "we've never come this far on China trade."
However, as usual with any deal, it's agreed only when everything's agreed. Trump indicated in a tweet on Saturday that he made a sudden request to China to "immediately" remove all tariffs on American agricultural products. He claimed it's "based on the fact that we are moving along nicely with Trade discussions", and he didn't increase the tariffs on March 1.
It's uncertain what China's response to Trump's request would be. From China's point of view, the logical equivalent response to Trump's refrain from more tariffs is not to impose retaliation measures of their own. And China has already made some good-faith purchases of US soybeans since the start of trade truce. Chinese leaders could have their own rationales in rejecting Trump's requests. The negotiation could turn down hill if China does say "no".
And as a recap, Trump said after the summit with North Korean leader Kim Jong-un collapsed that "I am always prepared to walk," and "I'm never afraid to walk from a deal, and I would do that with China, too, if it didn't work out." He walked away from a deal with Kim after traveling all the way to Vietnam. He can certainly walk away from a deal with China sitting in the Oval Office.
China's response will be closely watched and this could be the turning point in whole US-China trade negotiations
MSCI quadrupoles weighting of Chinese stocks, could translate into billions of inflow
Market sentiments were further lifted, in particular in China again, after MSCI announced to increase the weight of China A shares in MSCI indices. The weighting will be increased from 5%% to 20% in three steps:
- Step 1: MSCI will increase the index inclusion factor of all China A Large Cap shares in the MSCI Indexes from 5% to 10% and add ChiNext Large Cap shares with a 10% inclusion factor coinciding with the May 2019 Semi Annual Index Review.
- Step 2: MSCI will increase the inclusion factor of all China A Large Cap shares in the MSCI Indexes from 10% to 15% coinciding with the August 2019 Quarterly Index Review.
- Step 3: MSCI will increase the inclusion factor of all China A Large Cap shares in the MSCI Indexes from 15% to 20% and add China A Mid Cap shares, including eligible ChiNext shares, with a 20% inclusion factor to the MSCI Indexes coinciding with the November 2019 Semi-Annual Index Review.
After the process completes, there will be 253 large and 168 mid-cap China A shares, including 27 ChiNext shares, in the MSCI Emerging Markets Index, representing a weight of 3.3% in the pro forma index.
The decision was generally seen as symbolic acknowledgement of the growing importance of China's stock markets. It could trigger increasing interest from US and European financial institutions in China A shares. On the other hand, it's also an indication that China's capital market are opening up much faster than anticipated. And foreign investors would pick up a much larger role in the Chinese markets.
Morgan Stanley said up to USD 3B of passive flows would be attracted, on top of USD 15B it highlighted previously. Harvest Global Investments said together with the opening policies, the decision would mean up to USD 100B of foreign inflows to A shares in 2019, more than double of USD 45B in 2018. T. Rowe Price said the decision would translate into USD 40B worth of inflows.
Chance of no-deal Brexit diminished after new arrangements
Diminishing chance of no-deal Brexit gave a strong boost to the Pound and also to general market sentiments. At this point, it uncertain how the EU and UK are going to solve the issue of Irish backstop yet. For the Commons to approve it, there must be legally binding that the backstop is temporary. EU is willing to offer further assurances, nothing more. With or without an updated Brexit deal, three votes are scheduled between March 12 and 14.
March 12 – Meaningful vote on a new Brexit deal. Prime Minister Theresa May promised to renegotiate with the EU, especially on the Irish backstop issue. As the EU has so far refused to reopen negotiations, the best PM May could do is to secure some "legal guarantees".
March 13 – No-deal vote. If the "new" deal is again rejected on March 12, PM May would table a motion, asking if the MPs support to leave the EU without a deal on March 29. This is to get explicit consensus from the parliament as PM May affirmed that the UK "will only leave without a deal … if there is explicit consent in the House for that outcome".
March 14 – Vote on Extension of Art. 50 (delaying the time to officially leave the EU from Mar 29, 2019). If the above motion is rejected, meaning the parliament rejects a no-deal Brexit with a majority, it would then have to vote on whether to "seek a short, limited extension to Article 50". If the extension is approved, PM May would have to seek unanimous approval from the EU parliament on the extension.
Even with the arrangement, there is still some uncertainty left. In case of a delay, a short timeframe would unlikely be meaningful for any breakthrough. Some in the EU parliament instead propose a 21-month extension. A longer extension would increase the chance of a second referendum. And, while it is more likely that the majority would vote for an extension if no deal is approved, May has yet to reveal a contingency plan should the extension vote be rejected.
But after all for now, the stage is set that there will only be no-deal Brexit if there is "explicit consent" in the Parliament.
Global treasury yields surged, but JGB stayed negative
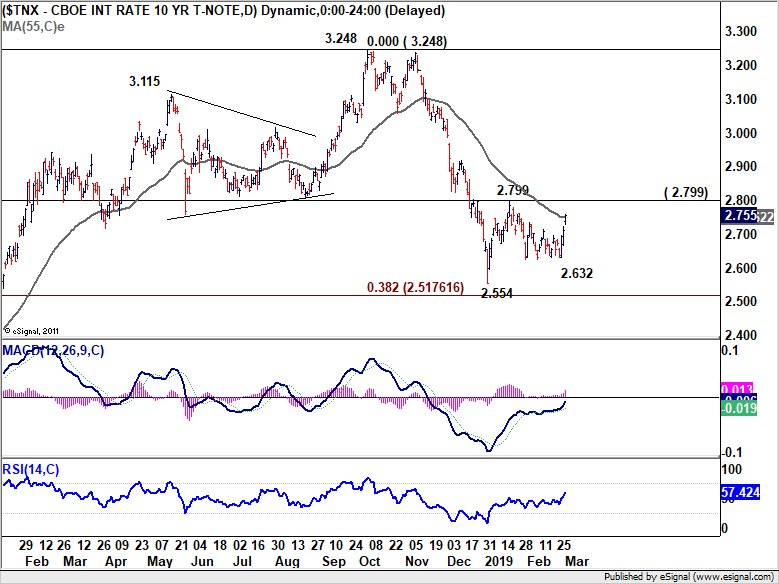
The developments in the financial markets are a result of a combination of all factors in particular the above three. Treasury yields in US, UK and Germany surged sharply over the week. US 10-year yield rose 0.1 to close at 2.755 last week and reclaimed 2.7 handle. Consolidation from 2.799 has likely completed at 2.632. Immediate focus is back on 2.799 resistance this week and break there will confirm this bullish case. More importantly, that would also indicate that medium term correction from 3.248 has completed at 2.554, ahead of 38.2% retracement of 1.336 (2016 low) to 3.248 (2018 high) at 2.517. And there is prospect of retesting 3.248 ahead in this case.
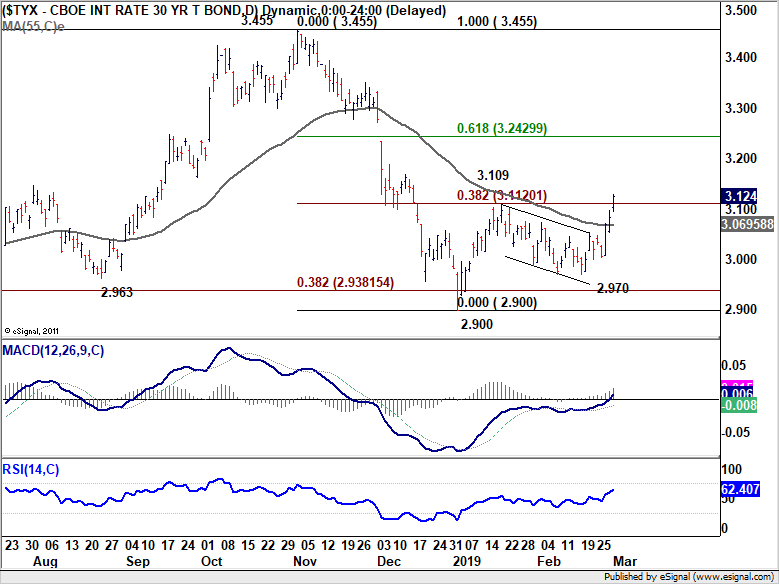
US 30-year yield was event stronger and affirmed the 10-year yield bullish development. Equivalent resistance at 3.109, which is close to 38.2% retracement of 3.3455 to 2.900 at 3.112, was firmly taken out. Rebound from 2.900 has resumed. And correction from 3.455 should have completed at 2.900 after hitting 38.2% retracement of 2.102 (2016 low) to 3.455 (2018 high) at 2.938. Further rise should be seen to 61.8% retracement of 3.3455 to 2.900 at 3.242 in near term. There is also prospect of retesting 3.455.
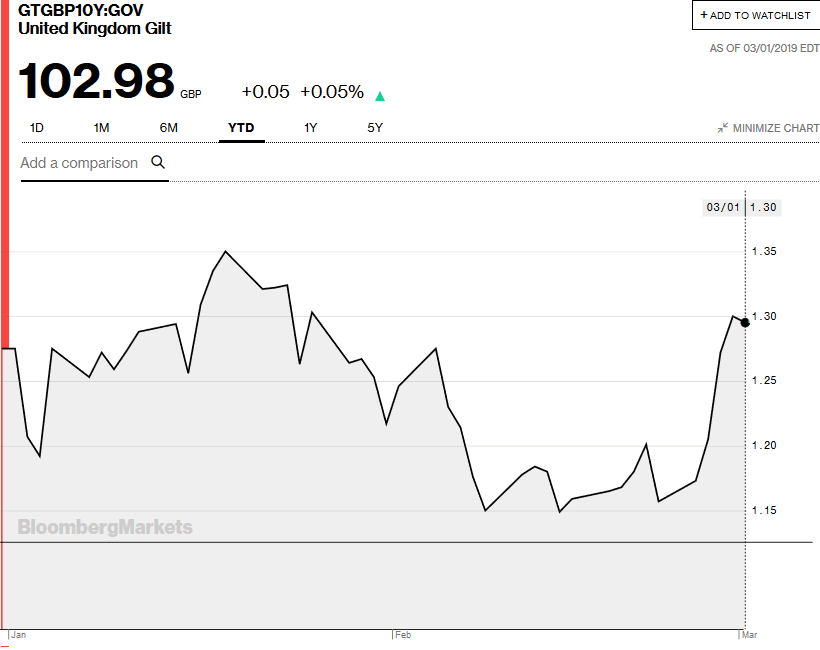
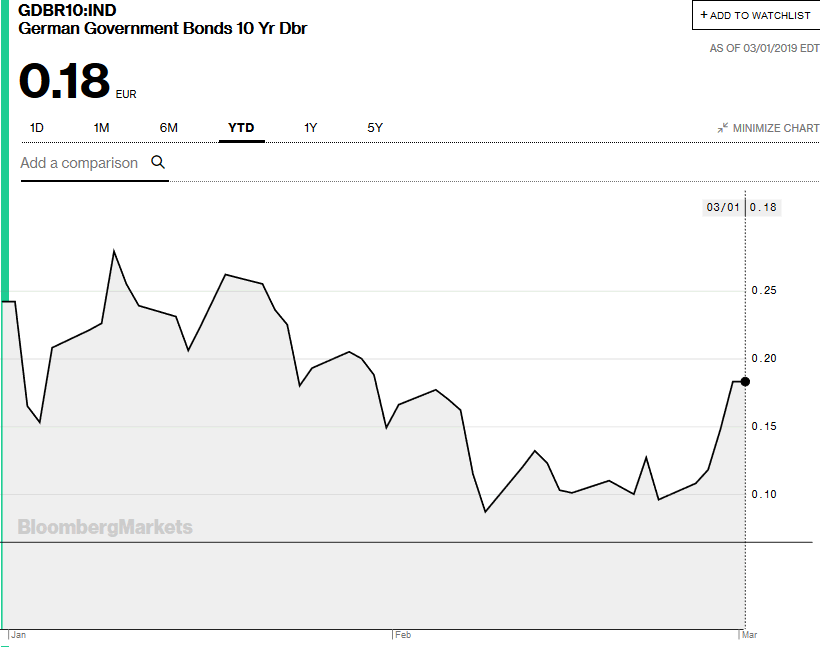
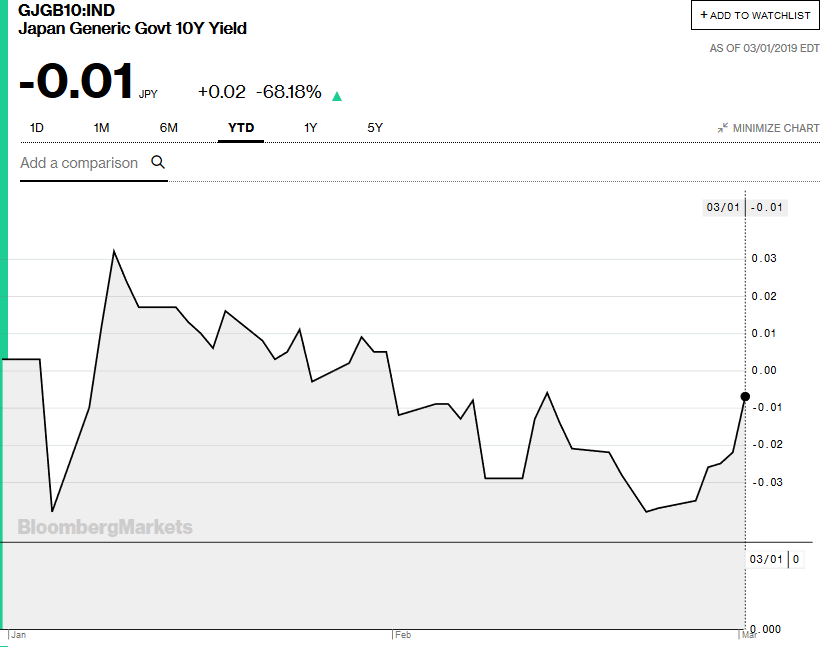
Strong rallies were also seen in UK 10-year gilt yield and German 10-year bund yield. Japan 10-year JGB yield rose too but closed negative at -0.01.
US stocks firm but lacked momentum, Chinese stocks powered up
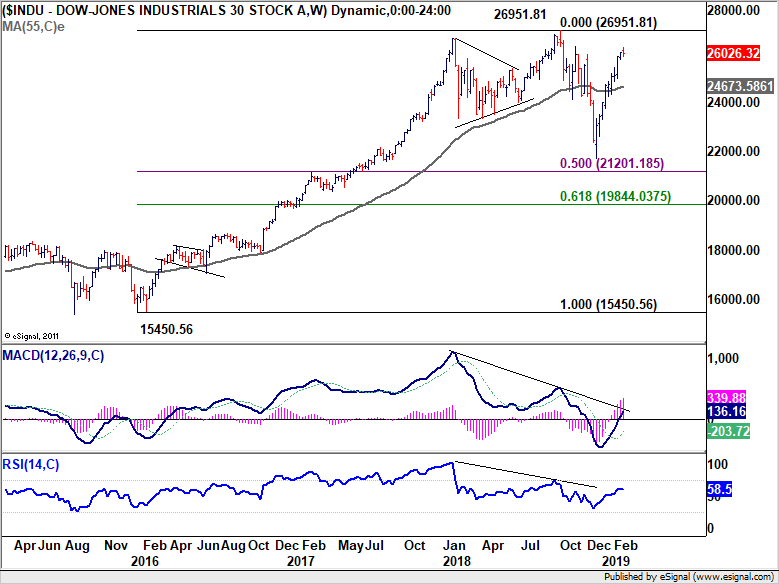
US stocks were firm last week but lacked upside momentum. DOW hit as high as 26241.42 on Monday but retreated since then. As noted before, DOW is already in sell zone above 78.6% retracement of 26951.81 to 21712.53 at 25830.6041. We're only viewing rise from 21712.53 as a leg in the consolidation pattern from 26951.81 only. Thus, even in case of another rise, DOW should continue to lose upside momentum. Indeed, it's already losing momentum as seen in daily MACD. Break of 25762.21 support should at least trigger pull back to 55 day EMA (now at 25062.58) with prospect of reversing whole rise from 21712.53.

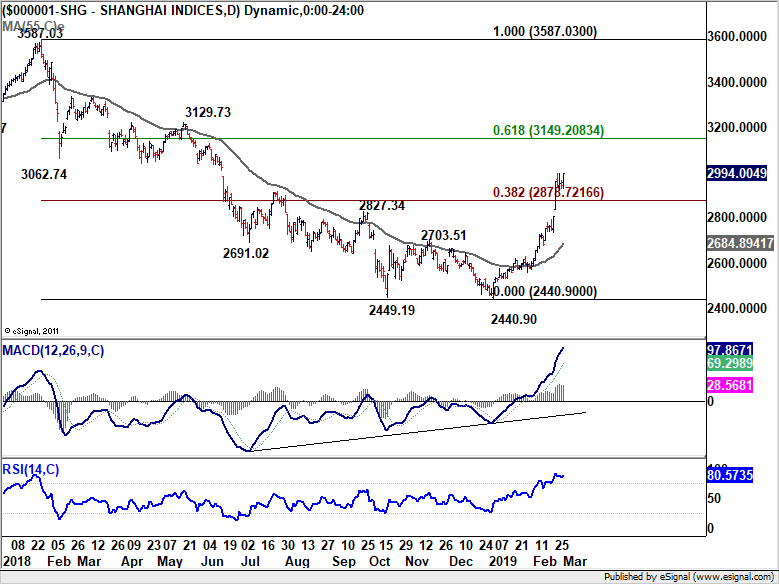
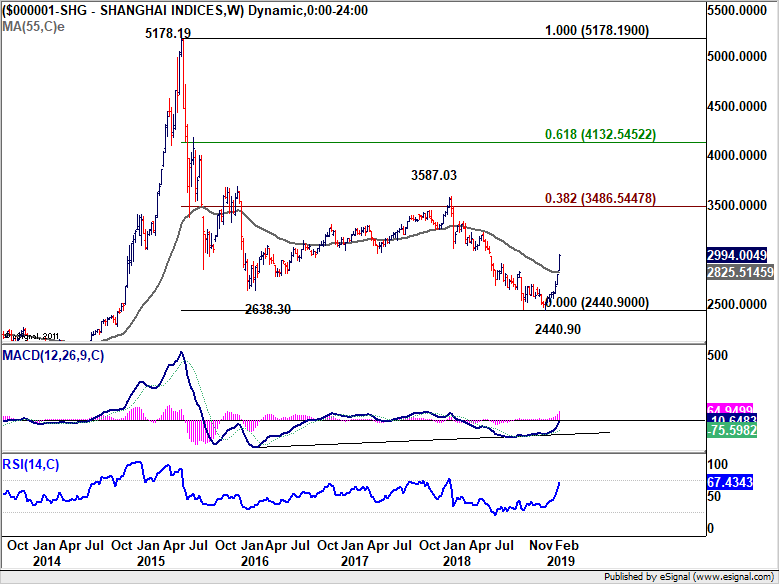
The rally in Chinese stocks last week were totally out of our expectations. Shanghai SSE took out 38.2% retracement of 3587.03 to 2440.90 at 2878.72 last week. Further rise should be seen to 61.8% retracement at 3149.20 in near term. More importantly, the strong break of 55 week EMA argues that corrective fall from 5178.19 (2015 high) has completed with three waves down to 2440.90 (on bullish convergence condition in weekly MACD. There is prospect of heading back to 38.2% retracement of 5178.19 to 2440.90 at 3486.54 in medium term.
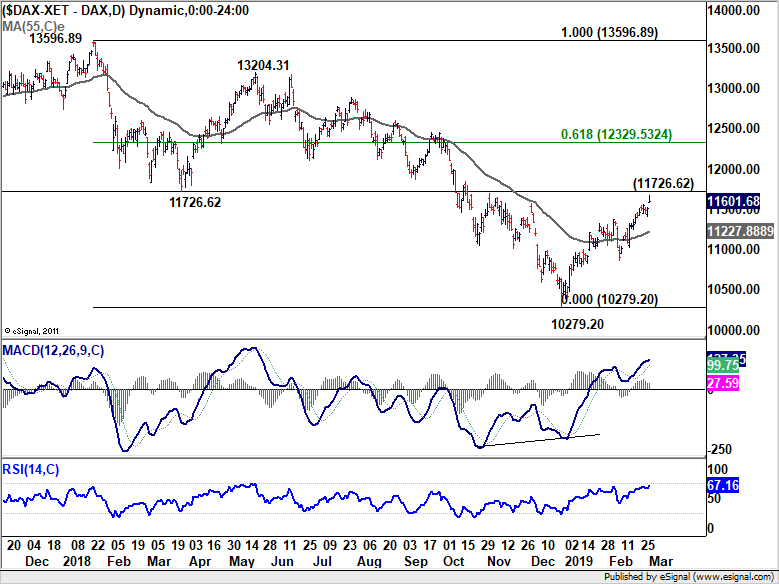
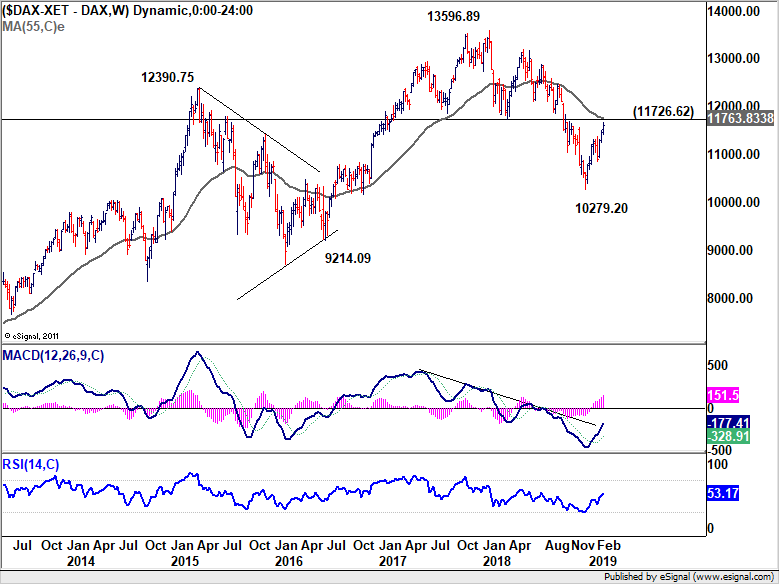
German DAX extended the rebound from 10279.20 last week. It's partly lifted by much stronger than expected German retail sales data too. Near term outlook will now stay bullish as long as last week's low at 11416.08 holds. Focus is immediately on 11726.62 key resistance. It's close to 55 week EMA (now at 11763.83). Decisive break should confirm completion of medium term correction from 13596.89 (2018 high). And in that case, we should at least see further rise to 61.8% retracement of 13596.89 to 10279.20 at 12329.53.
Position trading
We have a AUD/JPY short position (sold at 78.40). Our stop at 79.84 was not hit despite a couple of rally attempt in the cross. We were totally wrong on expectation of Yen strength. In particular, the envisaged rejection by 55 day EMA in USD/JPY and EUR/JPY didn't happen. Instead widening yield spreads pushed both USD/JPY and EUR/JPY sharply higher, taking out key resistance levels. The case for up trend resumption in Yen is no longer there.
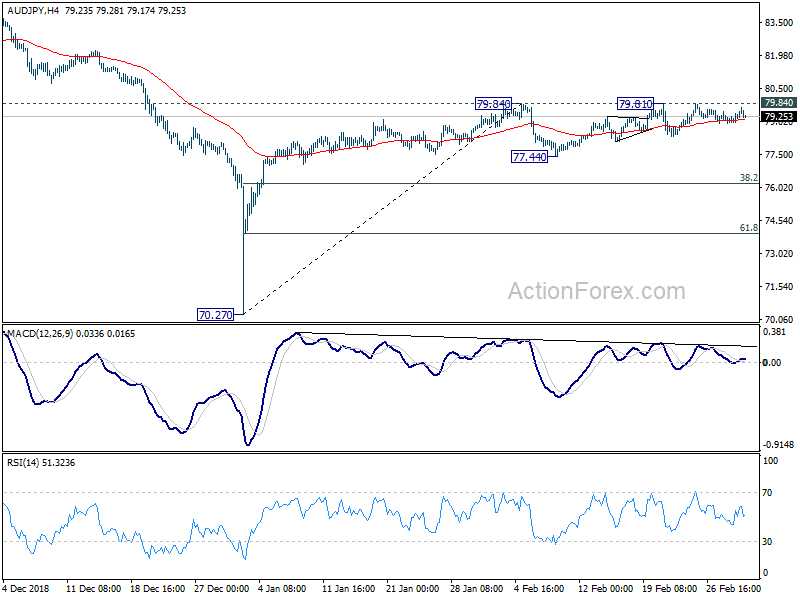
Nevertheless, we were still correct in expectation of Aussie weakness. Such weakness in best seen in the lack of positive reaction to the strong rally in Chinese stocks. And, fundamentally, expectation of RBA rate cut continued to build up. Some further selloff could be seen ahead after RBA rate decision, Australia GDP, trade balance and retail sales this week.
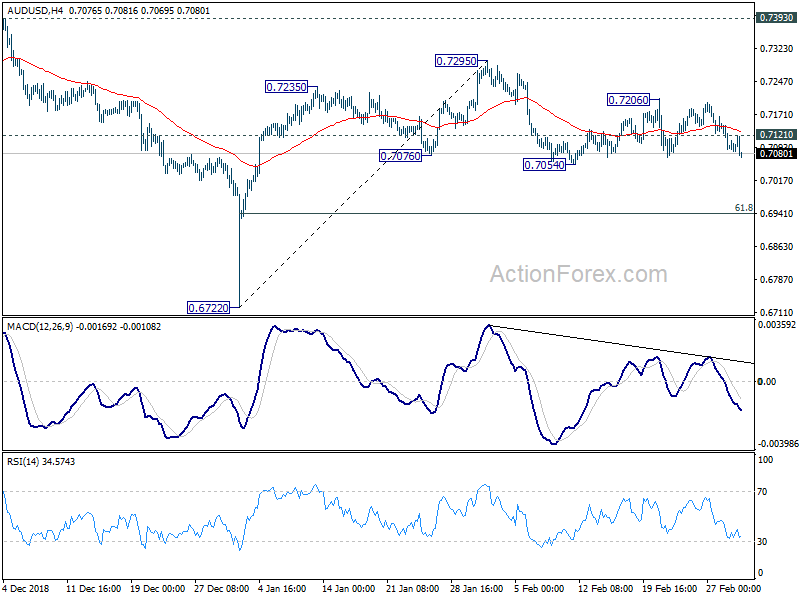
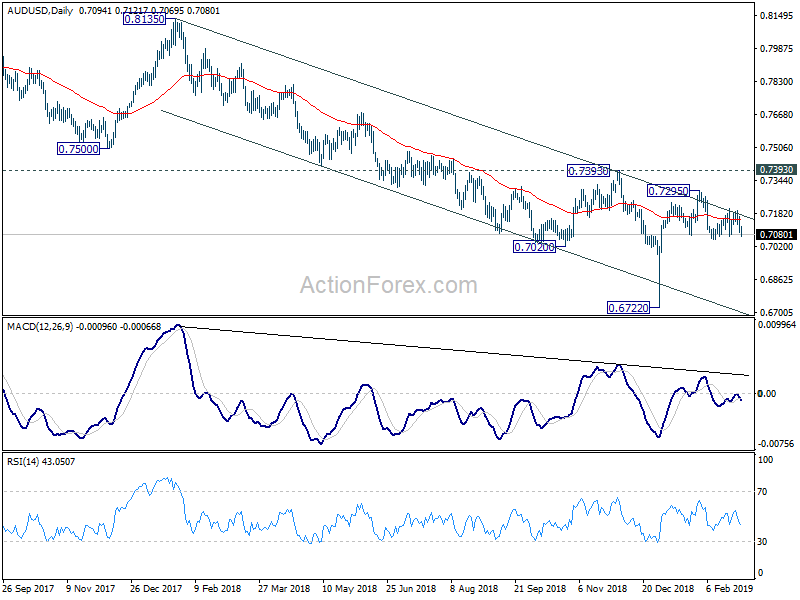
Considering all, we will switch from AUD/JPY short to AUD/USD short this week. We'll close the AUD/JPY at market open. Then, we'll sell AUD/USD on break of 0.7050 (below 0.7054 support), with stop at 0.7125 (above 0.7121 minor resistance). Firm break of 0.7054 will confirm completion of rebound from 0.6722. AUD/USD is holding inside medium term channel and failed to sustain above 55 day EMA, which keeps medium term down trend intact. While 0.6722 is the first target, we're actually looking at breaking 0.6722 to resume larger down trend to 0.6008 (2008 low).
EUR/JPY Weekly Outlook
EUR/JPY rose strongly to as high as 127.50 last week before closing at 127.19, as rise from 118.62 extended and accelerated. Initial bias remains on the upside for 61.8% retracement of 137.49 to 118.62 at 130.28 next. On the downside, break of 126.60 minor support will turn intraday bias neutral and bring consolidations first. But downside of retreat should be contained by 124.23/125.95 support zone to bring rise resumption.
In the bigger picture, current development argues that medium term decline from 137.49 (2018 high) has completed with three waves down to 118.62 already. Decisive break of 133.12 resistance will confirm this bullish case. And whole up trend from 109.03 (2016 low) might resume through 137.49 in that case. On the downside, break of 124.23 support will invalidate this case and turn focus back to 118.62 instead.
In the long term picture, EUR/JPY is staying in long term sideway pattern, established since 2000. Fall from 137.49 is seen as a falling leg inside the pattern and could have completed. Break of 133.12 resistance will likely send EUR/JPY through 137.49 towards 149.76 (2014 high).
Trump asked China to remove all agricultural tariffs, is it the turning point in trade negotiation?
US Trade Representative has formally scheduled to publish a notice regarding extension of trade truce with China. It said in the notice that it is "no longer appropriate" to raise tariffs on Chinese products due to the progress of trade negotiations. And, "the rate of additional duty for the products covered by the September 2018 action will remain at 10 percent until further notice." The notice will be published in the Federal Register next week.
After that, Trump tweeted "I have asked China to immediately remove all Tariffs on our agricultural products (including beef, pork, etc.) based on the fact that we are moving along nicely with Trade discussions.... ....and I did not increase their second traunch of Tariffs to 25% on March 1st. This is very important for our great farmers - and me!"
https://twitter.com/realDonaldTrump/status/1101620176947236866
It's uncertain what China's response to Trump's request would be. From China's point of view, the logical equivalent response to Trump's refrain from more tariffs is not to impose retaliation measures of their own. And China has already made some good-faith purchases of US soybeans since the start of trade truce. Chinese leaders could have their own rationales in rejecting Trump's requests. The negotiation could turn down hill if China does say "no".
And as a recap, Trump said after the summit with North Korean leader Kim Jong-un collapsed that "I am always prepared to walk," and "I'm never afraid to walk from a deal, and I would do that with China, too, if it didn't work out." He walked away from a deal with Kim after traveling all the way to Vietnam. He can certainly walk away from a deal with China sitting in the Oval Office.
This could be the turning point in whole US-China trade negotiations
Summary 3/4 – 3/8
Monday, Mar 4, 2019
[php_everywhere instance="1"]
Tuesday, Mar 5, 2019
[php_everywhere instance="2"]
Wednesday, Mar 6, 2019
[php_everywhere instance="3"]
Thursday, Mar 7, 2019
[php_everywhere instance="4"]
Friday, Mar 8, 2019
[php_everywhere instance="5"]
Canadian ‘Solo’ Recession Risk: Rhetoric vs Reality
Highlights
- Canadian economic growth has decelerated markedly, and a repeat of the fourth quarter's near-zero pace is expected in 2019Q1. This growth slump has led clients to question whether Canada can contract or stagnate alongside an otherwise healthy U.S. counterpart.
- It is rare, but the answer is yes. The typical escape valve of an improving external trade balance is less impactful than in the past. The present situation echoes 2015, but with slightly different drivers at work.
- The term recession is thrown around a lot without appropriate qualifiers. Absent a severe external shock, the risk we see is at most a 'technical' recession, with the more likely outcome a short period of stagnation. Any throttling back in activity is likely to lack the required combination of breadth, depth and duration to mark a true recession.
- Labour markets and credit growth are the key areas to watch in assessing the risk of a downturn.
Canada is in the midst of a growth slump. Weaker-than-expected near-term economic momentum has emerged, at the same time that energy sector production curtailments are sending growth temporarily lower. Today's weak GDP report (0.4% q/q saar) is likely to be followed with another near-zero out-turn in 2019Q1. Such a modest forecast means that it would not take too much of a miss versus expectations to send first quarter growth into negative territory. This has led clients to question the possibility of Canada entering a recession independent of a downturn in the United States.
A 'true' recession that hits all the economic markers is highly unlikely, but a technical recession is a possibility. A 'technical' recession is defined as lacking the combination of depth, breadth and duration. This is where GDP may contract or stagnate for two or more quarters in the absence of a parallel broad labour market stress. This is also where the bar is set for a 'true' recession that comes with widespread industry output contractions and significant employment losses across much of the nation.
We need only look back to 2015 to find evidence that Canada can indeed experience a 'technical recession' while the U.S. continues to expand. Although this is not common historically, we believe it's possible that Canada may experience more of these temporary de-couplings from U.S. dynamics in the future. The "escape route" for Canada has often been the external sector, where depreciation of the Canadian dollar and healthy U.S. demand help to offset weakness elsewhere in the economy. This dynamic, however, has become more muted over the years, and other growth drivers lack pent-up demand to offer a large cushion (i.e. the housing sector and consumer spending).
Within the current cycle, the risk of a technical recession cannot be dismissed, but the data does not point to a downturn at present. Indeed, an assessment of key leading indicators points to a growth slump, not a contraction.
Getting our definitions right
Discussions of recession risks can often get bogged down in definitional distinctions, so it is important to distinguish between three types of economic performances before delving into the analysis. The first is a growth slump, where the economy manages to eke out growth, but just barely. This is, in effect, our near-term forecast. The second is a 'technical' recession (sometimes called a 'statutory recession' as it meets the definition included in the (since repealed) Federal Balanced Budget Act of 2015. This requires at least two consecutive quarters of economic contraction, and little else. A 'true' recession has a much higher bar – not only an economic contraction, but one that comes with breadth and depth. Compare for instance, the 2008/2009 recession, which saw the national unemployment rate rise 2.5 percentage points (and rise in all provinces), with the 2015 statutory recession, where the increase was a more modest 0.5 percentage points, driven by a narrow set of provinces with exposure to the energy sector: Alberta, Saskatchewan, and Newfoundland and Labrador.
The focus of this analysis is on the risk of a technical recession, which cannot be ruled out simply because of strong U.S. economic dynamics. The risk of a 'true' recession is quite low at present, and has effectively never occurred in history without a matching contraction south of the border.
Weakened external channels heighten Canadian risks
History shows that a U.S. recession is a necessary (but not sufficient) condition for a Canadian downturn (Chart 1). Indeed, not since the government policy-induced recession of the Korean War era has Canada entered a 'true' recession without the U.S. also in the same predicament. This 1950s incident is not even captured in Statistics Canada's current historical series for quarterly GDP and given the unique situation and cause, bears little informative value for the current context.1
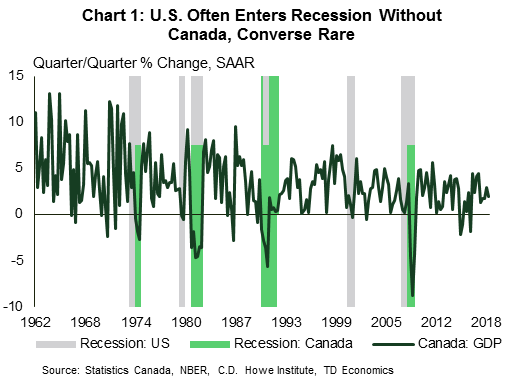
Thus, even though there is a precedent, a Canada-only 'true' recession is effectively unheard of. But, as the well-known disclaimer says, past returns are not necessarily an indicator of future performance. One potential reason not to dismiss this risk is that the "escape valve" provided by a floating currency and the external sector may not be functioning as strongly as it once was. It was a softer currency and rising exports that helped Canada remain in positive territory during the 1998 Asian debt crisis, as well as the 2001 U.S. dot-com implosion, even as domestic demand softened markedly.
This brings us to the core message of this report. It is unlikely for Canada to enter a 'true' recession without the U.S., but a statutory or technical recession is a different story. 2015 is a helpful example of this. Over the 2015Q1 to 2016Q3, Canada saw three quarters of economic contraction (two back-to-back) and effectively no growth traction in between those periods. This ticked the box on the downturn having duration. But, importantly, the weakness was not widespread across industries or labour markets among the provinces, thus not qualifying as a 'true' recession.2 The 2015 episode marks a technical recession in our books. This was a rare occurrence considering that three other periods of weak economic momentum (1986, 1995, and 2001) failed to meet the two-quarter contraction bar of a technical recession. This is true even in instances where the U.S. economic cycle was formally characterized as a 'true' recession (2001) by the National Bureau of Economic Research (NBER).
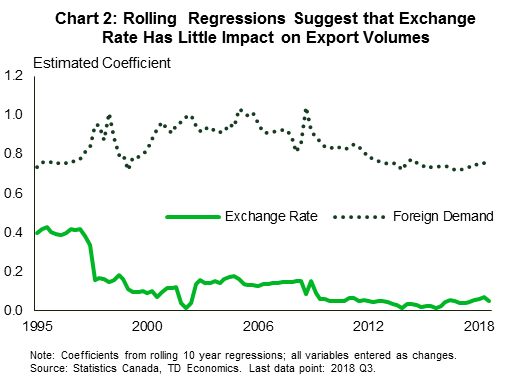
Although the 2015 experience is rare, it would not surprise us to see more of these experiences in the future for a couple of reasons. To begin with, simple rolling regression results indicate that the relationship between the currency and exports has weakened materially, particularly since the late 1990s (Chart 2). To be sure, the evidence still shows that a weaker loonie should give a short-term boost to exports, but the effect is nowhere nearly as pronounced as it has been in the past.
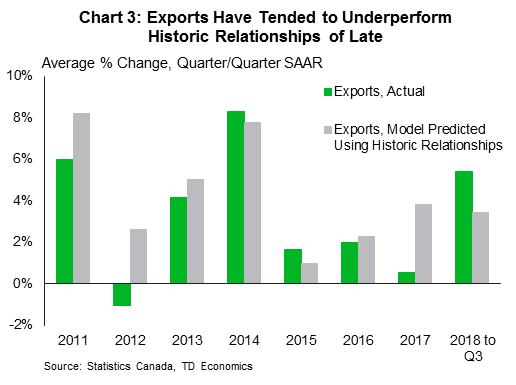
Further analysis suggests that even the rolling regression results for foreign (largely U.S.) demand may be overstating the case, or at least oversimplifying. Drilling into Canadian export performance post-crisis, we've seen a tendency for exports to underperform their historic relationship with foreign demand, to the order of about 1 percentage point on average (Chart 3).3 Slicing observations into smaller and smaller pieces is getting into data mining territory, so a grain of salt is need. But, there does appear to be evidence that past macroeconomic relationships have weakened.
With evidence that the external sector 'escape valve' may not be operating quite as strong as it once has, it would seem short-sighted to ignore the risk of a downturn simply because the U.S. economy appears healthy.4 Again, we should remember our definitions: the foreign demand channel is weaker, but it hasn't vanished. The trade and currency dynamic within in a 'true' recession (as unlikely as that occurring in Canada alone is), would still place a floor under the Canadian economy. Thus, we are again talking about the risk of 'only' a statutory recession. Importantly, the data and trends don't even support this outcome at the moment.
Canada broadening its horizons
Although Canadian goods exports (ex-energy) to the U.S. have been stagnant, shipments to other regions are showing some promise. Geography and other factors mean that the U.S. will always be a key factor behind the strength of Canadian investment and exports, but other markets have become a little more important recently. Over the last two years, Canadian exporters have enjoyed increased access first to Europe, via CETA, and, from January 2019, many Pacific Rim South American nations via CP-TPP.
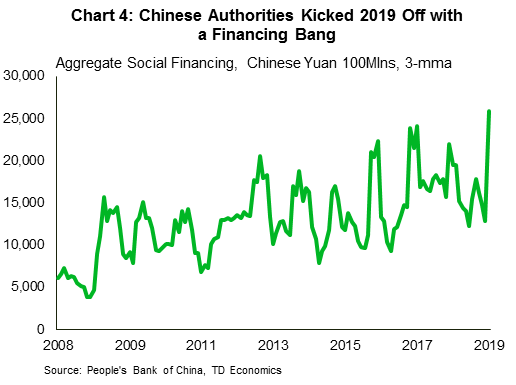
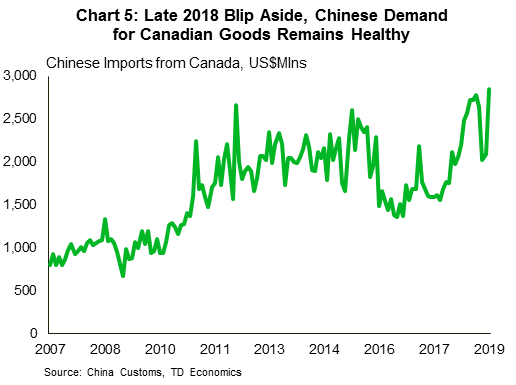
The near-term signals suggest more help may be on the way. A slowdown in China has been having direct knock-on impacts to Asian and European economies, with indirect impacts on Canada via reduced overall foreign demand. However, in recent months, Chinese authorities have made significant efforts to re-invigorate their economy. This has come in the form of eased reserve requirements for banks, and an increase in overall financing flows, even larger in scope than the stimulus introduced during the Global Financial Crisis (Chart 4). The surge of financing should make its way through the Chinese economy in the next two to three quarters, and, by extension, help support overall world exports through a virtuous cycle. Canada would benefit as demand throughout the Chinese supply chain rises, supporting global growth and lubricating the export flows with Canada's new trade pacts in place. This comes in addition to the direct impacts of Chinese imports from Canada, which have been quite healthy of late (Chart 5).
Inventories piling up
However, the key risk to Canada entering a technical recession or prolonged economic slump doesn't stem from the external trade sector, but from domestic drivers. Standing out as a clear risk is the sharp inventory build up in the latter part of last year (Chart 6). Wholesale inventories in particular are concerning, popping up to an all-time high in December 2018. While not quite as dramatic, the manufacturing sector has also seen a rapid rise, as sales fell in each of October, November and December.
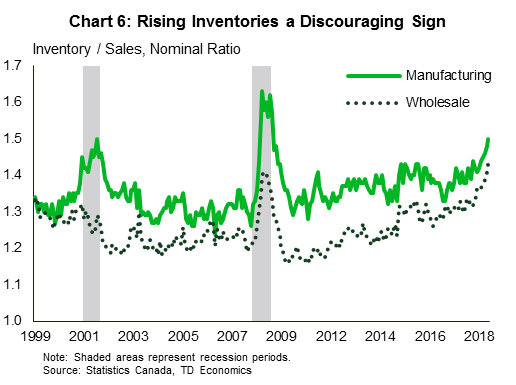
Diving a bit further into the data reveals a handful of sectors that are on the bubble. Most notably, wood product manufacturers have seen inventory levels climb rapidly, likely due to softness in both Canadian and U.S. housing markets and ongoing trade issues. Early data suggests some upside to activity in these markets, but for Canada in particular, the path forward is far from certain. Elsewhere, the ratio is elevated at present among plastics and rubber product manufacturers, as well as primary metal manufacturers. Further demand weakness could lead to an adjustment on the production side, sapping economic output. Clearly the risks to the sales side are tilted to the downside, so the signal coming from this data is clear. With increases concentrated in a few industries, the risk looks more like a statutory recession, not a true one.
Domestic challenges significant
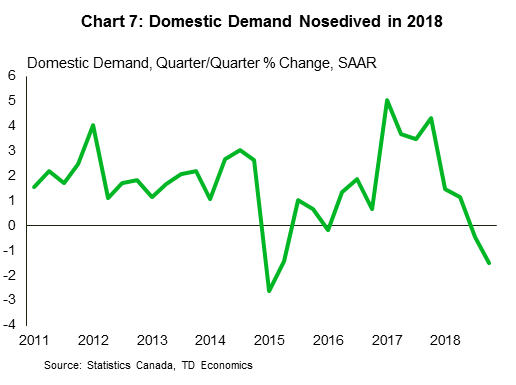
As inventories have built up, final domestic demand has been slowing, decelerating markedly over 2018 following a strong 2017 (Chart 7). Domestic demand has now contracted for two straight quarters, the first time since 2015, and with business investment stubbornly weak. However, domestic demand is dominated by consumer spending, which is in large part of function of the credit cycle. This cycle has already turned into a decelerating phase.
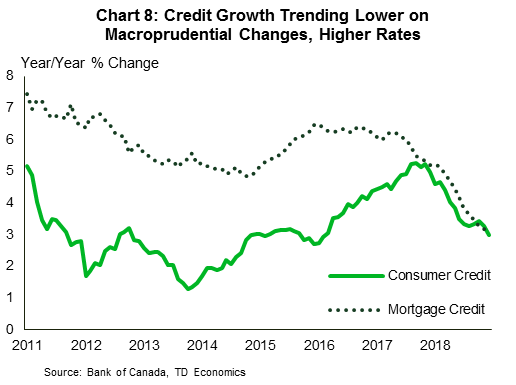
Both consumer and mortgage credit have been trending lower, with the latter impacted by changes to mortgage underwriting rules that sapped borrowing demand last year (Chart 8). Consumer credit actually contracted on a month-on-month basis for the first time since 2011, in December 2018.
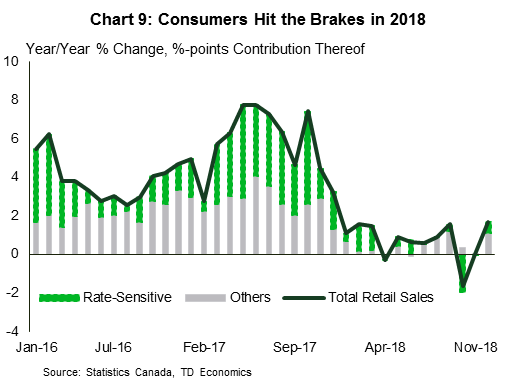
Monthly noise aside, all the signs are in place for a 'soft' deleveraging cycle, in which credit growth remains in positive territory but trends below household incomes. The result has so far been what we expected: a generalized slowing in consumer spending, particularly in spending on interest rate sensitive categories, such as autos and those categories linked to housing, such as furnishings (Chart 9).5 Retail sales don't capture the complete spending picture: service spending takes the lion's share of consumer dollars. But, it can be a swing factor, and serves as an early bellweather of consumer activity. This is sending a clear softening signal, reducing the economic 'cushion' in the event of a shock.
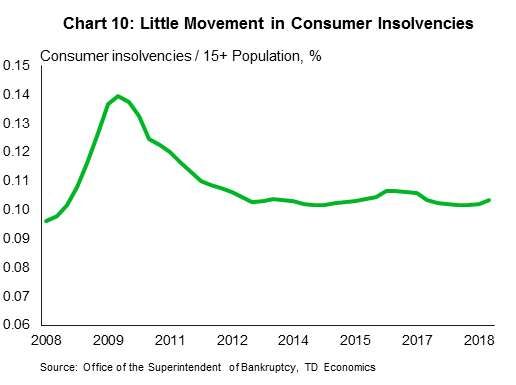
If there's an area where late cycle dynamics have not taken hold, it is within consumer insolvencies. A much discussed rise in consumer insolvency activity in late 2018 looks more like a blip once it is put into perspective (Chart 10). Our analysis suggests that it takes a deterioration of labour markets to get a meaningful increase in insolvencies, and even then, the impact comes with about half a year's lag, meaning this data is not a leading indicator of a cycle.
Labour market still a bright spot
Turning back to the insolvency picture, the reason Chart 10 doesn't look worse is likely because, in aggregate, Canadian labour markets have remained solid (see report). Roughly 195k net jobs were added over 2018, with a further 67k to kick off 2019, according to the labour force survey. The less timely payrolls survey paints an even rosier picture, indicating that more than 320k net payroll positions were added in 2018, even including December's modest pull-back.6 The result is an unemployment rate near 40 year lows, alongside record high participation rates.
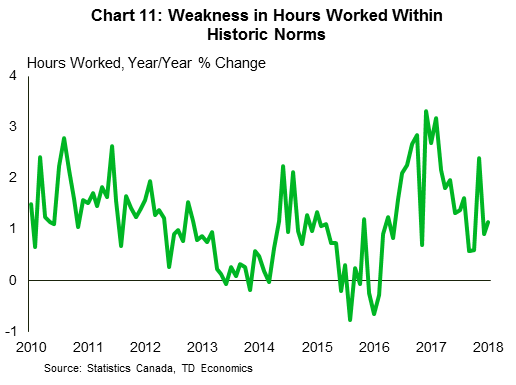
As strong as labour markets have been, there are nevertheless two flies in the ointment. First, wages have been decelerating, a somewhat perplexing development. At least part of this appears due to weakness in Alberta, where past oil sector shocks were still reverberating in labour markets even before late last year's heavy oil pricing crunch. As such, this should reverse, and we have seen some very tentative evidence of this in the January data. The second fly is recent weakness in aggregate hours worked, which fell in both December and January. This data can be useful as an early indicator of economic weakness (in contrast, the unemployment rate tends to be a coincident to slightly lagging indicator), but the fortunate news is that this data can also be quite volatile, with a few months of weakness hardly atypical even during robust expansions. Indeed, the current reading remains well within historic norms (Chart 11). Again, we should not be dismissive of the risks, but scale matters, and current readings are well shy of any recessionary territory.
Real estate set for a slog
Falling somewhere in between the credit cycle and still healthy labour markets are Canadian real estate markets. Regional divergence remains the theme, with markets in the west still soft, Quebec hot, and Ontario/GTA falling somewhere in between. This is reflected in the most recent data, which saw home sales rise 3.6% in January 2019 (m/m, SA). As discussed in our December housing outlook, we don't expect January's performance (which came after several months of falling sales) to be repeated. More likely is a gradual slog upwards, with activity and price growth held back by still stretched affordability, rising borrowing costs, and in the case of prices, a relatively full supply pipeline in Vancouver and to a lesser extent, Toronto.
So, why not a worse outlook, or even an outright crash? Two reasons: first, fundamental demand is still strong, particularly in key markets. Canadian population growth hit a record in 2018, and government targets will see continued strong inflows, with many new Canadians supporting demand in the 'landing pad' cities of Toronto and Vancouver, where populations rose at least 130k and 40k respectively last year.7 Second, the change in tone from both the Bank of Canada and the U.S. Federal Reserve in light of late 2018 developments (market volatility, energy sector challenges, global growth deceleration, etc.) provides some additional market sentiment support in the form of lower than previously expected borrowing costs.
Ultimately, the theme of this note is echoed in this sector. The outlook is for modest activity that leaves less of a growth-cushion in the event of a negative shock, but growth nonetheless. Less buffer alone does not a downturn make, and as it stands, the situation in housing markets points to elevated risks, not to a downturn.
Don't rule out psychology
If there is a core message to this analysis, it is that yes, risks to the Canadian economy are elevated right now, and the risk of a near-term contraction in activity cannot be ruled out given that our low growth outlook allows little room for error. But importantly, we do not see a strong enough signal to call a downturn, and even if we do get negative prints on GDP growth, the most likely outcome is a shallow, technical recession, not a 'true' downturn.
If there is a caveat however, it is that we cannot ignore risks related to consumer and market psychology. As discussed previously by our Chief Economist, Beata Caranci, negative sentiment can result in a feedback loop, manifesting itself in a "Beetlejuice recession" where growth turns negative simply because people expect it to and act accordingly. For Canada in particular, the risk is probably greatest around household debt and the potential for deleveraging. For an individual household, it may make sense to reduce spending and focus on saving, but if many households take the same approach, the result is, on aggregate, a contraction in economic activity. This is called the paradox of thrift, where individually rational behavior is irrational in aggregate.
A key question is thus how likely is such an outcome? Or, put differently, are negative narratives, whether media or otherwise, sufficient to spur action? While the labour market is doing a lot of heavy lifting in this analysis, it nevertheless appears to be the linchpin for this behavior as well. So long as labour markets remain healthy across most of the country (and importantly, the recent softness in aggregate hours worked proves temporary), it is challenging to envision a sentiment-led retrenchment in consumer spending. That said, the risk cannot be dismissed, and this channel would likely work as an intensifier. As the experience of the U.S. over 2009/2010 shows, consumer deleveraging led recessions tend to be longer and more pronounced. Even absent a downturn, slower growth deleveraging periods can be quite lengthy, lasting about five years on average.8 However, context matters. In the unprecedented event that Canada experiences this downturn on its own, adjustment channels, even in their diminished state, should help reduce the burden – it would likely take a simultaneous U.S. downturn to get to the worst case scenario.
Canadian risk intensity idiosyncratic
The current situation in Canada has echoes of 2015, but with a few important differences. For one, the current shock to the energy sector is clearly temporary, and price dynamics have so far exceeded expectations to the upside. Secondly, the energy sector has, as a result of past shocks, declined in overall importance to the Canadian economy, and at the same time (and more encouragingly) driven efficiency gains over this time, reducing the cost of production. Conversely, the economy received 50bp of policy interest rate cuts in response to the 2014/2015 oil price shock, reducing the impact by spurring growth in other sectors, notably housing. The result was two consecutive quarters of economic contraction and about a year and a half of stagnation, but without enough breadth and leakage into the labour market to qualify as a 'full' recession nationally.9
In contrast, part of the current growth slump this time is by design on two fronts. First, curtailments in oil production shaved an estimated 0.5 percentage points off GDP growth in 2018Q4, with a 1.1 percentage point drag expected in 2019Q1. If not for this, we probably wouldn't be having this discussion in the first place, because growth would otherwise hang closer to the 1.0-1.5% range: below trend, but not dramatically so. Second, the impact of past interest rate increases was combined with macroprudential policy on household finances. Either of these levers can be altered in the event of a large disappointment in the data to mitigate the downside, as was the case in 2015.
Bank of Canada willing to adjust course
As one of the key stewards of the economy, central banks are constantly monitoring developments and adjusting monetary policy accordingly. The Bank of Canada is no exception. As the current growth slump became evident, the Bank's relatively hawkish tone of communication gave way to a more dovish bent, and the January Monetary Policy Report saw their 2019Q1 growth tracking marked down to 0.8% q/q, only modestly above our current tracking. Governor Poloz and company are seeing the same signals that we all are, and has shown willingness to adjust course.
For now, the central bank is in wait-and-see mode, with communications still emphasizing an eventual return to "neutral", currently defined as a policy interest rate within the 2.50% to 3.50% range (See Poloz's recent speech, for instance, and our commentary). Even this may be too lofty a goal. We expect the policy rate to gradually move towards the 2.00-2.25% range, reflecting our relatively more modest assumptions on trend productivity growth, as well as the impact of B-20 mortgage regulations (see commentary). The B-20 changes have, in effect, already tightened policy by 200bps for a sizeable segment of the population. Taking the relative size of the mortgage credit market into account suggests that even today (at 1.75%), the policy interest rate is already within the Bank's 'neutral range' once the mortgage stress test is taken into account.
With all of the evidence that Canada is facing its own pressures at present, narratives that see the Bank of Canada sending the economy into recession by following the Federal Reserve don't make any sense. All forecasts are conditional, and our Bank of Canada outlook is no different, with preconditions to action discussed in our recent Dollars and Sense. A return to 'normal' economic growth is a key precondition for higher rates. The Bank of Canada's mandate is to set monetary policy appropriately to achieve its Canadian inflation target, not to maintain some spread to a foreign interest rate. We expect the Bank of Canada to react to Canadian economic developments, positive or negative, appropriately, even if Canadian conditions diverge from our peers and major trading partners.
Bottom Line
There is no denying that Canada is facing a perfect storm at present. A more intense-than-expected moderation of economic growth came just as North American commodity markets sent Canadian heavy oil prices lower, resulting in an additional near-term growth shock as producers curtailed output. All of this is taking place against a backdrop of still highly levered households facing rising borrowing costs for the first time in a generation. However, a growth slump is not a recession, and there are marked differences between a slump, a technical recession, and a true recession.
That said, the risks are nevertheless significant. Canada's unique position tells us that we can have negative growth without the U.S. needing to also be in contraction. The current growth slump means that we have less 'buffer room' in the event of a shock. Thus, we believe that Canada is currently at a greater risk of a period of weakness than the U.S., a situation that echoes the 2015 experience. It remains most likely that the current slump will give way to a modest growth recovery in the second half of 2019, helped by the end of major energy sector curtailments. Getting from here to there will be no easy feat, and if current weakness in household credit growth is joined by labour markets, a technical or statutory recession would be on deck. However, a 'true' recession would probably still require a U.S. downturn – an unlikely event, at least in the near term.
End Notes
- Synchronization is of course not perfect: the U.S. experienced more prolonged contractions in the mid-1970s and 2009 recessions, while Canada had a much longer downturn in the early-1990s.
- Obviously for those in the most impacted regions, this period was recessionary.
- The 2018 performance is also somewhat misleading as much of the strong performance came in the second quarter as earlier disruptions in the auto and energy sectors resolved themselves.
- The topic of the risks to the U.S. economy is large enough to justify its own report. Put succinctly, our analysis suggests a moderating pace of growth this year, but does not envision a U.S. downturn in 2019.
- Rate sensitive sectors are: automobile dealers, furniture and home furnishings stores, electronics and appliance stores, and building material/garden equipment and related stores. Note that the December y/y uptick is largely due to a base effect from soft spending in 2017.
- Differences in survey methodologies include the treatment of multiple job-holders and self-employment, among others.
- This data is only provided by Statistics Canada on a 3 month moving average basis, thus these figures are approximate.
- See for instance, this 2015 IMF Working Paper.
- Again, this period was obviously recessionary for the energy producing regions.
ECB Preview: No TLTRO Announcement as ECB Waits for Further Data
- We expect the ECB to acknowledge the risks to the euro area economy at next week's meeting but we do not expect to see any policy decisions yet. We do not expect a liquidity operation announcement either.
- The staff projections will be instrumental to the ECB narrative but as several ECB governing council members have emphasised the importance of assessing the impact on the medium-term inflation outlook, we expect the ECB to look through short-term weakness in the data at this stage and note that it remains ready to stimulate the economy if needed.
- While in the near term the growth outlook remains fragile, we do not expect the ECB meeting to change the overall narrative or market sentiment. However, watch for a potential volatile and sharp intraday market reaction as market expectations for the meeting are more dovish than ours.
Waiting for further data
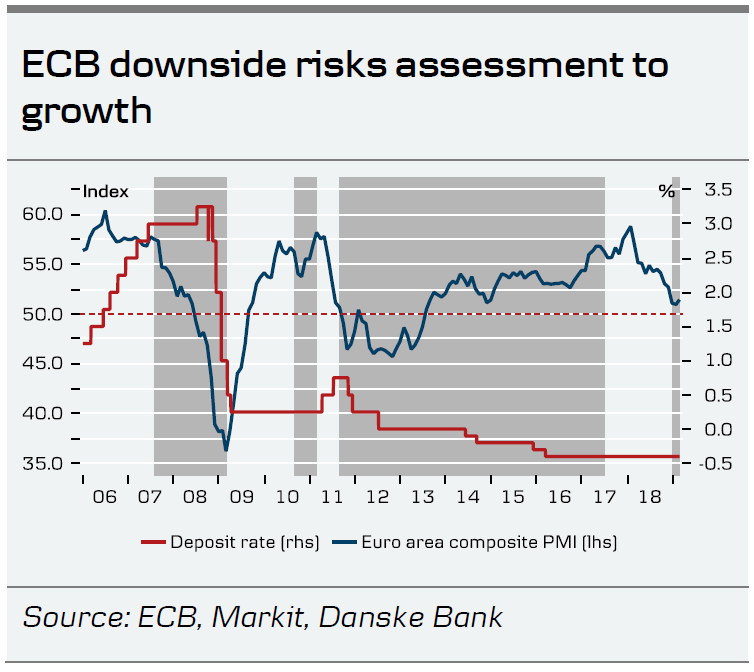
At the recent Governing Council meeting in January, the ECB changed its growth balance of risks to be skewed on the downside. At that stage, it was clear that the January meeting was an 'assessment meeting' and not a 'policy meeting'. However, we do not expect the March meeting to be a policy meeting either. Incoming data since the latest Governing Council meeting has been on the weak side, with some stabilisation noted in some data points. At the same time, the January ECB minutes showed that domestic drivers were broadly intact, as they attributed the main risks to external/political drivers. As a result, we expect the ECB await further data before taking a decision in terms of policy implications. The ECB meeting is set to bring new staff projections. We expect a mechanical downward revision of growth projections, which importantly would not lead to a change in policies at this stage. Over the past month, Governing Council members, particularly Philip Lane and Peter Praet, have re-emphasised that it is the medium-term outlook that is important for conducting monetary policy.
TLTRO – Targeted Longer-Term Refinancing Operations
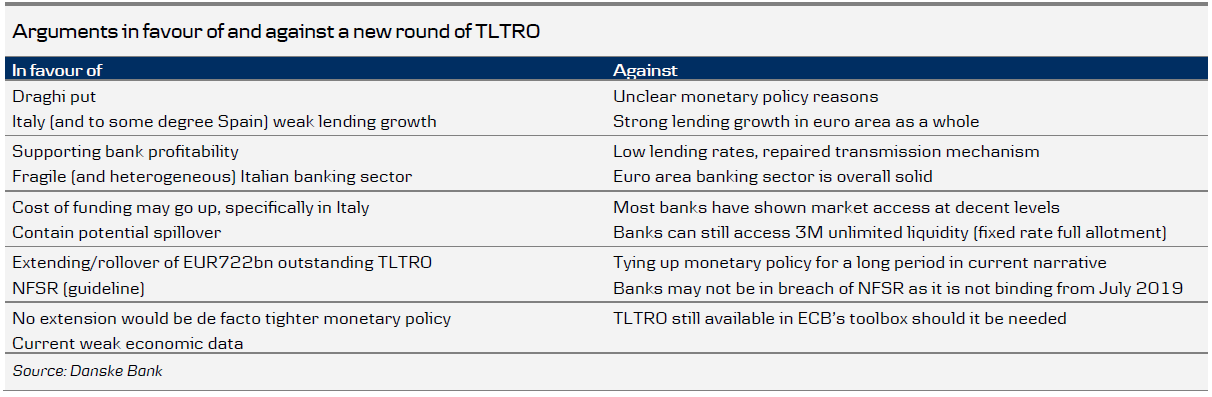
Over previous weeks, the potential of a new liquidity operation (TLTRO) has attracted significant market attention. We discussed why TLTRO was no longer our base case for March in ECB Research – TLTRO - no longer our base case, 8 February, as we did not see a strong monetary policy case already (see also the arguments in the table overleaf). While we do not find compelling evidence for announcing a new liquidity round next week, we highlight that we may see such operations later this year if it is warranted by the monetary policy case. The maturity of the TLTRO starting in June 2020 has drawn attention as 'two', 'some' and 'several' Governing Council members commented on it at the October, December and January meetings, respectively. The ECB minutes from the January meeting indicated that the liquidity situation is being discussed but no 'decisions in this respect should not be taken too hastily'.
Importantly, a potential liquidity operation would be announced to target a specific problem and the modalities would be highly dependent on the problem identified.
Therefore, we stress that a liquidity operation could come later this year. Further to this, we could see a liquidity operation as part of a three-legged package: rate hike, liquidity operation and strong forward guidance. However, given that we believe the current forward guidance on rates will remain at present levels 'at least through the summer of 2019', such a package would require a change in forward guidance at an earlier stage.
Despite low market-based inflation pricing we still expect a rate hike this year
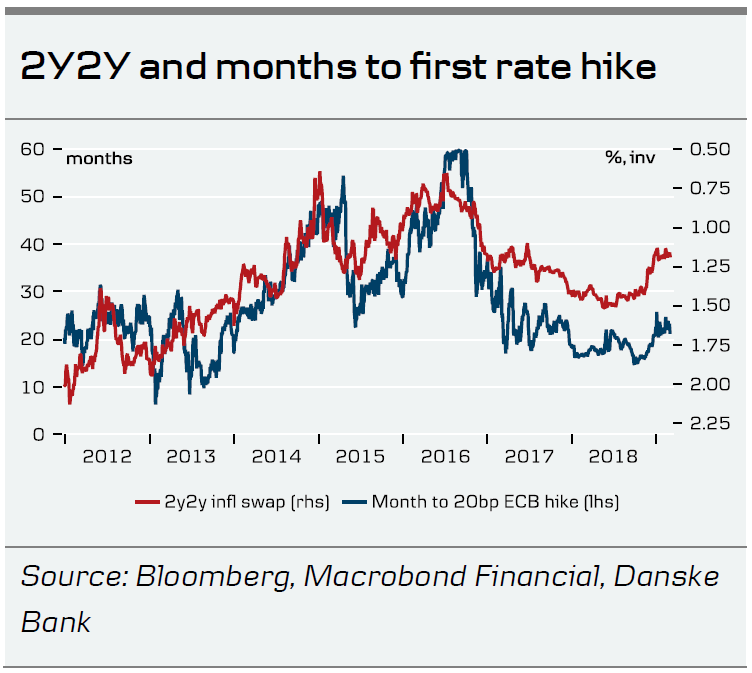
Inflation market pricing, measured by inflation swaps, hast stabilised somewhat in recent weeks on the 2Y2Y horizon after a marked decline around the turn of the year, while only in recent days have we seen some stabilisation in the 5Y5Y area. The repricing is causing concern for the ECB. Amid this, the inflation market has been strongly correlated with rate hike market pricing (measured by the number of months to the first rate hike) and has yet to show an uptrend. In our view, this should come when data turns better. Similarly, we find the results of longer term inflation expectations in the recent survey of professional forecasters results as equally concerning. Expectations have declined to 1.82% (some 6pp above the historical low).
Although we continue to expect a downside risk assessment from the ECB next week, we do not change our ECB rate hike call from December 2019. The softer data at the start of the year has already been warranted, albeit the numbers have been slightly worse than we expected. Our main argument for expecting a rate hike by the end of the year is due to our expectation of wage growth translating into underlying inflation towards summer.
We consider the ECB pricing is still on the dovish side, amid the weaker-than-expected incoming data in January. Currently, only 6bp is priced in for a December 2019 rate hike, which compares with our base case of a 20bp hike at that stage.
Lower growth near term but narrative unchanged
As mentioned above; at the January meeting, the ECB changed its growth risk assessment to the downside. Further, President Mario Draghi hinted that the Governing Council would reassess the implications of the euro area slowdown at a later stage, potentially as soon as March. Hence, the updated economic projections will be instrumental in framing the ECB's policy narrative. Since January, both hard and soft data have on balance surprised on the downside. Euro area growth remained subdued in Q4 18 at 0.2% (well below the ECB's baseline) and PMIs point to continued headwinds in the manufacturing sector despite signs of strengthening domestic demand and rebounding service sector activity. Furthermore, ECB has increasingly become concerned about the negative impact of persistent political uncertainties on business confidence and investments.
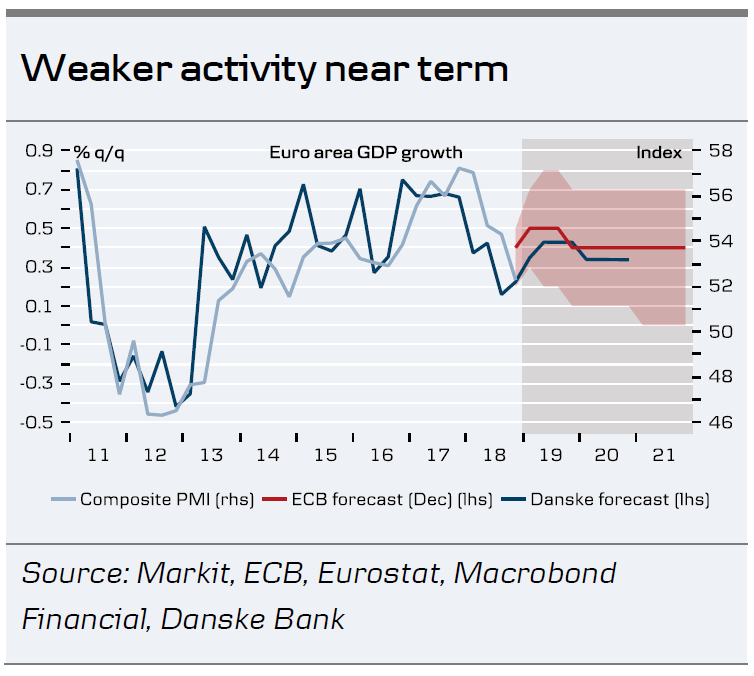
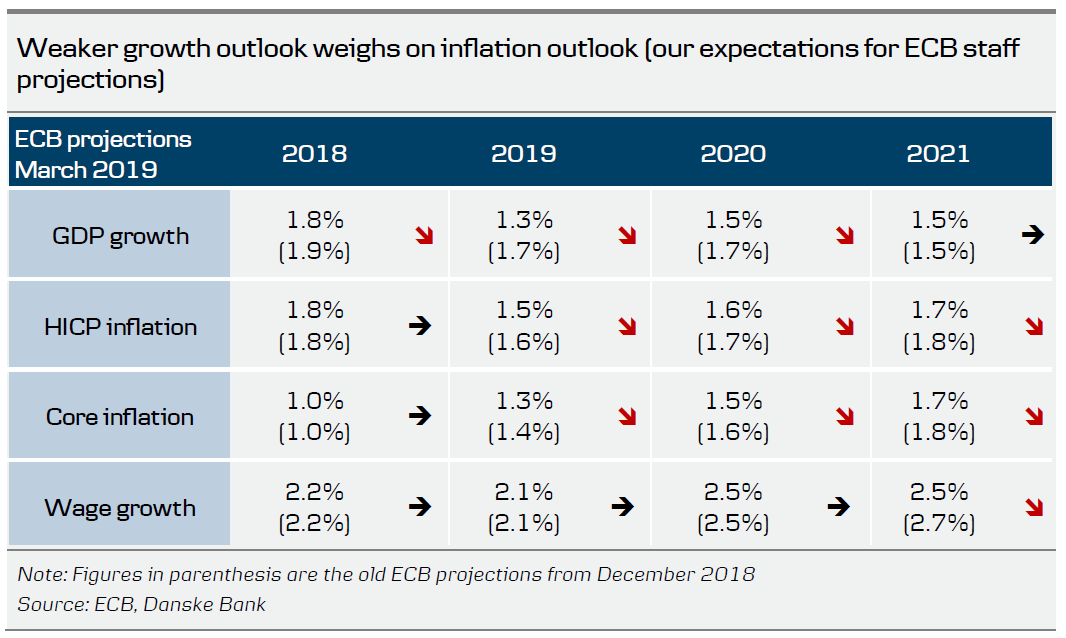
We expect to see a marked downward revision of the growth forecasts for 2019 and 2020 to 1.3% and 1.5%, respectively (see table below). However, more important in terms of monetary policy communication will be whether the growth slowdown is seen as permanent or of a temporary nature. Judging from recent ECB speakers, we believe in the latter and expect the new profile still to show some slight acceleration in quarterly growth rates in H2 19 on the back of stronger domestic demand.
Therefore, we expect the ECB to acknowledge that the euro area economy is likely to grow below potential in the near term. However, with the economy regaining some momentum in H2 19 and growth seen close to potential over the medium term, we think the ECB will hold on to its strategy of gradual policy normalisation and not change the narrative unless the near-term data releases warrant a change in communication.
Softer inflation dynamics
A weaker growth profile over the medium term would also have implications for the inflation outlook and to use ECB Chief Economist Peter Praet's words: 'three-quarters of below-potential growth is certainly not good news'. We expect the ECB to hold on to its narrative that ongoing labour market improvements and rising wages will eventually push up underlying inflation pressures. This said, the (so far) missing transmission from wages to consumer prices is becoming an increasing worry for the ECB, as the January minutes revealed. On the back of the weaker growth outlook, we could see the ECB adopting somewhat softer language regarding the speed and magnitude of wage pass-through to consumer prices. Last week, ECB Vice-President Luis De Guindos has already given a glimpse of this, when referring to the ECB's confidence that underlying inflation pressure 'will pick up within a few months or quarters'.
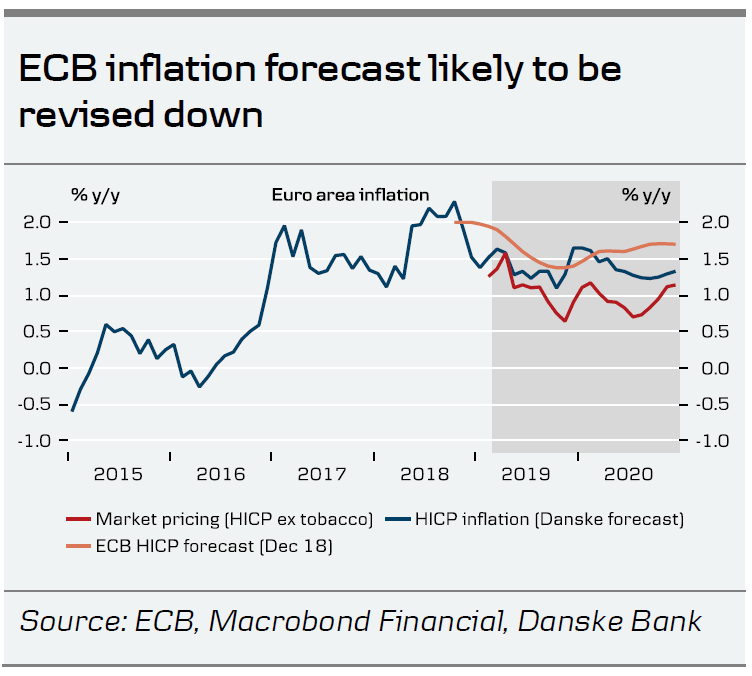
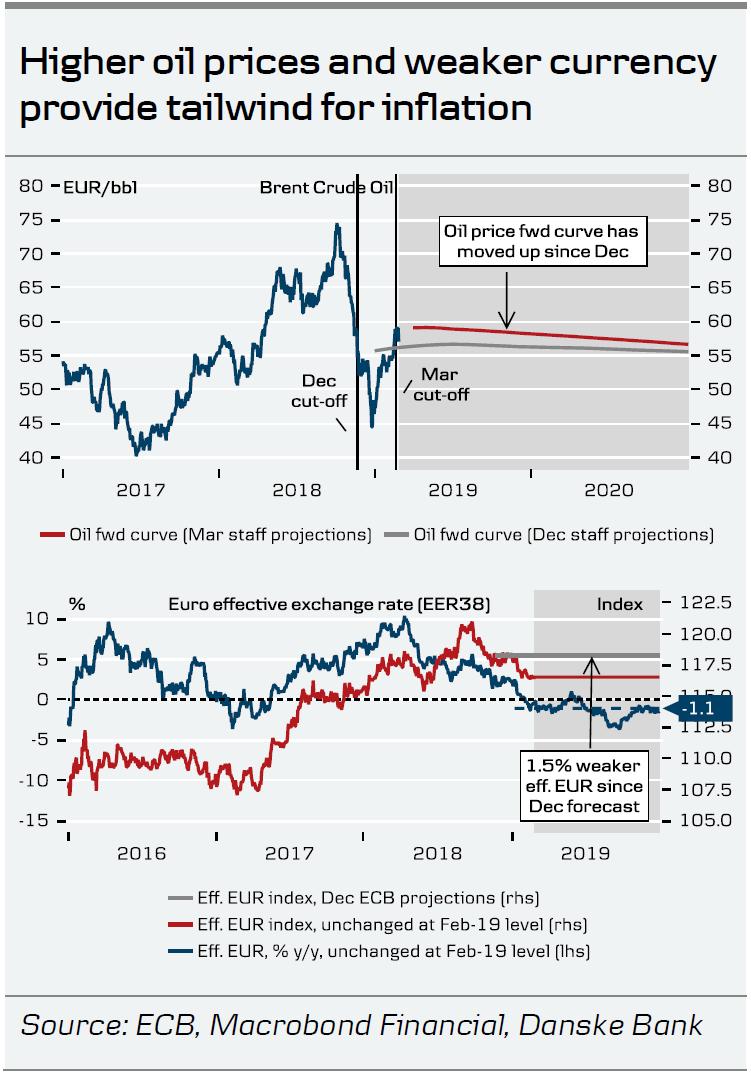
Technical assumptions of higher oil prices and a weaker effective euro should on balance lift the ECB's inflation profile. However, we expect this to be countered by the weaker growth outlook and slower wage pass-through, resulting in a lower profile for core inflation. From tradition, we still look for the forecasts to show HICP inflation 'close but below 2%' over the medium term.
FX: waiting for a shift in rate guidance – but too early still
In short, the main thing the FX market is waiting for from the ECB is for it to revisit its forward guidance on rates and, as this is unlikely to be changed this month, we think it remains too early for the ECB to drive significant EUR strength. If we are right that no liquidity injection will be announced in March, the knee-jerk reaction could be some limited EUR support though, as this would at first sight be seen as a hawkish signal. It is worth noting that even if the ECB goes for TLTRO – now or later in the year – to the extent that this paves the way for an earlier move on the deposit rate, everything else being equal, it could be a EUR positive signal. We reiterate that the sheer shift that is evolving with the ECB looking to exit 'emergency measures' (and get back to zero) and the Fed becoming more patient (i.e. hesitant to hike) a firm floor has been established for EUR/USD. We see the cross in a range around 1.15 near term and stress that a shift in ECB rate guidance brewing mid-year, provided the global cycle stabilises, is a key trigger for a shift into the 1.20s.
Fixed income
Given our baseline of an unchanged narrative from the ECB, the curve is likely to stay flat or even flatten more, as the 10Y segment still offers the best carry relative to the risk. Hence, we believe the curve is still too steep. There has been some speculation about the ECB not wanting to continue to 'feed' expectations for a dovish monetary policy, which would lead to a sharp reversal in rates. However, we believe the ECB is very conscious of the market reaction (and potential increase in volatility), which would be an unwarranted response for the ECB.
Therefore, we expect the 'hunt for yield' to continue with more spread compression. Recently, the very strong 'hunt for yield' has materialised in strong demand in the peripheral government bond markets, as well as in EU credit markets and EU covered bond markets. The syndicated deals from the start of the year have seen a solid performance and there has been a significant oversubscription to the deals. Hence, the fear that, for example, Italy would not be able to sell bonds after the ECB had ended QE has not materialised. The star performer this year has been Portugal, where spreads to core EU and the other peripheral countries have tightened significantly.
Furthermore, the political uncertainty from the upcoming Spanish election has had no limited on the Spanish government bonds, which have performed against core EU and one of our top trades for 2019 – long 5Y Spain versus 5Y France – has almost reached its target for a profit of 25bp.
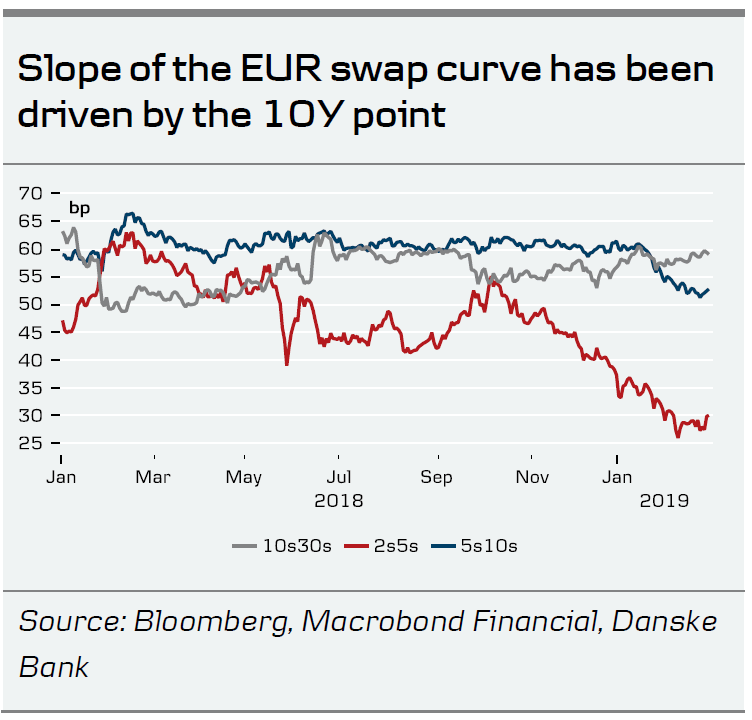
The market has clearly 'priced out' rate hikes from the ECB as shown by the flattening of the 2Y-5Y curve, while the 5Y-10Y has lagged the movement in the 2-5Y slope. The German curve has flattened markedly in recent months.