Sample Category Title
EURUSD Intraday Bearish Bias
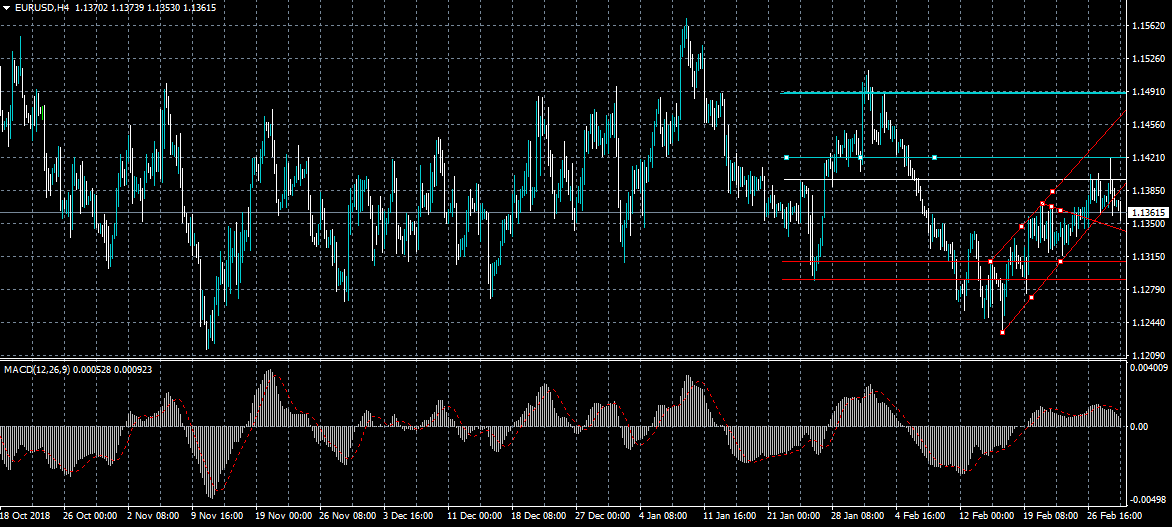
The euro is trading lower against the US dollar currency on Friday, as the greenback receives strong buying interest across the board. The EURUSD pair was strongly rejected from the 1.1420 level on Thursday and holds an intraday bearish bias while trading below the 1.1380 level. The 1.1340 level offers the strongest form of near-term technical support if the decline continues.
The EURUSD pair is intraday bearish while trading below the 1.1380 level, key support is found at the 1.1340 and 1.1300 levels.
If the EURUSD pair trades above the 1.1380 level, key technical resistance is found at the 1.1420 and 1.1460 levels.
Chinese Market Rushed Up, But The Technical Analysis Calls For Caution
China stocks cheers MSCI's increasing weight of national companies, but technical analysis for China A50 and SPX points to potential exhausting of the rally
China on the rise
The Chinese market's correction quickly ended with news that MSCI increasing weight of national companies. After the release of this news, key Chinese indices add more than 2%: speculators seek to outpace the funds which will increase their share in Chinese companies in accordance with their policy of following the MSCI benchmark indexes.
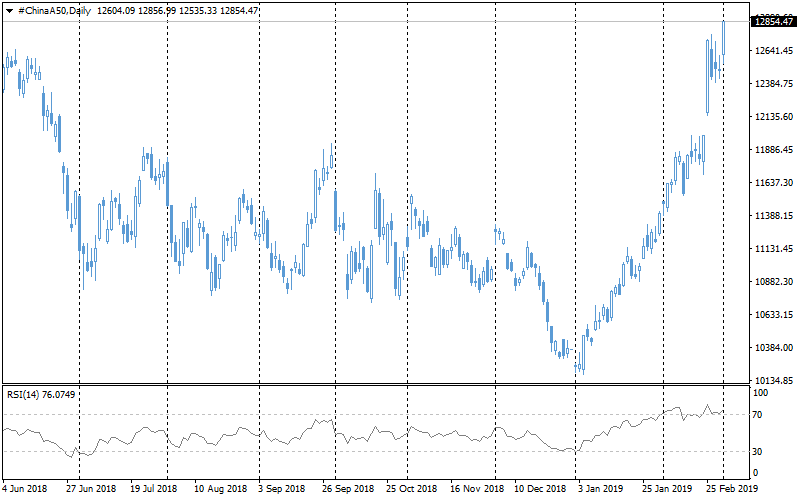
The China A50 Blue Chip Index jumped nearly 3%, abruptly ending the correction and refreshing the highs since April last year. Such a strong impetus may be the reason for further inertia strengthening during the next few trading sessions. But nevertheless, a more rational strategy is not to succumb to a short-term surge, otherwise, it is possible to fall into the category of buyers at the end of growth.
But not too strong potential right now
On daily charts, the RSI remains above the 70 for China A50, remaining in the overbought area, which creates the threat of a quick correction.
Fresh business activity estimates were quite controversial. Financial markets have traditionally paid more attention to the manufacturing sector. The official PMI estimates were, in this case, the lowest in 3 years, dropping into the territory of the recession. The services index did not meet the forecasts but remains in the expansion territory.
Surprisingly, against this background, Markit's published estimates came out noticeably better than expectations, reinforcing the markets positive tone on Friday.
SPX one more time near important resistance
Moderately positive statistics came out in the United States. As a result of higher-than-expected growth estimates in the fourth quarter, the demand for the dollar and American stocks increased. The S&P 500 returned to the mark near the important resistance at 2800. At the end of the week, its dynamics had a significant impact.
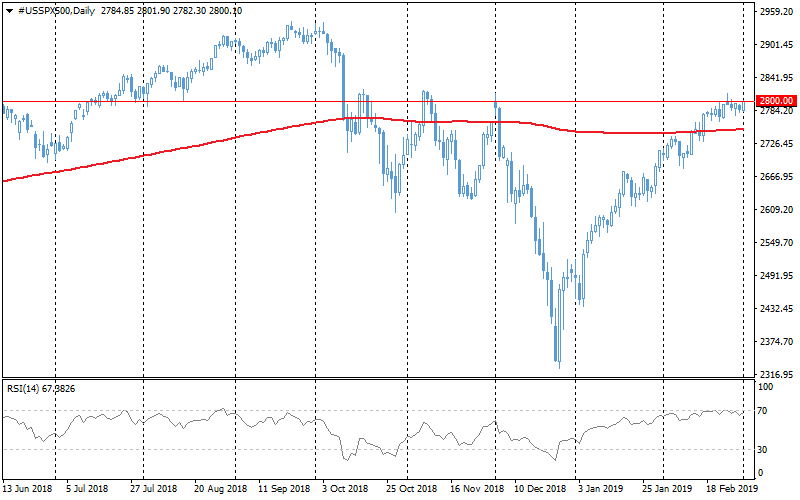
Solid growth above this level may be a reason for further strengthening of optimistic sentiments on the global financial markets. However, the more likely option, in this case, seems to be increasing the investor's caution. As we wrote earlier, the technical analysis notes the extinction of growth momentum, and with a neutral external background, it can become a determining factor for markets, once again causing a wave of profit taking at the end of the week.
EUR/USD – Euro Unchanged As Eurozone Inflation, Manufacturing Data As Expected
EUR/USD is almost unchanged in the Friday session, continuing the lack of movement seen on Thursday. Currently, the pair is trading at 1.1376, up 0.05% on the day. There are a host of events on both sides of the pond, so the pair could show stronger activity in the North American session. German retail sales jumped 3.3%, but manufacturing PMI fell to 47.6, matching the forecast. Eurozone CPI Flash Estimate came in at 1.5%, matching the estimate. Core CPI Flash Estimate gained 1.0%, just shy of the forecast of 1.1%. In the U.S., the focus will be on consumer data, highlighted by the Core PCE Price Index and personal spending.
German numbers were a mix on Friday. Retail sales bounced back with a 3.3% gain in January, after a 4.3% decline in December. The manufacturing sector continues to struggle, as Manufacturing PMI fell below the 50-level for a second straight month, pointing to contraction. German and eurozone manufacturing has fallen off due to the global trade war, which has led to less demand for eurozone and German products. On the labor front, unemployment rolls fell by 21 thousand, crushing the estimate of -5 thousand. There was more good news as the eurozone unemployment rate dropped to 7.8% in January, down from 7.9% a month earlier.
The ECB has finally terminated its massive stimulus program, but any speculation that the bank will raise rates in the near term appears remote. The ECB has held rates at a flat 0.00% since March 2016, and there are two main factors weighing on a rate hike. First, the eurozone economy is grappling with a slowdown, and the German locomotive has also posted sluggish numbers. As well, inflation levels remain well shy of the ECB target of 2 percent. Unless the economic conditions show a sharp improvement, we may not see a rate hike before 2020.
The U.S. received a GDP report card on Thursday, and the results were good. Advance GDP, which was released a month late due to the government slowdown, showed a gain of 2.6% in Q4. Although this was weaker than the 3.4% gain in Q3, it was well above the estimate of 2.2%. The unexpectedly solid reading can be credited to strong consumer spending and business investment. It’s hard to argue that the U.S. economy is not performing well, with a strong expansion of 3.1% in 2018. Even with the GDP release, it’s unlikely that the Federal Reserve will veer from it dovish stance.
Demand For The US Currency Has Resumed
Yesterday, the US dollar strengthened against major currencies. Demand for the US currency increased after the release of optimistic statistics on the US GDP. According to preliminary data, the growth of the country's economy in the fourth quarter of 2018 counted to 2.6% year on year, which was higher than experts' expectations at the level of 2.3%. Additional support for the greenback is provided by an increase in the 10-year US government bonds yield. Today, the US dollar is testing a 10-week high against the Japanese yen. The dollar index (#DX) is tending to grow.
The political uncertainty concerning Brexit remains. At the moment, the GBP/USD quotes have become stable. Investors began to partially fix positions after significant growth over the past two weeks. Financial market participants are waiting for up-to-date information regarding trade negotiations between the US and China. Today, we expect the publication of important economic reports from the Eurozone, the US, and Canada.
The "black gold" prices have recovered all losses after a sharp collapse at the beginning of this week. At the moment, futures for the WTI crude oil are testing the mark of $57.65 per barrel. We recommend paying attention to data on drilling activity in the US at 20:00 (GMT+2:00).
Market Indicators
- Yesterday, the major US stock indices closed in the negative zone: #SPY (-0.19%), #DIA (-0.23%), #QQQ (-0.23%).
- The 10-year US government bonds yield shows positive dynamics. At the moment, the indicator is at the level of 2.72-2.73%.
The news feed on 01.03.2019:
- German manufacturing PMI at 10:55 (GMT+2:00);
- Report on the labor market in Germany at 10:55 (GMT+2:00);
- Eurozone consumer price index at 12:00 (GMT+2:00);
- Canada GDP at 15:30 (GMT+2:00);
- ISM manufacturing PMI at 17:00 (GMT+2:00).
The Analytical Overview Of The Main Currency Pairs
The EUR/USD currency pair
Technical indicators of the currency pair:
Prev Open: 1.13694
Open: 1.13703
% chg. over the last day: +0.04
Day's range: 1.13553 – 1.13752
52 wk range: 1.1214 – 1.2557
EUR retreated from the local maximums. The EUR/USD quotes are consolidating around 1.13500 and 1.13800. The demand for the USD returned after the positive GDP report. According to preliminary data, the US economy grew by 2.6% (y\y) which is above the market expectations of 2.3%. The USD is additionally supported by the growth of the US Treasury bonds. The investors are waiting for reports on the US\Beijing negotiations. Right now EUR\USD is in a bearish mood, you should open positions from the key levels.
The Economic News Feed for 28.02.2019:
Industrial PMI (GER) – 10:55 (GMT+2:00);
Labour Market Report (GER) – 10:55 (GMT+2:00);
Consumer Price Index (EU) – 12:00 (GMT+2:00);
ISM Business Activity Index (US) – 17:00 (GMT+2:00);
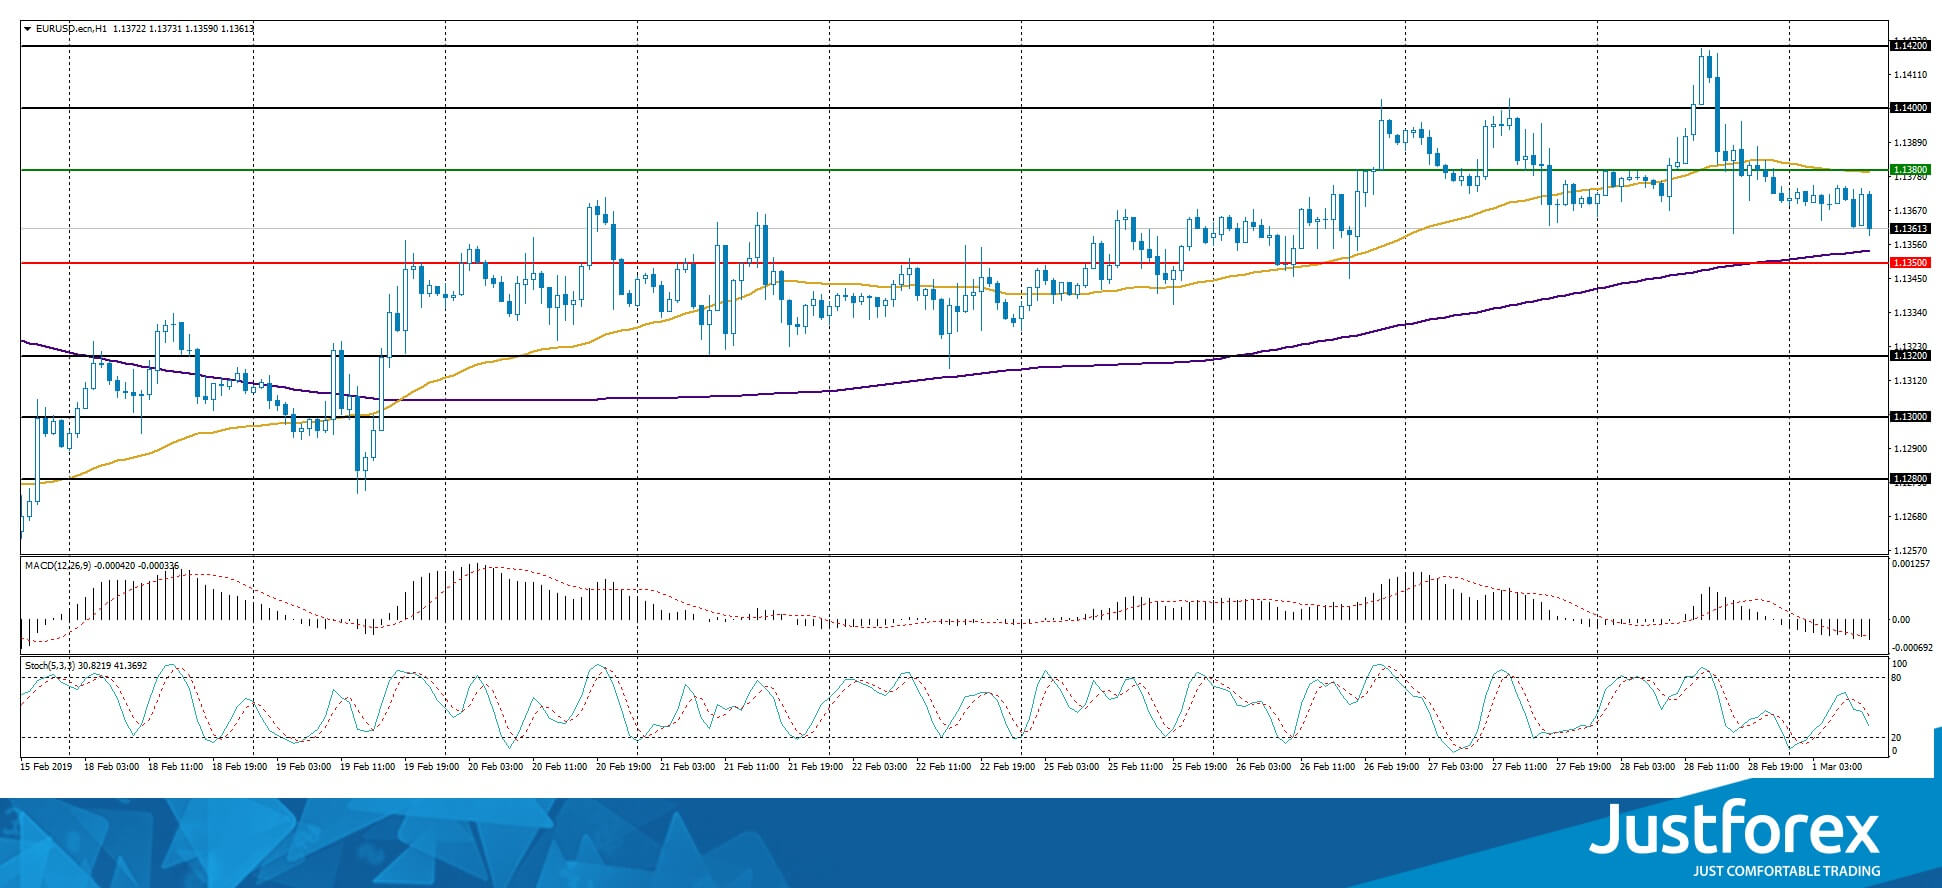
The indicators do not provide precise signals, the price is fixed between 50 MA and 200 MA.
The MACD histogram is in the negative zone and below the signal line, which points to the bearish mood.
The Stochastic Oscillator is in the neutral zone, the %K line is below %D line, which suggests you should sell EUR\USD.
Trading recommendations
Support levels: 1.13500, 1.13200, 1.13000
Resistance levels: 1.13800, 1.14000, 1.14200
If the price fixes below 1.13500, expect the quotes to fall toward 1.13200-1.13000.
Alternatively, the quotes can correct toward 1.14000-1.14200.
The GBP/USD currency pair
Technical indicators of the currency pair:
Prev Open: 1.33068
Open: 1.32614
% chg. over the last day: -0.35
Day's range: 1.32331 – 1.32662
52 wk range: 1.2438 – 1.4378
GBP/USD retreated from the local maximums. The quotes have now stabilized and are consolidating around 1.32150 and 1.32750. The financial market participants are fixing the positions after the week-long rally. A technical correction is possible soon. You should open positions from these levels.
At 11:30 (GMT+2:00) the UK will publish the industrial PMI.
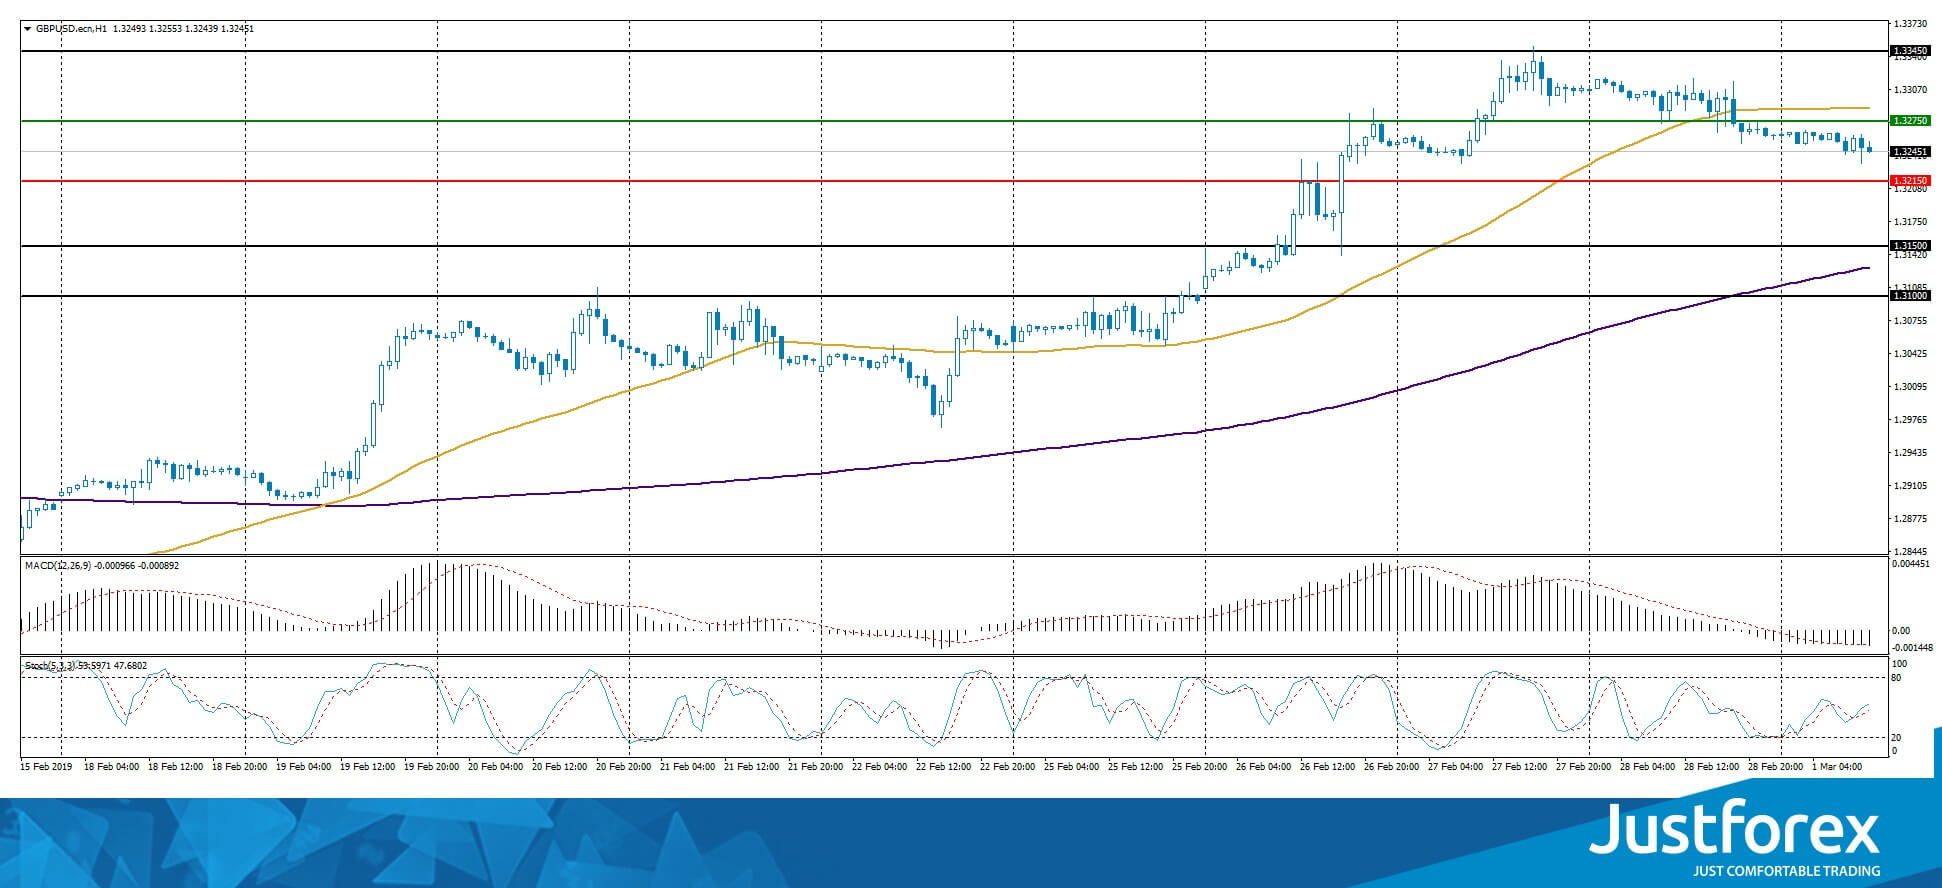
The indicators do not provide precise signals, the price fixed between 50 MA and 200 MA.
The MACD histogram is in the negative zone, and below the signal line, which gives a strong signal to sell GBP/USD.
The Stochastic Oscillator is in the neutral zone, the %K line is above the %D line, which points to the bullish mood.
Trading recommendations
Support levels: 1.32150, 1.31500, 1.31000
Resistance levels: 1.32750, 1.33450, 1.34000
If the price fixes below 1.32150, expect the quotes to grow toward 1.31600-1.31400.
Alternatively, the quotes can correct toward 1.33300-1.33500.
The USD/CAD currency pair
Technical indicators of the currency pair:
Prev Open: 1.31543
Open: 1.31690
% chg. over the last day: +0.04
Day's range: 1.31320 – 1.31757
52 wk range: 1.2248 – 1.3664
USD/CAD remains in a flat. There is no single defined trend. Right now the quotes are testing the demand zone of 1.31300-1.31150, with the resistance fixing at 1.31700. The quotes can descend further due to positive oil quotes dynamics. The investors are waiting for important reports from Canada. You should open positions from the key levels.
At 15:30 (GMT+2:00) Canada will publish a GDP report.
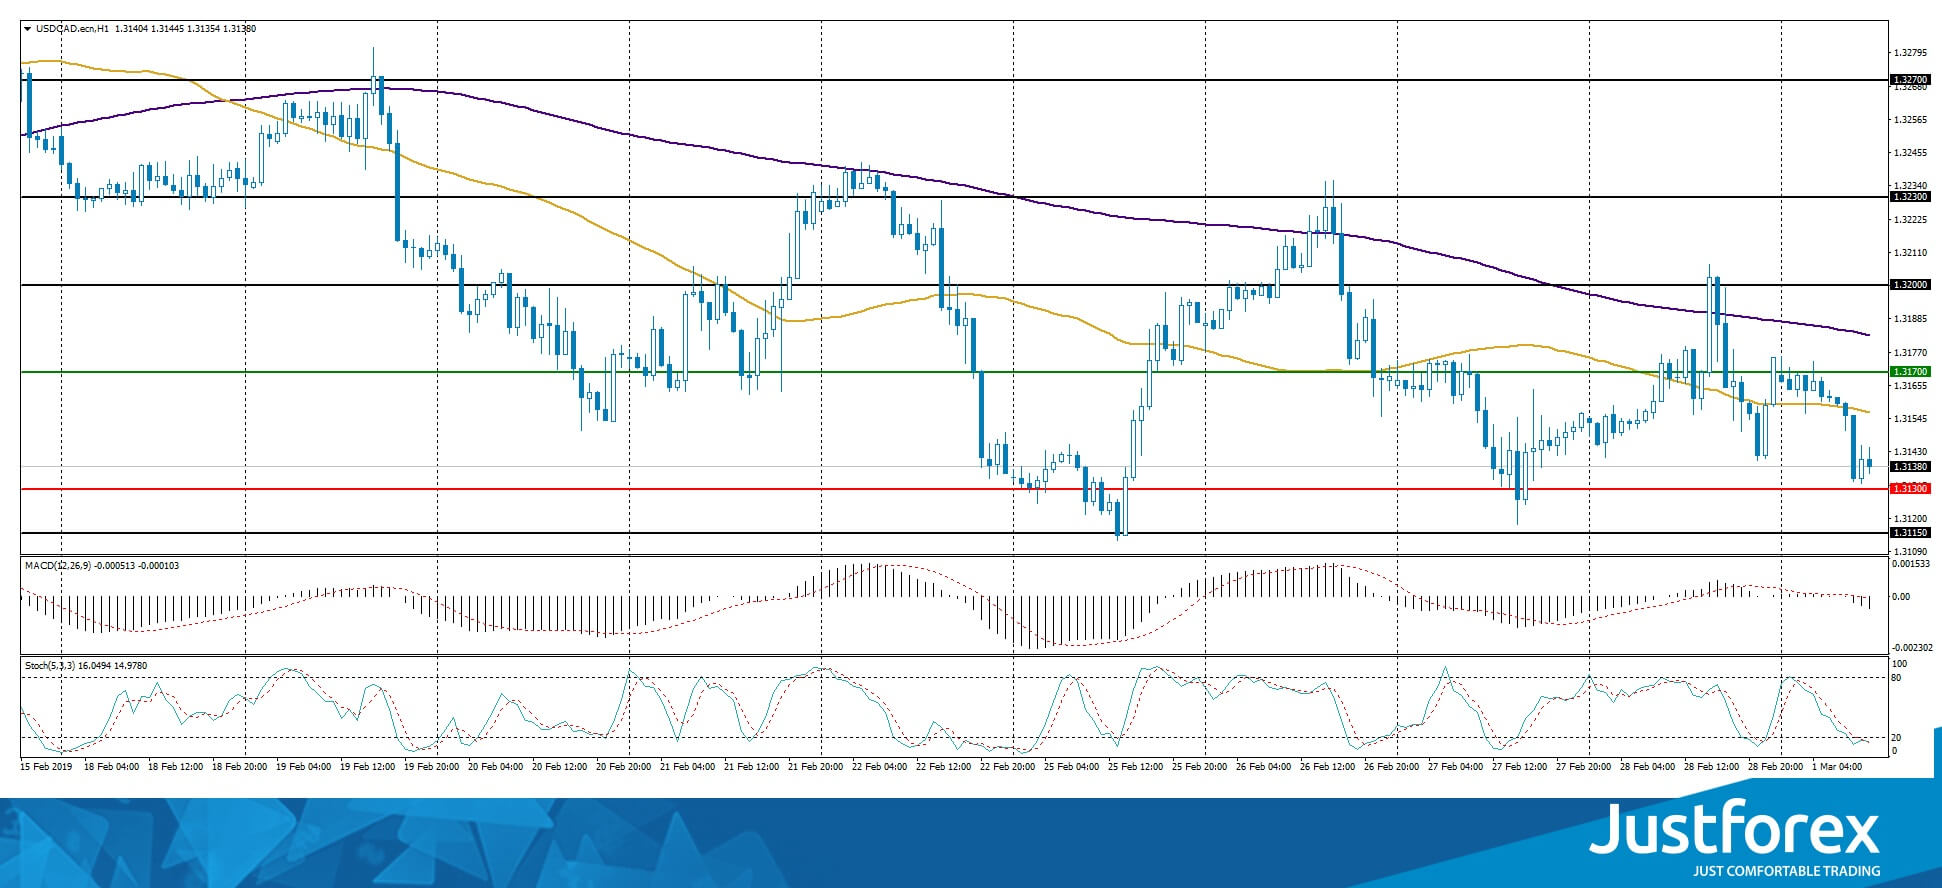
The price fixed below 50 MA and 200 MA which points to the power of the buyers.
The MACD histogram is in the negative zone, which gives a signal to sell USD/CAD.
The Stochastic Oscillator is in the oversold zone, the %K line is crossing the %D line. There are no signals at the moment.
Trading recommendations
Support levels: 1.31300, 1.31150, 1.30850
Resistance levels: 1.31700, 1.32000, 1.32300
If the price fixes below 1.31300, expect the quotes to fall toward 1.31000-1.30850.
Alternatively, the quotes can grow toward 1.32000.
The USD/JPY currency pair
Technical indicators of the currency pair:
Prev Open: 110.984
Open: 111.375
% chg. over the last day: +0.33
Day's range: 111.324 – 111.983
52 wk range: 104.56 – 114.56
USD\JPY is in an aggressive buyout. During the last two days of trading, yen weakened against the USD by more than 100 points and the quotes updated te 10-month maximums. The demand on USD grew after the positive GDP report, as well as the growth of the US Treasury bonds. Right now the key range is 111.650-112.000. You should open positions from these levels.
The News Feed on Japan is calm.
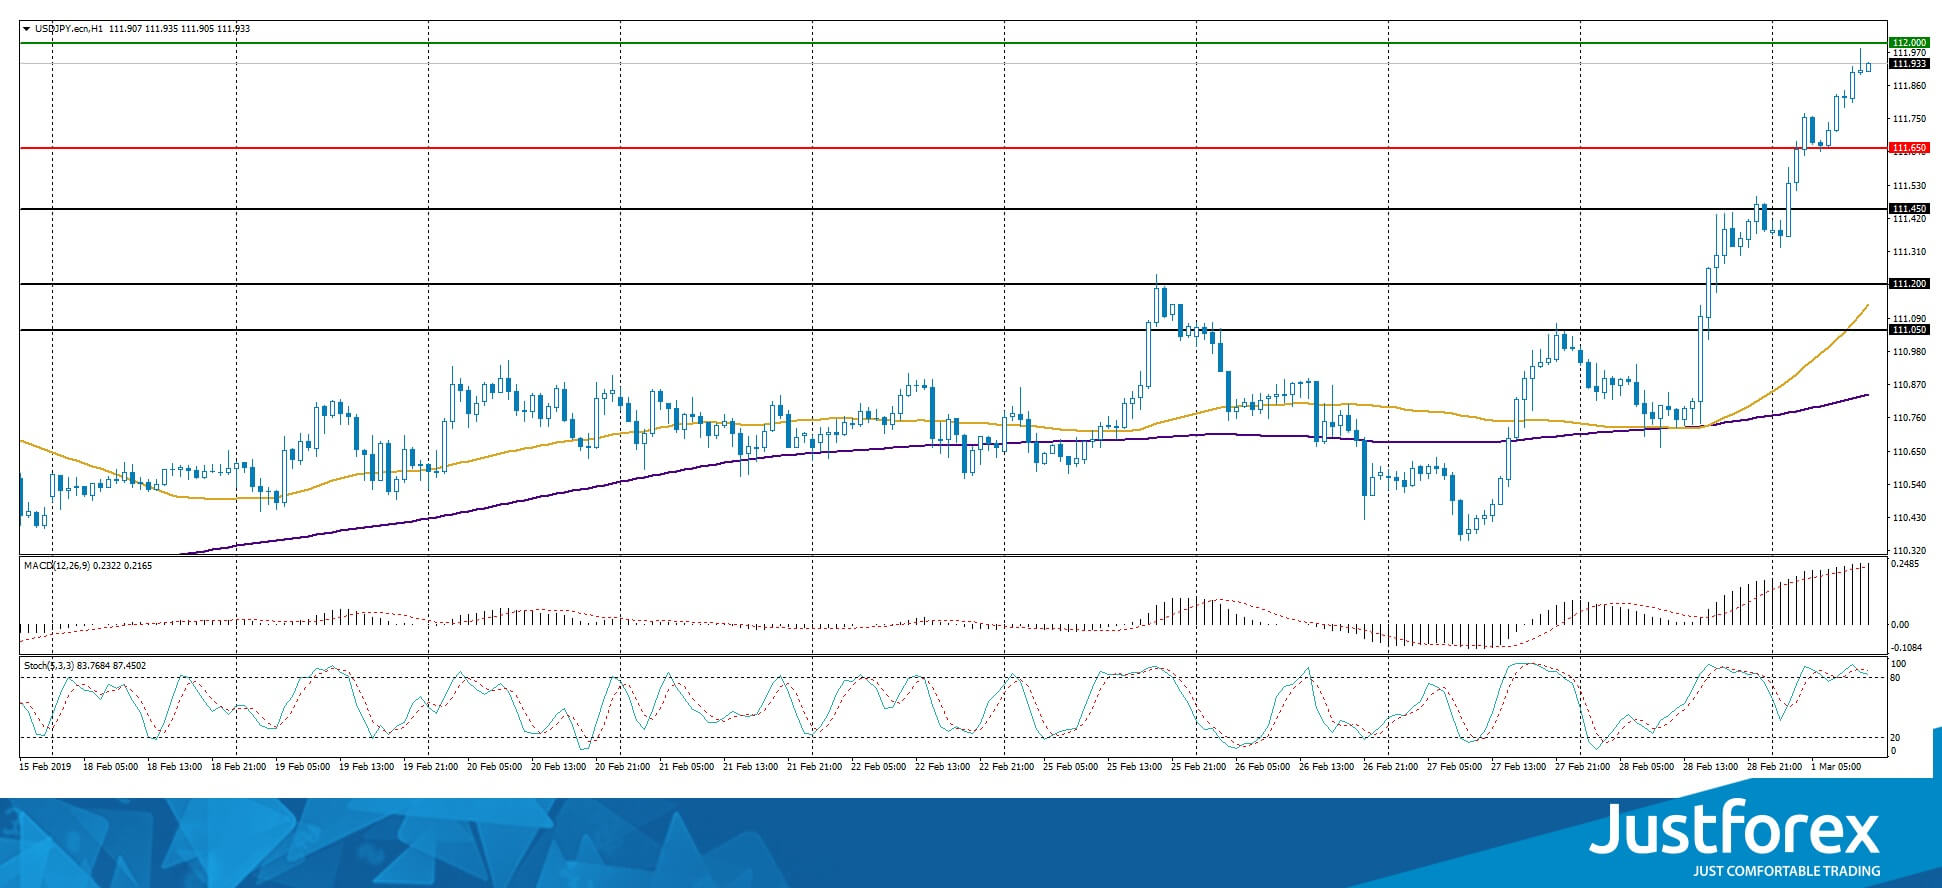
The price fixed above 50 MA and 200 MA which points to the power of the buyers.
The MACD histogram is in the positive zone but above the signal line, which gives a weak signal to buy USD/JPY.
The Stochastic Oscillator is in the overbought zone, the %K line is crossing the %D line, which does not provide any signals.
Trading recommendations
Support levels: 111.650, 111.450, 111.200
Resistance levels: 112.000, 112.500
If the price fixes below 112.000, expect the quotes to grow toward 112.400-112.600.
Alternatively, the quotes can correct toward 111.500-111.300.
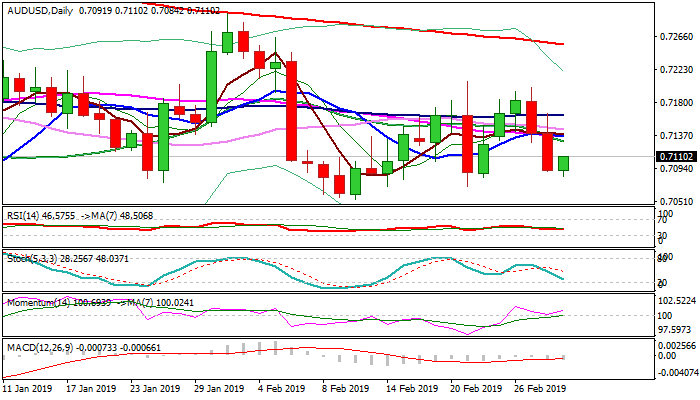
AUD/USD Outlook: Better Than Expected China’s Data Sidelined Bears But Risk Of Further Weakness Exists
The Australian dollar ticks higher on Friday, as traders booked profits from strong fall of past two days.
Better than expected China's Manufacturing data (Feb Manufacturing PMI 49.9 vs 48.5 f/c and 48.3 in Jan) sidelined bears, but recovery attempts are still limited.
Daily studies are overall bearish, but strengthening momentum partially offsets negative tone and keeps the price above key supports at 0.7070/54, violation of which would spark stronger acceleration lower.
A cluster of daily MA's between 0.7129 and 0.7163 marks strong barrier and only sustained break higher would neutralize bearish existing bearish threats.
Res: 0.7129, 0.7145, 0.7163, 0.7203
Sup: 0.7084, 0.7070, 0.7054, 0.7000
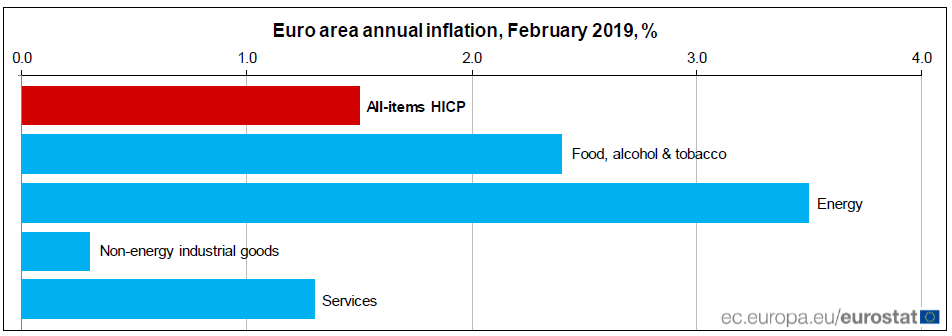
Eurozone core CPI slowed to 1.0%, unemployment unchanged at 7.8%.
Eurozone CPI accelerated back to 1.5% in February, up from 1.4% yoy, matched expectations. CPI core, however, slowed to 1.0% yoy, missed expectation of 1.1% yoy.
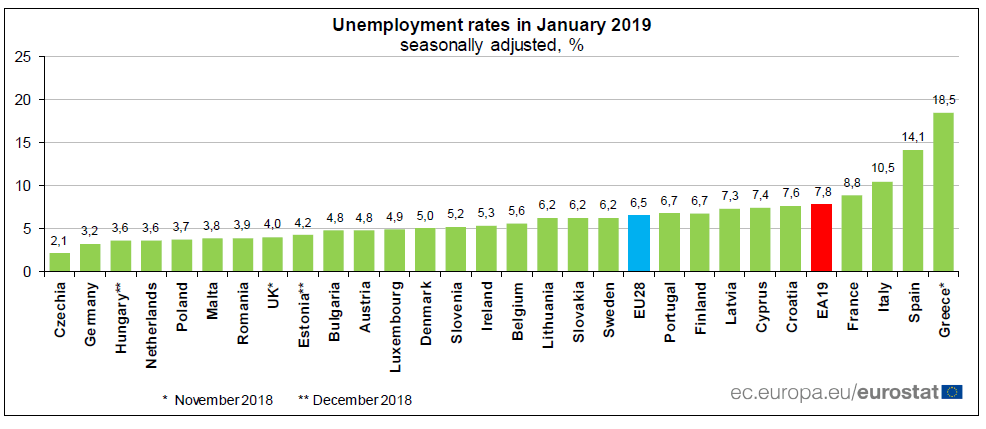
Eurozone unemployment rate was unchanged at 7.8%, beat expectation of 7.9%. That's the lowest level since October 2008. For EU 28, unemployment also dropped to 6.5%, down from 6.6%, lowest since record started in January 2000.
Japanese Economy Decelerates
The Bank of Japan says that inflation is accelerating and does not need expansive monetary policy, but the economy is expected to weaken further. GDP growth was 0% for 2018, including a contraction of -2.60% in Q3. Momentum is fading: the manufacturing PMI fell for the first time in 2.5 years. The decline comes from weaker sales to China amid continued trade frictions and weaker domestic manufacturing demand. In the event of an agreement between the US and China, the economy might be facing difficulties, as China’s pledge to buy semiconductors from the US could hurt the third largest electronic product industry in the world. No changes in Japan’s labour market, with January’s jobless rate at 2.50% (prior: 2.40%) and still its lowest range in 26 years. With the prospect of a US-China trade deal as early as mid-March, safe haven JPY is less in demand. We expect a rebound of USD/JPY from late February’s low (110.59) to sustain in the coming weeks.
Currently trading at 111.98, USD/JPY is heading along 112.20 short-term
Asian shares bounce
Asian stocks were higher across the board today as the MSC Index said it would increase weightings of Chinese mainland shares in its EM index, which is followed by over USD 2 trillion of assets. This is a meaningful shift: EM stocks and FX responds to flows. Of course this reallocation will not occur all at once; that would overwhelm investors and disrupt normal market behaviours. Saudi Arabia and Argentina will enter the index with a total of 2.9% weight, but the big new is China A-Share weight will climb 5x to over 3%.
Oil Correction On The Cards?
Markets buoyed on final day of the week
We're on course for a more positive end to the week in otherwise quiet trade, with US futures around half a percentage point higher, mirroring gains currently being seen across Europe.
I don't think there's been any particular catalyst for the rally on the final day of the week. It's been quite a mixed week in general with political stories dominating the headlines, which haven't really steered markets in process. The US GDP data on Thursday was encouraging, although we saw it have limited positive impact on indices on Thursday so there's no reason to think that's offering support now. We'll get another batch of data today which will be closely followed, including inflation, income, spending and PMIs. Perhaps they can provide us some good news to take into the weekend.
Oil correction on the cards?
The rally in oil is continuing to stall, with recent price action having been positive while at the same time not inspiring confidence in its ability to continue. Momentum is fading following a more than 30% rally from the lows near the end of the year. This is hardly surprising and while the break through notable technical resistance a couple of weeks ago could be a bullish signal medium-term, a patient approach could be warranted.
Should we see a correction in oil then technical support may come into play around $59.50-60.50 area in Brent and $50.50-51.50 in WTI. The longer term picture still looks bullish for oil, although record US output and a foggy global economic output is a clear headwind which could slow the price rise.
Gold looking vulnerable as US GDP inspires latest sell-off
The US dollar was given a bump on Thursday, as fourth quarter GDP data showed the economy expanded faster than expected, albeit while falling slightly short on an annualised basis of Trump's 3% target. The figure comes as countries elsewhere have struggled to expand, just look at Europe where some countries are either on the cusp of, or in fact in, recession. The beat on the data was the catalyst for a rise in the dollar which in turn weighed on gold and took it below $1,320, a level that had been well supported.
Gold continues to look vulnerable in the near-term having been on a good run for a number of weeks. Rally's in the dollar are taking their toll on gold much more than they were a few weeks ago which is a clear sign that sentiment towards the yellow metal has shifted. The next test below is $1,300, a break of which could be the catalyst for another bearish move, at which point $1,275-1,280 becomes notable support
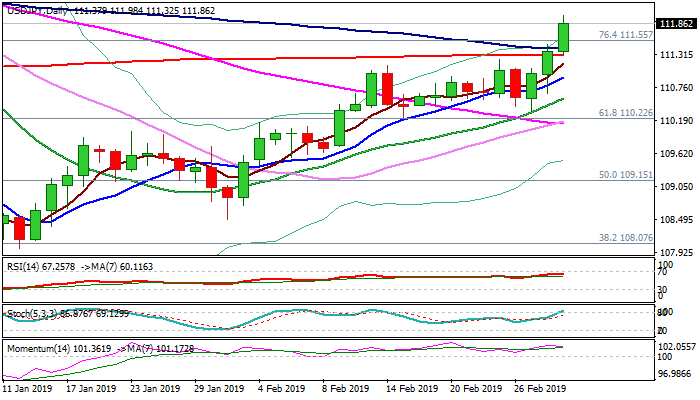
USD/JPY Outlook: Final Break Above 200SMA Inflated Bulls For Test Of Next Key Barriers At 112.20/35
The pair maintains strong bullish tone and extends rally to psychological 112 barrier on Friday, after upbeat US GDP data on Thursday boosted the dollar.
Eventual break and close above pivotal 200MA barrier (the pair last traded above it in late Dec) was strong bullish signal, which requires confirmation on weekly close above 200SMA.
Bulls eye next key barriers at 112.20/35 (Fibo 76.4% of 114.54/104.59 descend / 200WMA), violation of which would expose 114 zone.
Bullish daily techs support scenario, but overbought conditions warn that rally may run out of steam on approach to 112.20/35 pivots.
Broken 200SMA now marks solid support which is expected to hold dips and keep bulls in play.
Res: 112.00,112.20,112.35,112.66
Sup: 111.55,111.41,111.31,110.92