Sample Category Title
Chinese & German Economic Numbers Came Strong
European markets are trading higher thanks to the German retail sales data which came well ahead of the consensus forecast of 1.9 percent. Today’s number printed the reading of 3.3 percent, a lot more stronger number versus the previous reading of -3.1%. This shows that German consumers have started to feel more relaxed. This improvement in retail sales data may also have spillover effects in the upcoming week’s economic numbers as well.
US futures are trading higher as traders are positive about the upbeat economic data out of China. It seems like the flow of good news has amplified, this is uplifting the confidence among traders. The Chinese CAXIN PMI, a private gauge of manufacturing, came well ahead of the forecast. The survey predicted that the number could be at 48.5, but the actual number came in at 49.9, beating the previous reading of 48.3. The reading of 50 differentiate between expansion and contraction and the 49.9 is still below the expansion line, but investors are pleased to see improvement in this number. A lot of this is due to the ongoing optimism about the trade war negotiations between the US and China. The deal could be around the corner, both parties are in the final steps of finalizing them; in fact, they are exploring the dates for the joint summit. This really shows that some tremendous progress has been made. Finally, the saga of trade war may come to end and hopefully, no one will ever touch it again. The IMF already has wanted that the trade war is going to leave some scars on both countries; however, given that the deal is within sight, I believe that these scars will soon be cured.
Once again, Wall Street is ready to kick to start the new month on the front foot. We have two consecutive months of gain for the S&P500 and year-to-date the index is up 11.08 percent. Similarly, the Dow Jones index has closed in positive territory for the past two months and it has jumped 11.10 percent YTD. The NASDAQ index soared 13.52 percent year-to-date.
Fed chairman, Jerome Powell, maintained his stance in his latest testimony; the Fed is likely to remain patient with respect to their monetary policy. His message was simple and clear: there are too many crosscurrents and conflicting signals, and the Fed needs to asses them carefully. This is because there are external factors such as the slowdown in the global economy. Basically, the overall statement was somewhat dovish. However, traders are still not buying this and this is the reason that we are still seeing some strength in the dollar index. This is also due to the strong US GDP number, it was much stronger than the expectations and this took the market by surprise.
The strength in the US GDP number removed the wind out of the gold rally and the yellow metal could be targeting the psychological support level of $1300. Traders will be observing this level very sensibly and if we close below the 1300 mark this week, it would send a bearish signal. The monthly chart for gold shows that we have two consecutive months of losses and this raises the question if the bull has run out of steam. It appears that the price is really struggling to break the resistance of 1350 and the rally which started back in October 2018 needs some strong catalyst to break the resistance of 1350.
EUR/GBP Daily Outlook
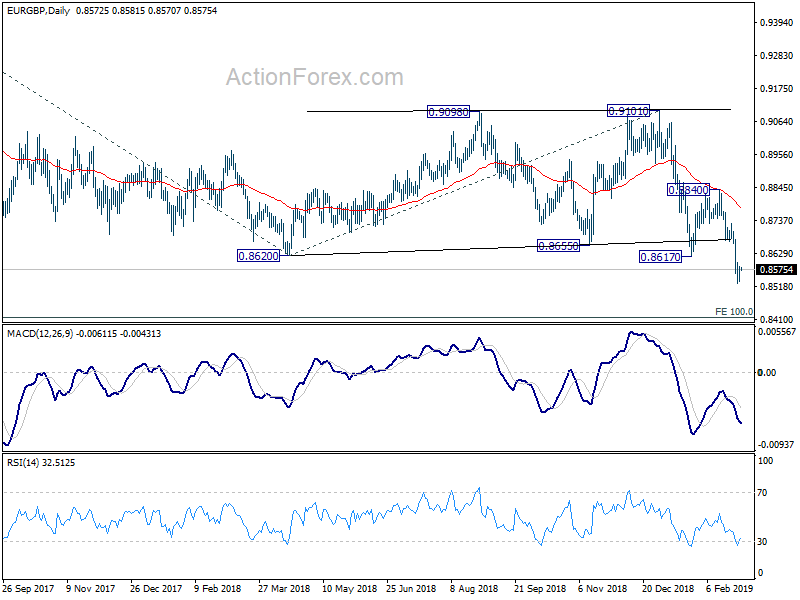
Daily Pivots: (S1) 0.8547; (P) 0.8567; (R1) 0.8594; More...
A temporary low is in place at 0.8529 in EUR/GBP with current recovery. Intraday bias is turned neutral first. Upside of recovery should be limited below 0.8840 resistance to bring another decline. On the downside, break of 0.8529 will resume the fall from 0.9101 and target long term projection target at 0.8416 next.
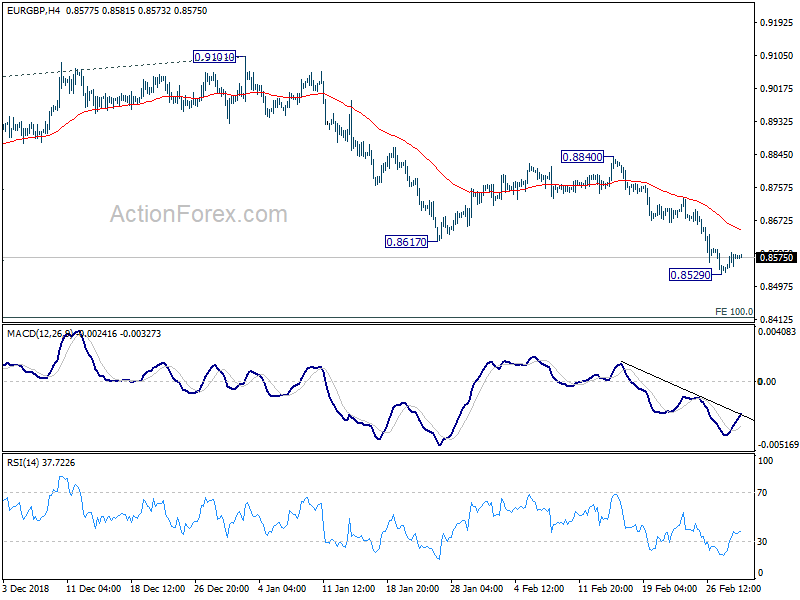
In the bigger picture, EUR/GBP is seen as staying in long term range pattern started at 0.9304 (2016 high). On the downside, decisive break of 0.8620 support resumed the falling leg from 0.9305 (2017 high). Next target is 100% projection of 0.9305 to 0.8620 from 0.9101 at 0.8416. In this case, we'd expect strong support around 0.8312 to contain downside and bring rebound.
EUR/AUD Daily Outlook
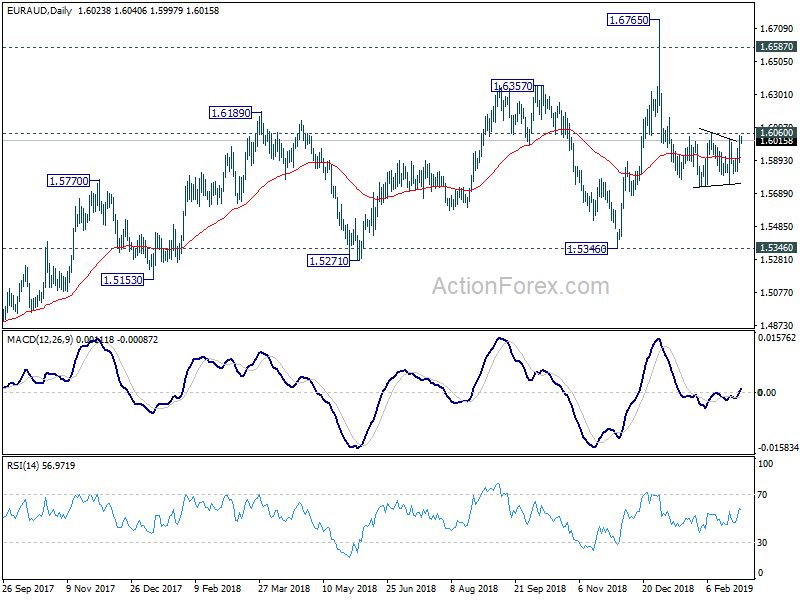
Daily Pivots: (S1) 1.5924; (P) 1.5985; (R1) 1.6092; More....
EUR/AUD rises further but stays below 1.6060 resistance at this point. Intraday bias remains neutral first. On the upside, decisive break of 1.6060 resistance should confirm that decline from 1.6765 has completed. Further rally should then be seen to retest 1.6765 high. On the downside, however, break of 1.5721 will extend the decline to 1.5346 support instead.
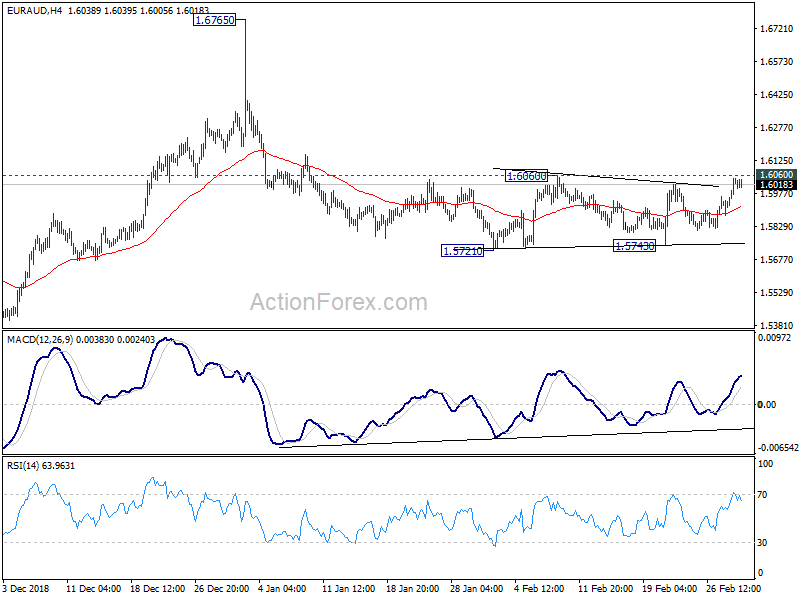
In the bigger picture, as long as 1.5346 support holds, outlook will remain bullish. Uptrend from 1.1602 (2012 low) is expected to resume sooner or later. Break of 1.6765 will target 61.8% retracement of 2.1127 (2008 high) to 1.1602 at 1.7488 next. However, firm break of 1.5346 key support will indicate trend reversal, with bearish divergence condition in weekly MACD, and turn outlook bearish.
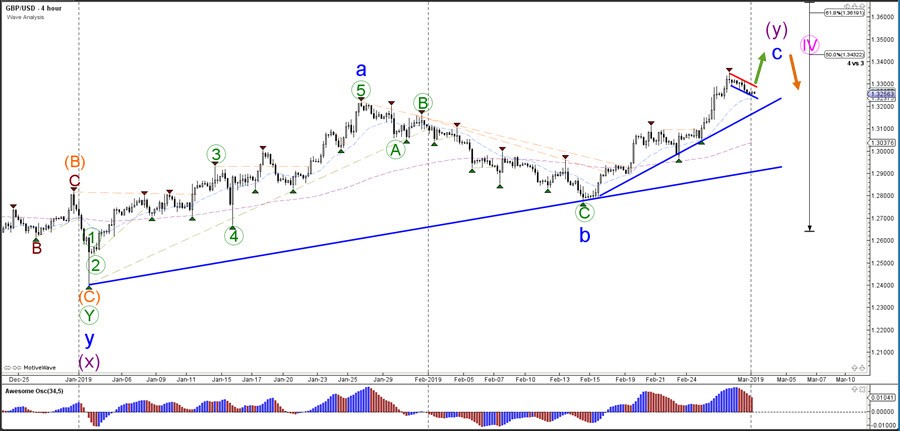
GBP/USD Bull Flag Pattern In Wave 4 Pullback
A GBP/USD bullish breakout and bounce at the 50% Fib could complete the wave C (blue) of wave Y (purple) of wave 4 (pink). A bullish break above the 61.8% Fib, however, could indicate a different wave pattern than the expected wave 4 (pink) correction. A break below the support trend lines (blue) confirms the end of wave 4 (pink) and the start of a wave 5.
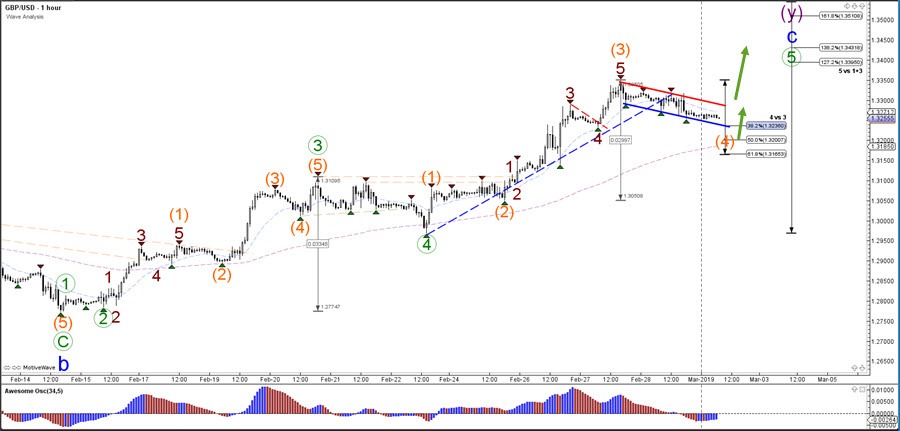
The GBP/USD bullish breakout above the resistance trend line (dotted red) confirmed a wave 5 (brown) of wave 3 (orange). Now price seems to be building a bull flag continuation chart pattern as price is moving lower slowly and choppily. A bullish bounce at the Fibonacci levels of wave 4 vs 3 (orange) and a break above the next trend line (red) could confirm the wave 4 (orange) retracement and the start of a 5th wave. A break below the 61.8% Fib indicates a different wave scenario.
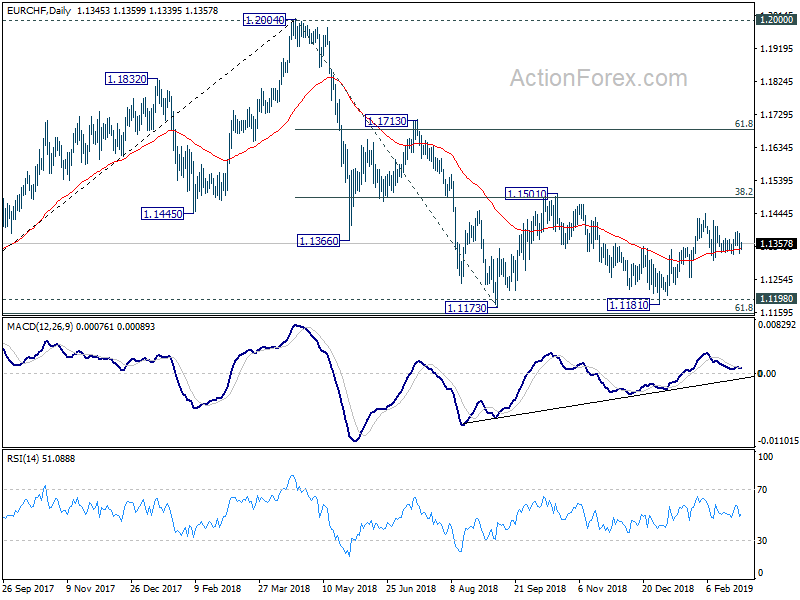
EUR/CHF Daily Outlook
Daily Pivots: (S1) 1.1321; (P) 1.1355; (R1) 1.1380; More...
EUR/CHF is staying in range of 1.1310/1444 and intraday bias remains neutral. As long as 1.1310 support holds, further rise is mildly in favor. On the upside, break of 1.1444 will resume the rebound from 1.1181 to 1.1501 key resistance next. Nevertheless, sustained break of 1.1310 will suggest that rebound from 1.1181 might be completed. Intraday bias will be turned back to the downside for 1.1181 low again.
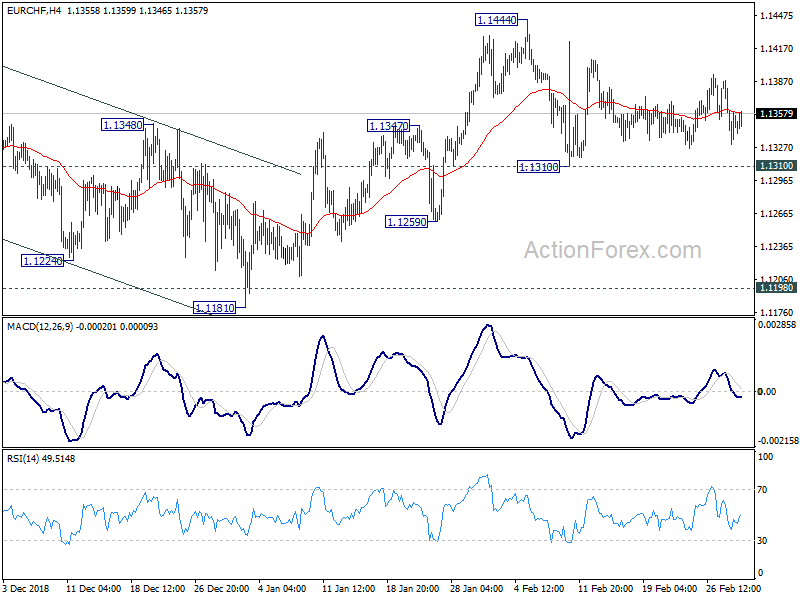
In the bigger picture, price actions from 1.2004 medium term top is seen as a correction only. Downside should be contained by 1.1154/98 support zone to complete it and bring rebound. Decisive break of 1.1501 (38.2% retracement of 1.2004 to 1.1173 at 1.1490) will confirm completion of the correction, on bullish convergence condition in daily MACD. Further rise should be seen to 61.8% retracement at 1.1687 and above next.
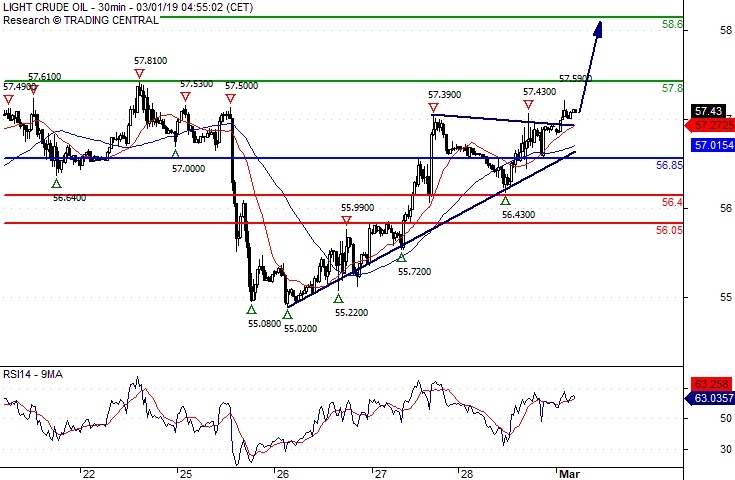
Crude Oil Further Upside
Pivot (invalidation): 56.85
Our preference Long positions above 56.85 with targets at 57.80 & 58.60 in extension.
Alternative scenario Below 56.85 look for further downside with 56.40 & 56.05 as targets.
Comment The RSI is bullish and calls for further advance.
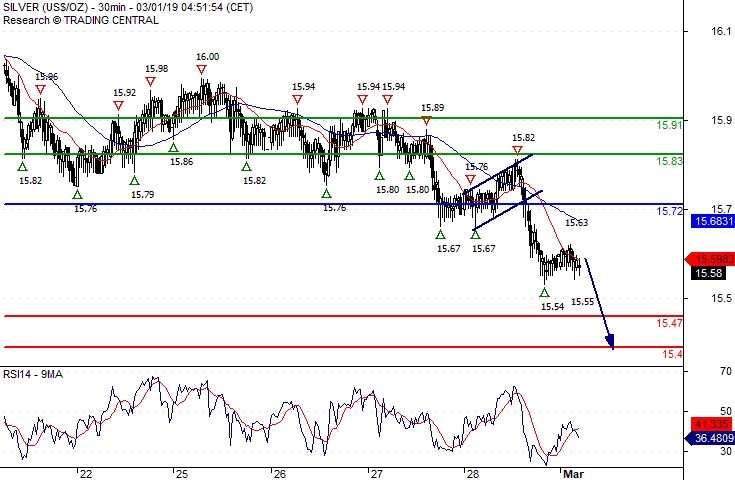
Silver Spot Under Pressure
Pivot (invalidation): 15.7200
Our preference Short positions below 15.7200 with targets at 15.4700 & 15.4000 in extension.
Alternative scenario Above 15.7200 look for further upside with 15.8300 & 15.9100 as targets.
Comment The RSI shows downside momentum.
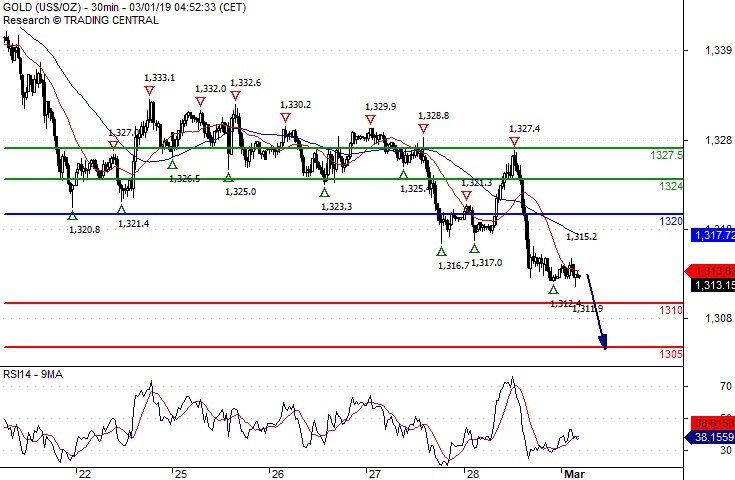
Gold Spot Under Pressure
Pivot (invalidation): 1320.00
Our preference Short positions below 1320.00 with targets at 1310.00 & 1305.00 in extension.
Alternative scenario Above 1320.00 look for further upside with 1324.00 & 1327.50 as targets.
Comment The RSI shows downside momentum.
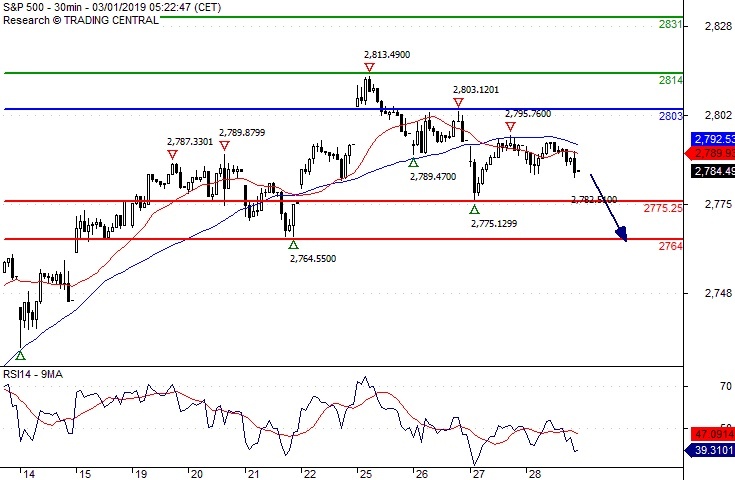
S&P 500 Key Resistance At 2803.00
Pivot (invalidation): 2803.00
Our preference Short positions below 2803.00 with targets at 2775.25 & 2764.00 in extension.
Alternative scenario Above 2803.00 look for further upside with 2814.00 & 2831.00 as targets.
Comment The RSI is bearish and calls for further decline.
DAX Continuation Of The Rebound
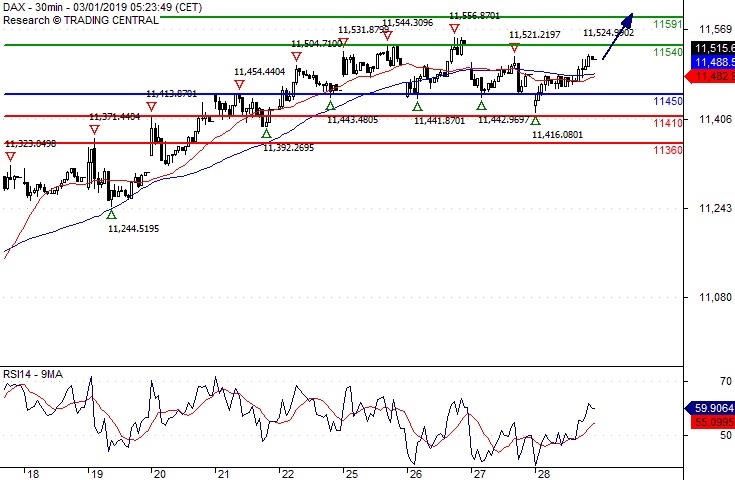
Pivot (invalidation): 11450.00
Our preference Long positions above 11450.00 with targets at 11540.00 & 11591.00 in extension.
Alternative scenario Below 11450.00 look for further downside with 11410.00 & 11360.00 as targets.
Comment The RSI is bullish and calls for further advance.