Sample Category Title
Trade Deal Coming Soon, Clearer Signs Of Growth Bottom
- A trade deal could be signed as soon as this month at the Xi Jinping-Donald Trump meeting in Florida. '
- Clearer signs of a growth bottom are emerging.
- Chinese stocks are powering ahead, rising weight in MSCI adds support.
Trade deal could be signed in Florida as early as this month
The US and China are moving into the last innings of the trade talks and so far signals continue to be mostly positive. A ‘signing meeting' between Xi and Trump is being planned and the latest indication is that it could come at the end of this month. SCMP wrote that Beijing has accepted Trump's private resort at Mar-a-Lago as the venue. The Wall Street Journal mentions a date around 27 March, after Xi finishes a trip to France and Italy.
Bloomberg overnight reported that a trade deal might roll back most tariffs to the levels before the trade war started. According to the article, Chinese officials have made clear that removing levies on USD200bn (of USD250bn) quickly was necessary to finalise any deal. However, China is said to have offered to reduce tariffs below the pre-trade war levels on items such as autos (currently 15% tariff) and speed up the timetable for removing foreign-ownership limitations on auto ventures.
Trump's economic adviser Larry Kudlow used a very optimistic tone last week, saying the US and China were on the verge of an ‘historic' pact. US Treasury Secretary Stephen Mnuchin said on Thursday the two nations are working on a 150-page document, which would turn into a ‘very detailed agreement'.
The two sides appear to have agreed on an enforcement mechanism, which is one of the key knots to untie in the negotiations. SCMP writes that the two sides have agreed to monthly meetings at the office director level, quarterly meetings at the vice-ministerial level and semi-annual gatherings at the ministerial level.
Comment. A trade deal is now more a matter of when than if. It would be very positive if most tariffs were rolled back. The alternative scenario would be keeping higher tariff rates for a period until the US had verified that China is delivering what has been agreed. However, China is clearly against this. In our view, we are likely to end up in a situation with more open trade, a more open Chinese economy and more protection of intellectual property than before the trade war started. This should be very positive for global trade. The tech war and rivalry in other areas will continue but in the short term a major cloud from the trade war looks set to be removed. Trump is set to face internal criticism that the deal is not far reaching enough but, in our view, it is hard to see how he could put more pressure on China without weakening his own hand.
Xi is giving Trump a clear win by letting him have the signing ceremony at his private resort in Florida. For what more could Trump wish? It may suggest China would not mind another four years of Trump. After all, one thing Trump has not done is to unite the Western countries against China (on the contrary, he has also been firing at allies on the trade front).
Clearer signs of a growth bottom
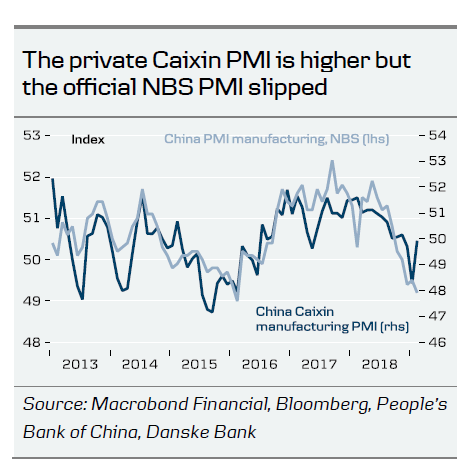
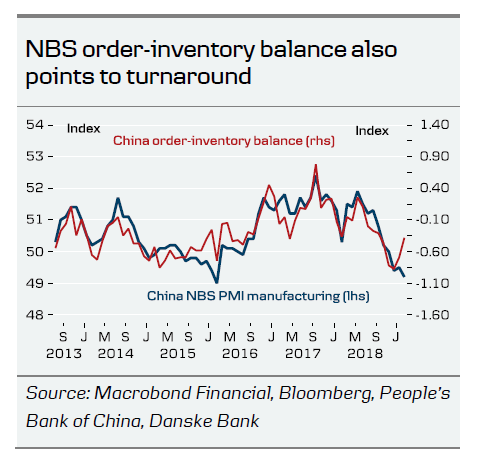
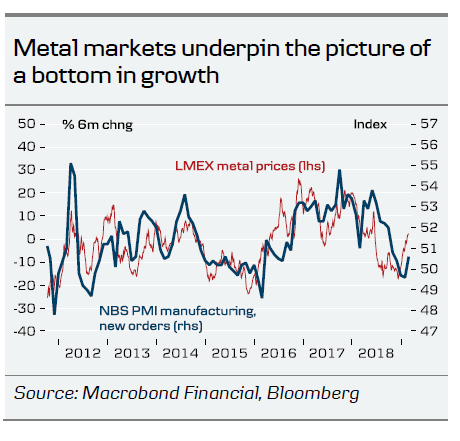
PMI manufacturing for February provided the first decisive recovery signal from economic data (see charts on page 1). In particular, new orders painted a positive picture. The balance between the index for new orders and the index for inventories is now showing a clear turn, which tends to be a reliable signal of a recovery coming. The same picture has emerged from metal markets, which have rebounded recently. Credit growth has also seen a lift.
Comment. We have expected for a while that Q1 would be the bottom, as the drag on Chinese demand from the uncertainty over the trade war should be at its maximum here and economic stimulus from 2018 increasingly kicks in. We now start to see evidence accumulating of this actually happening. Another factor behind the turn is probably that Chinese companies have aimed to reduce inventories due to the higher uncertainty over future sales. To reduce inventories, companies produce below the level of sales for a period. However, once inventories have come down, production needs to rise back up to the level of sales, triggering a rebound in production. Looking forward, we still look for a moderate recovery as stimulus kicks in further and a trade deal reduces uncertainty.
Chinese stock market powering ahead
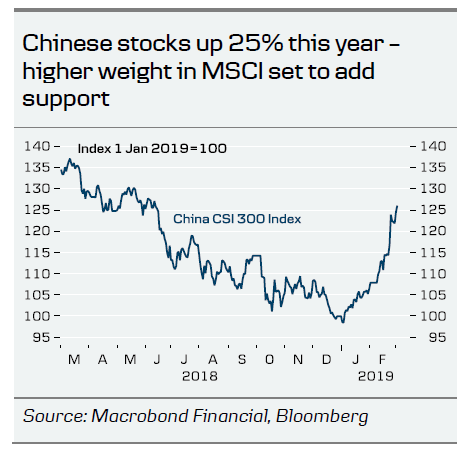
After a dismal 2018, the Chinese stock market is off to a very strong start in 2019. Stock prices are up around 25% this year reversing a large part of the steep decline seen throughout 2018. The move higher has been driven by rising optimism about an end to the trade war with the US as well as the green shoots showing up in economic data recently. Last week, MSCI announced that China’s weight in the MSCI Emerging Markets Index would increase to 3.3% by November, up from the current level of 0.71%. It could trigger inflows worth up to USD125bn, as money managers that track the index as a benchmark will have to buy into the Chinese market to keep in line with the new index (see Financial Times, 1 March).
Comment. The move higher in Chinese stocks has been very fast and the market is ‘overbought’ from a technical point of view. However, we believe fundamentals this year are turning much more positive for Chinese stocks. We look for an economic recovery and the tail risk from the trade war is sharply reduced (although the tech war is set to continue). The rise in the MSCI weight will add extra tailwind, as inflows will support the market. We thus look for Chinese stocks to see a rising trend this year, although in the short term there is a risk of a correction due to the very rapid move. Chinese authorities may also step in at some point if the increase continues too rapidly, as fears over another bubble would come up (as we saw in 2014/15). The Chinese A-share market is affected a lot by retail investors dominated by herd behaviour.
Other China news of the week
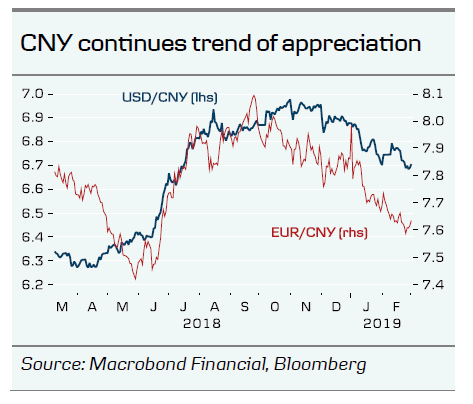
USD/CNY and EUR/CNY continue to trend lower (see chart). We look for USD/CNY to move towards 6.6 in 12 months as the Chinese economy recovers. Huawei presents new 5G foldable phone (see Reuters, 24 February). US Secretary of State Mike Pompeo continued to warn against Huawei. He said it could pose problems for American firms in places using Huawei equipment (see Reuters, 1 March).
Carlsberg buys stake in Chinese microbrewery (see Reuters, 1 March).
Major China And The United States Indexes Are Vulnerable After A Long Rally
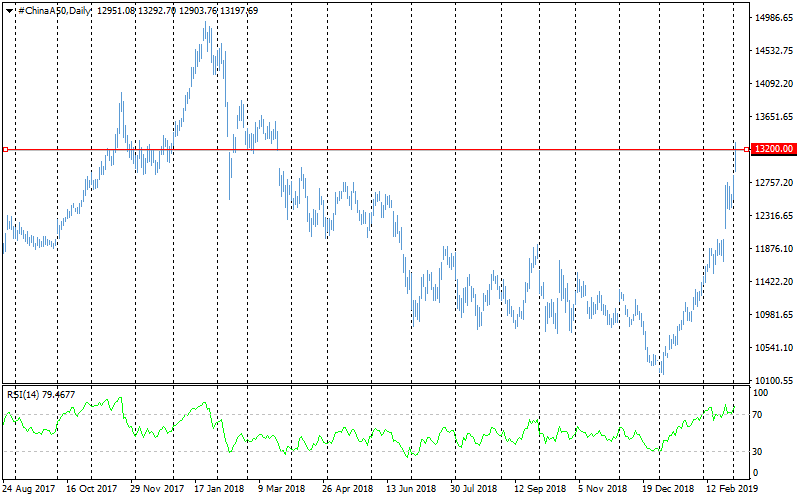
China and the United States returned to optimistic rhetoric about the trade agreement conclusion proximity and negotiations progress. Despite the fact that the initial deadline has already been passed, the markets are extremely positive about this news. The Chinese FTSE China A50 index raised 3% on Monday after almost the same growth on Friday and returned to levels almost a year ago. During the two months of rally, this stock index jumped by 30%, having fully recovered the losses due to trade wars. Such a sharp market growth, despite the US 10% duties and China's response, is explained by the softening of the central banks' monetary policy conditions. The Fed makes it clear that already this year it is ready to stop the balance reduction and make a pause in rate raises. The Central Bank of China softened monetary policy too, pumping the financial system with liquidity.
The S&P 500 price dynamic maintains a positive mood during the Asian trading session at the beginning of the day. Last week we noted the importance of the 2800 resistance on the S&P 500. On Friday, the broad market index managed to close above this level, and on Monday morning, futures are growing to local highs. 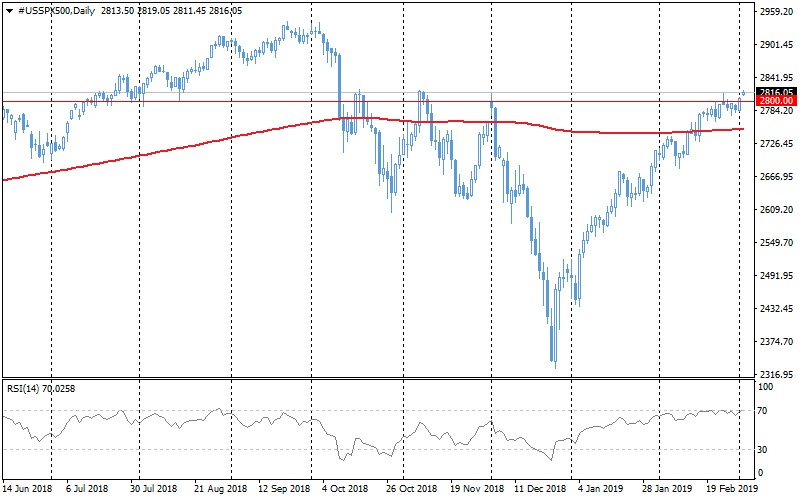
Despite the market growth momentum, it is still necessary to be cautious about joining the rally at this stage. The S&P 500 four times unfolded to decline from current levels since October last year. The popular RSI technical indicator is close to the overbought territory, indicating the risks of a quick correction. If the rollback turns out to be as deep as during the previous times, then the index may fall into the area of 2630, losing more than 6.5% of current levels. Chinese China A50 is even more vulnerable. A 30% increase in only two months very dramatically increases the risks of a rapid correction.
Moreover, during the Monday rally was closed a year-long gap related to the trade wars news. The gap closure often precedes the period of consolidation or reversal, as speculators rush to close the trading idea. In our case, this idea was negative from the trade wars. The RSI remains in the overbought area, noting an even higher risk of a quick correction.
Among the fundamental factors, it is worth noting the rotation of good and bad news related to the course of negotiations. Worse yet, the uncertainty around the two largest world economies trading conditions has been undermining economic growth, and we are increasingly often seeing deterioration of business conditions.
WTI OIL Outlook: Oil Recovers On Fresh Risk Sentiment, But Bulls Need More Evidence To Confirm Reversal
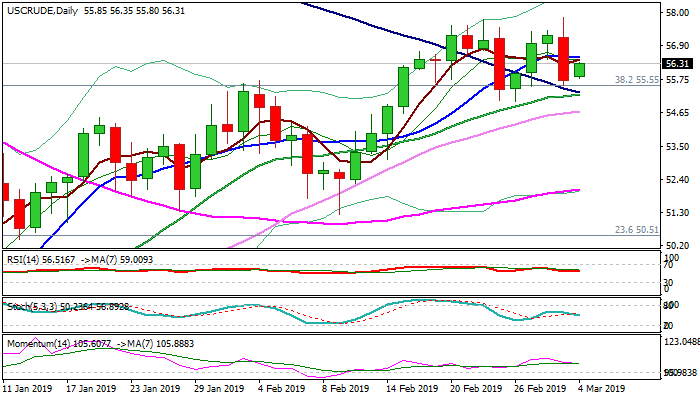
WTI oil price rises on Monday and recovering last Friday's 2.5% fall, boosted by renewed optimism on possible deal on US/China trade talks.
Strong rise in US oil production (peaked at 12.1 million bpd) partially offset positive impact from OPEC's production cut and strong draw in US crude stocks, that kept oil prices limited (repeated upside rejections formed a double-top at $57.79/85).
Near-term price action holds above important supports at $55.55/33 (broken Fibo barrier/100SMA) and maintains bullish bias, but recovery needs clear break above 10SMA ($56.51) to sideline existing downside risk and shift focus towards $57/79/85 tops and $58.35 (100WMA).
Weakening momentum and south-heading stochastic keeps of renewed attack at pivotal supports alive, with the notion being supported by weekly bearish engulfing and weekly stochastics' bearish divergence. Break of $55.55/00 pivotal support zone could bring fresh bears in play and risk deeper pullback.
Res: 56.51, 57.13, 57.85, 58.45
Sup: 56.35, 55.55, 55.33, 55.00
Trade Deal To Boost China Stocks
Hurdles remain, but it looks like a Sino-American trade deal is on the way. China is offering reduction of restrictions, including tariffs on food, chemical and autos while the USA is reconsidering its sanctions on Chinese products in place since last year. A formal agreement could be reached at the summit between President Trump and Chinese President Xi Jinping around 27 March. Chinese equities look attractive, despite growth weakness, given the recovery in credit, fiscal and monetary areas.
China's yuan is up nearly 2.9% year to date. As a deal materializes, trading for the CNY will revert to growth, loose monetary policy (a reserve rate cut of 1.5% expected) and a current account surplus contraction. China's Caixin manufacturing new orders index climbed in February to 50.2, the largest monthly gain since August 2013 and a sharp bounce from 47.7 lows in January. A US-China Trade deal will give markets a much need psychological boost which would spill into real activity in our view.
Short the pound
The pound has staged a decent rally against the USD and EUR in the past weeks, and 1-month implied volatility has fallen further. But uncertainty on Brexit is extreme. Extension of Article 50, thus reducing the likelihood for UK crashing out of EU, is questionable. We will sit on the sidelines (or go long on dips). Today's UK construction PMI is likely to fall towards 50.2 from 50.6 in January: evidence that Brexit uncertainty is taking a toll on the real economy.
USD/JPY Tests Resistance At 112.00
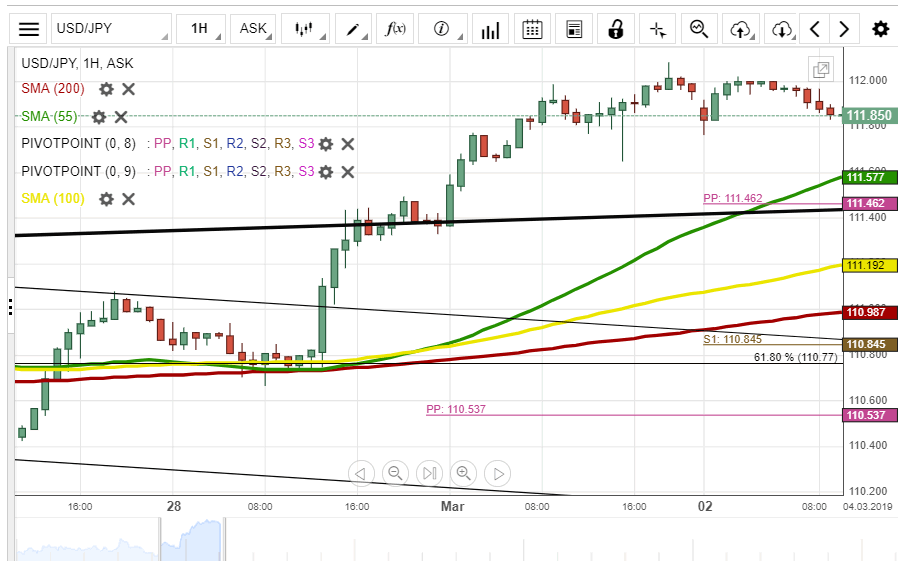
The USD/JPY has reached the 112.00 level, as it was forecast on Friday. The 112.00 level is providing resistance to the currency exchange rate and has forced it into retracing back downwards three times.
The rate most likely will make another attempt to pass the 112.00 level as soon as the 55-hour SMA approaches it from below. It will signal that the pair has ended its consolidation of the recent surge and it can resume its future movement.
In the meantime, take into account that it is still possible that a decline occurs. It would occur in the case of the rate passing the support of the 55-hour SMA.
Gold Continues To Decline
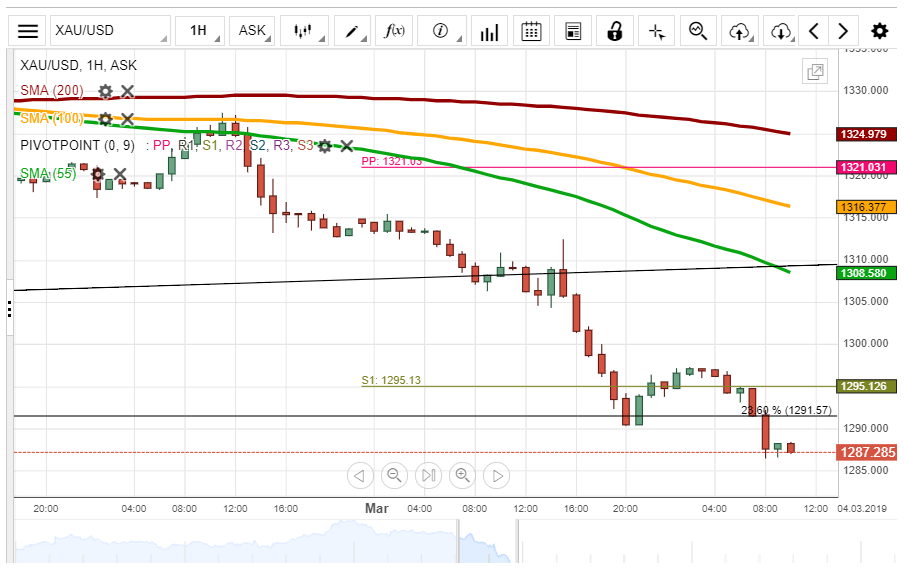
Gold continued to decline on Monday. It had reached below the 1,290.00 level. In general, the decline was expected to continue, as the metal faced no technical support as low as the 1,276.65 level.
Meanwhile, the decline was overextended. Due to that reason the price might first trade sideways to consolidate its level. In addition, the simple moving averages would then catch up.
NZD/USD Decline Likely To Continue
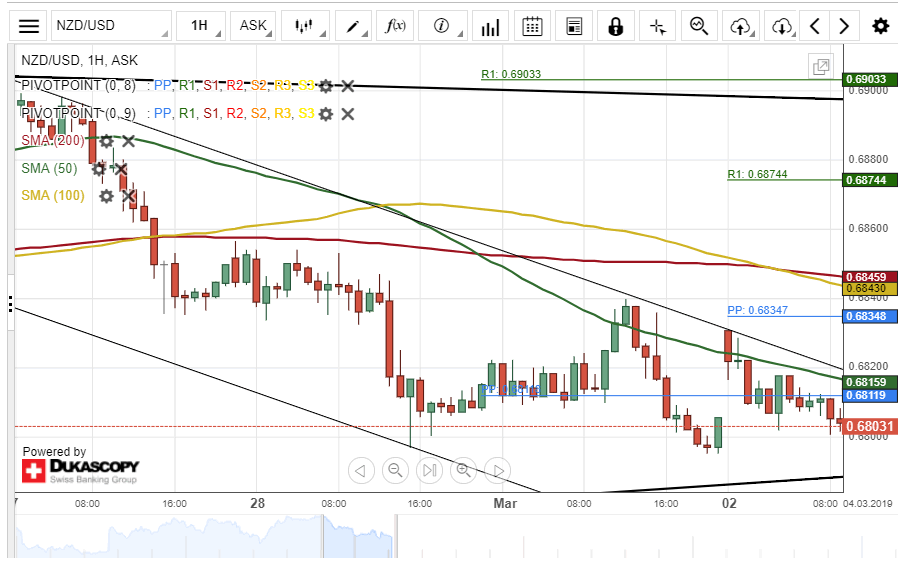
A junior descending channel has guided the New Zealand Dollar lower against the US Doller. The currency pair depreciated about 42 base points during Friday's trading session.
The exchange rate is currently trading near the bottom border of a dominant ascending channel pattern at 0.6801 and could be set for a breakout.
If this breakout occurs, the currency exchange rate will aim at the lower boundary of the junior descending channel at 0.6765.
However, of the bottom border of the dominant ascending channel holds, bullish traders could push the pair towards a resistance cluster at 0.6844.
USD/CAD Surges After NFP
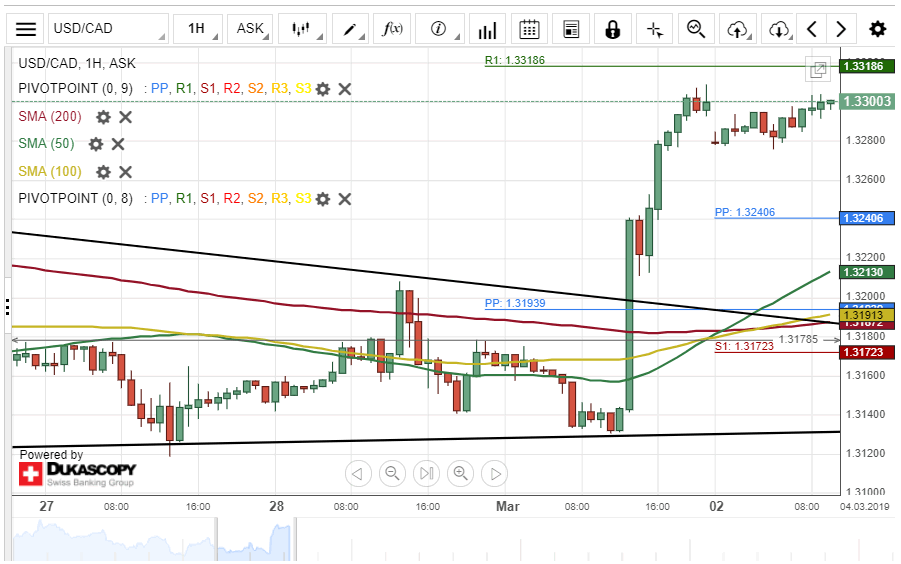
Upside risks prevailed in the market on Friday, thus sending the US Dollar to appreciate by about 177 base points against the Canadian Dollar. The currency pair breached some significant resistance levels during Friday's trading session.
Most likely, it is expected that bearish traders push the price downwards within this session. The potential downside target will be near the weekly pivot point at the 1.3240 area.
If the weekly PP holds, the Greenback will continue to gain strength against the Loonie during the following trading session.
GBP/USD Trades Sideways
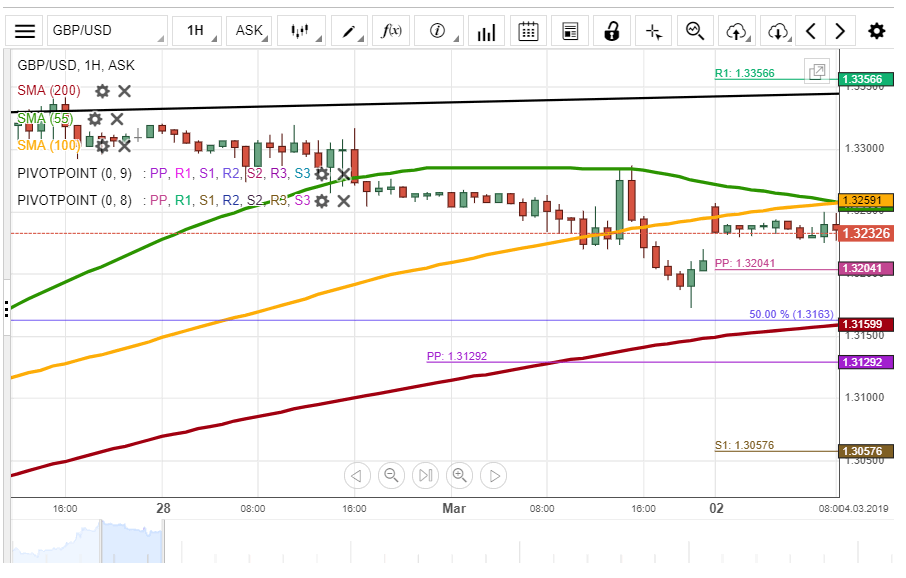
The GBP/USD started the week by opening higher. Although, by the middle of the day's trading the rate had not moved, as it traded sideways just below the 1.3250 level.
Meanwhile, the rate had been approached by the resistance of the 55-hour simple moving average. In addition, the 100-hour SMA had also begun to provide technical resistance to the rate.
In general, the resistance levels might push the rate down into the weekly PP at 1.3204. On the other hand, if they fail, the rate would push up to the 1.3350 mark.
AUD/USD Guided By Junior Descending Channel
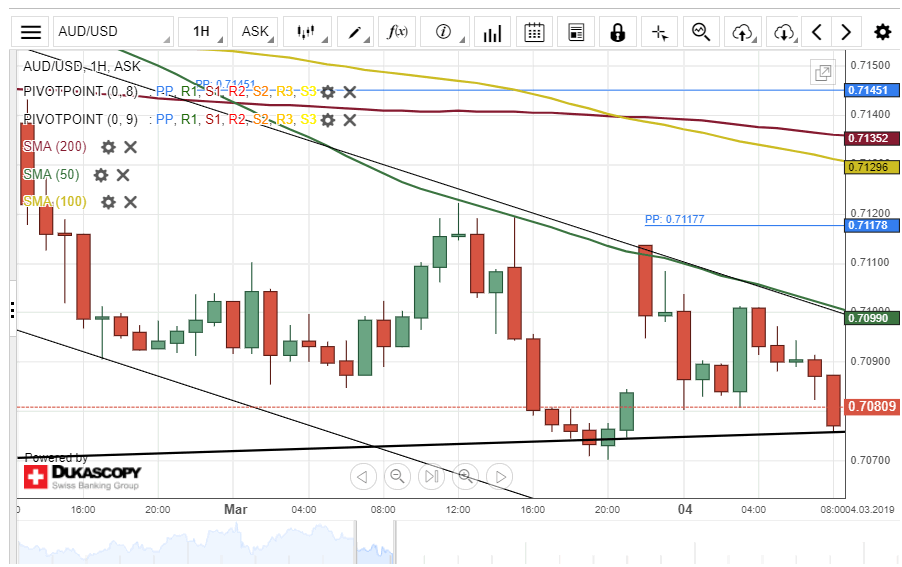
A junior descending channel has been guiding the Australian Dollar against the US Dollar since February 27. The currency pair tested the lower boundary of a dominant ascending channel pattern at 0.7077 during Friday's trading session.
The 50-hour simple moving average is closely guiding the Aussie lower towards the lower bottom border of the junior descending channel pattern at 0.7035. Moreover, technical indicators flash sell signals on both the 4(H) and daily time frame chart.
Although, the currency exchange rate could reverse from the current price level at 0.7077 and aims at a resistance level formed by the weekly pivot point at 0.7117 within this session.