Sample Category Title
EUR/USD Fails To Pass 1.1400
The EUR/USD did not manage to pass the resistance levels at the 1.1400 mark. Instead the rate retreated down to the lower trend line of the ascending channel pattern.
On Thursday morning the rate had bounced off the support of the trend line and had found additional support in the weekly R1 at 1.1380. Due to that reason it was assumed that the rate will make another attempt to pass the 1.1400 level.
On the other hand the rate might trade sideways and that way pass the support of the ascending channel. That way the rate would face the various support on the hourly chart one by one and decline below them.

GBP/USD Retreats On Thursday
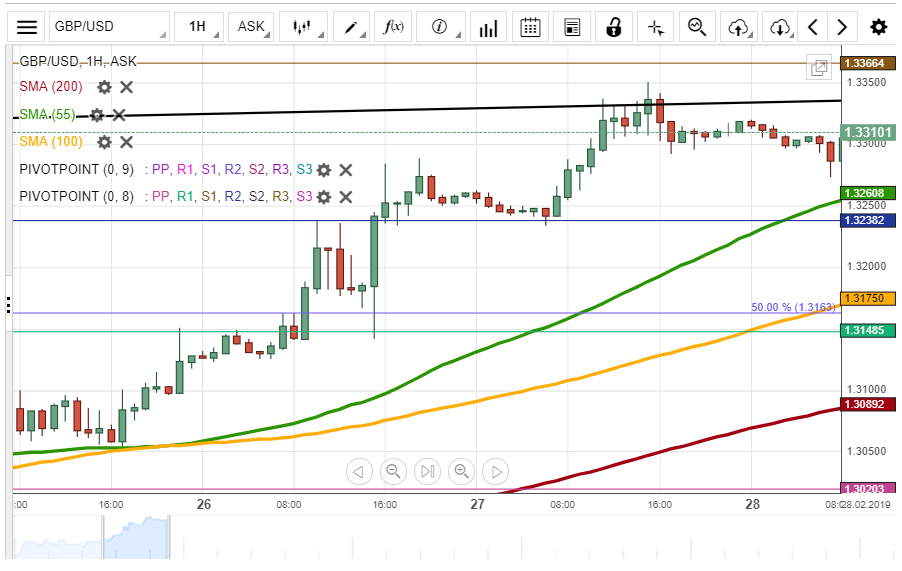
The surge of the GBP/USD had turned into a consolidation on Thursday. Namely, after touching the 1.3350 level the rate slightly declined and afterwards began to trade sideways.
On Thursday, during the morning hour the rate was set to meet with the support of the 55-hour SMA. This technical support could push the pair higher.
On the other hand, if the pair passes the support of the 55-hour SMA, it could decline down to the weekly R2 at 1.3238.
USD/JPY Reveals Descending Pattern
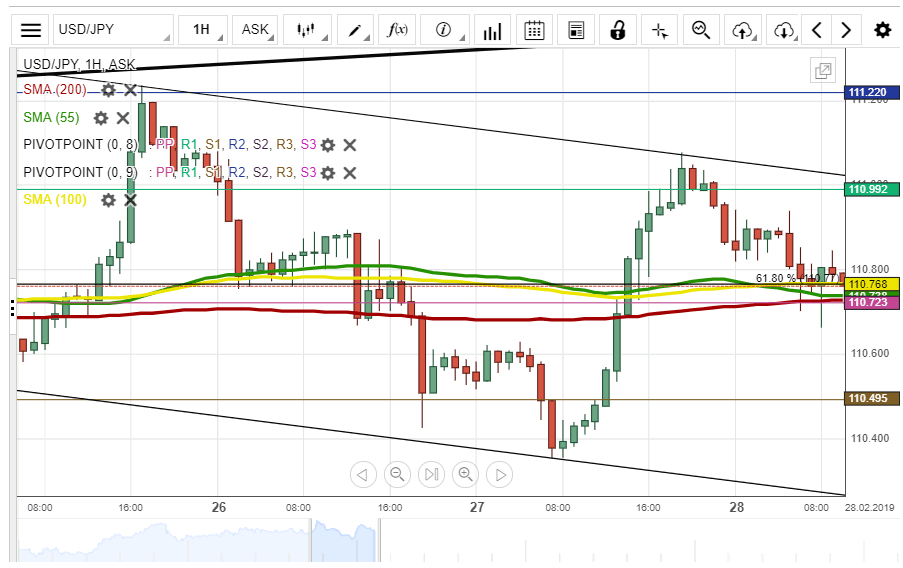
The USD/JPY has revealed a wide descending channel. The event has taken place during the recent sharp waves of volatility caused by fundamental events.
From one side we have the USD surging due to the announcement that the FED will continue to decrease the USD supply throughout this year. On the other hand, the JPY was gaining value as a safe haven currency as soon as the Pakistani and Indian governments started shooting down each other's planes.
Meanwhile, a technical cluster of support levels at 110.80 was providing the needed strength for a surge, which could reach 111.00 by the end of the day's trading.
Gold Charts Are Updated
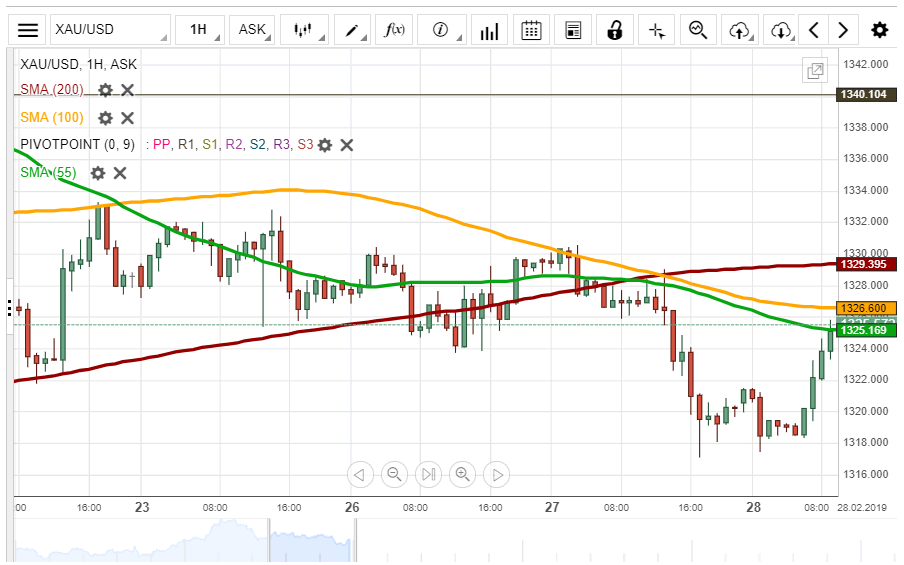
On Thursday the charts of the yellow metal were reviewed and trend lines were added. Meanwhile, the rate had finally properly declined below the resistance of the hourly simple moving averages.
Zoom out to see that the metal is trading in a rare large scale ascending wedge pattern. The rate's surge during the morning hours of Thursday. The surge was set to meet with the resistance of the 55 and 100-hour SMAs, which pushed the rate lower on Wednesday.
Watch the meeting of the technical levels and the rate. It will either result in another test of the supporting trend line or a surge to the 200-hour SMA at 1,330.00.
Meanwhile, note that to properly see the trend lines one has to load the previous price information and candles. Initially seeing the interactive chart, the trend lines might be shifted downwards.
EUR/USD Outlook: Bulls Remain Underpinned By 30SMA And Attracted By Cloud Twist For Final Break Above 1.1407 Fibo Barrier
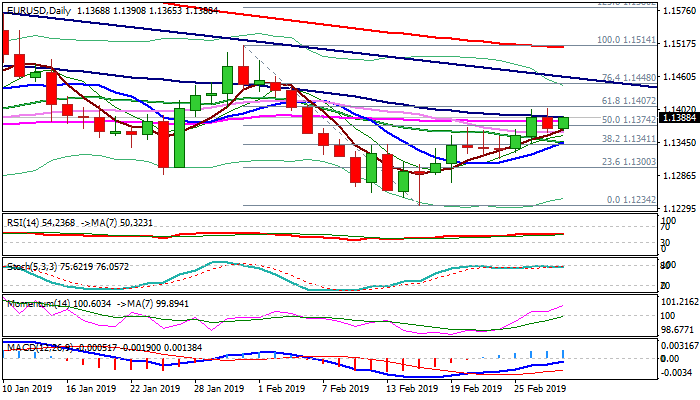
The Euro maintains bullish bias and consolidates under daily cloud, despite repeated failure to clearly penetrate cloud (Wed/Tue).
Bulls repeatedly failed to close above barriers at 1.1389/92 (100SMA / daily cloud base) and attack pivotal resistance at 1.1407 (Fibo 61.8% of 1.1514/1.1234), break of which would generate bullish signal for continuation of recovery rally from 1.1234 (15 Feb).
Strengthening bullish momentum continues to support and daily cloud twist (1.1409) attracts bulls.
Broken 30SMA (1.1362) holds and underpins the action, with support being reinforced by 5/30SMA bull-cross.
Eventual break above 1.1407 pivot would open way towards 1.1448/57 (Fibo 76.4% / bear-trendline from 1.1815).
Conversely return and close below 30SMA would weaken near-term structure, while dip below converged 20/10SMA’s (1.1345) would signal reversal.
Res: 1.1389, 1.1407, 1.1448, 1.1457
Sup: 1.1374, 1.1362, 1.1345, 1.1316
USD Steadies On US-Sino Worries
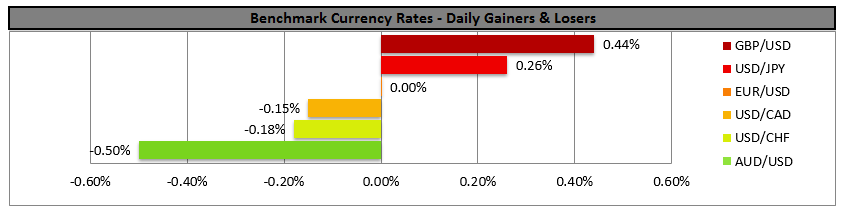
The USD remained rather steady against a number of its counterparts, as worries for the US-Sino trade talks grew. According to media, US trade representative Robert Lighthizer stated in a congressional hearing that it was too early to predict an outcome for the US-Sino trade talks. We would like to add that the soft factory data released during today's Asian session from China and Japan, indirectly strengthen arguments that the US-Sino dispute continues to take its toll on global economic growth. Also the recent confrontation between India and Pakistan, seems to have pushed some investors in the relative safety of the USD, according to analysts. We could see volatility rising for the USD, as the long awaited US GDP growth rate, along with other financial data is due out today. AUD/USD dropped yesterday and stabilised during today's Asian session below the 0.7150 (R1) support (now turned to resistance). We could see the pair remain under pressure today, yet should today's financial releases weaken the USD, we could see the pair having some bullish tendencies. If the bears dictate the pair's direction, we could see it aiming for the 0.7065 (S1) support line. If on the other hand the bulls take over, we could see the pair breaking the 0.7150 (R1) resistance line and aim for the 0.7230 (R2) resistance level.
GBP locks gains after UK Parliament's vote
The sterling strengthened and steadied yesterday against the USD, as the UK parliament backed Theresa May's Brexit strategy in a non-binding vote. Theresa May's optimism could rely on the fact that hard Brexiteers remained rather silent regarding the possibility of a delay of the Brexit date during the sitting of the UK parliament yesterday. Also the fact that hard Brexiteers remained rather muted despite the government moving away from a no deal scenario, implied a softening of their stance. Analysts point out that the risk of a no deal Brexit has substantially fallen and we would like to add that yesterday's Parliament sitting indirectly confirmed that direction. We could see the pound remaining Brexit driven, yet doubts could continue to cap gains or add some pressure for the currency. Cable rose yesterday, breaking the 1.3270(S1) resistance line (now turned to support) and stabilising above it during the Asian session. As mentioned before we could see the pound being under pressure, however also the USD could be under pressure due to today's financial releases. Technically for yesterday's bullish outlook to change, we would require the pair to clearly break the upward trendline incepted since the 22nd of February and we expect the line to be put to the test, probably today. Should the pair come under the selling interest of the market, we could see it breaking the 1.3270 (S1) support line and aim for the 1.3175 (S2) support barrier. Should on the other hand the market once again favor the pair's long positions, we could see the pair breaking the 1.3360 (R1) resistance line and aim for higher grounds.
Today's other economic highlights
During the European session today, we get UK's Nationwide HPI for February, yet the market's interest could be on Euro pair's, as the preliminary French CPI (EU Norm.) for February, the France's GDP rate for Q4 and Germany's preliminary HICP for February are due out. In the American session, we get from the US the GDP growth rate for Q4 and from Canada the current account balance for Q4. As for speakers please note that Fed's Richard Clarida, Atlanta Fed President Raphael Bostic, Philadelphia Fed President Patrick Harker and Dallas Fed President Robert Kaplan speak.
GBP/USD
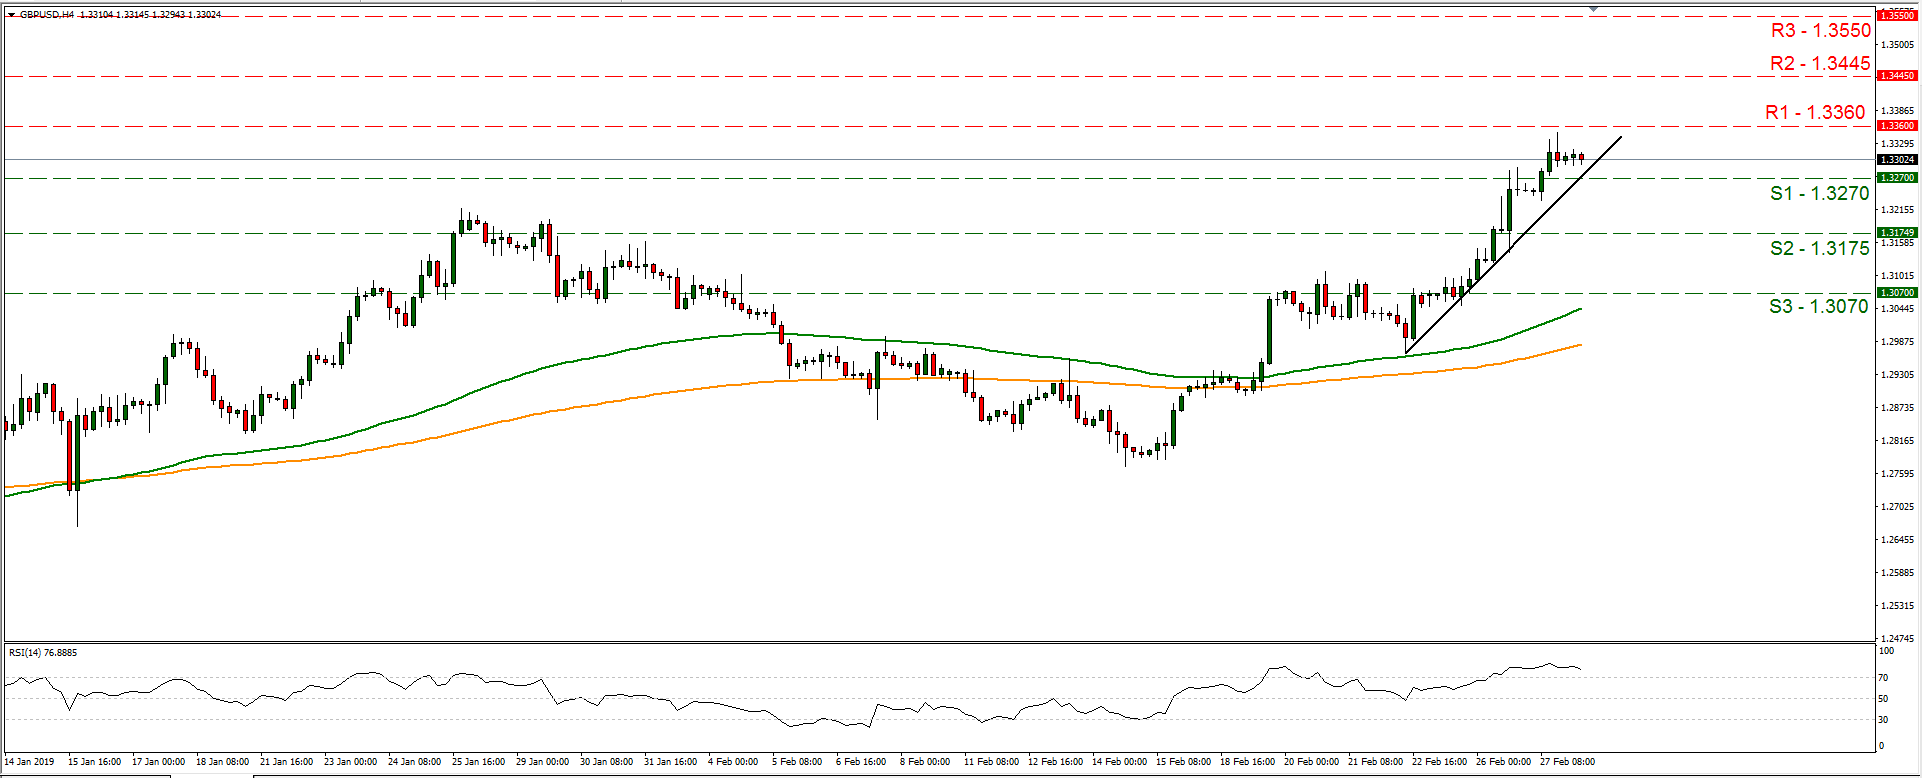
Support: 1.3270 (S1), 1.3175 (S2), 1.3070 (S3)
Resistance: 1.3360 (R1), 1.3445 (R2), 1.3550 (R3)
AUD/USD H4
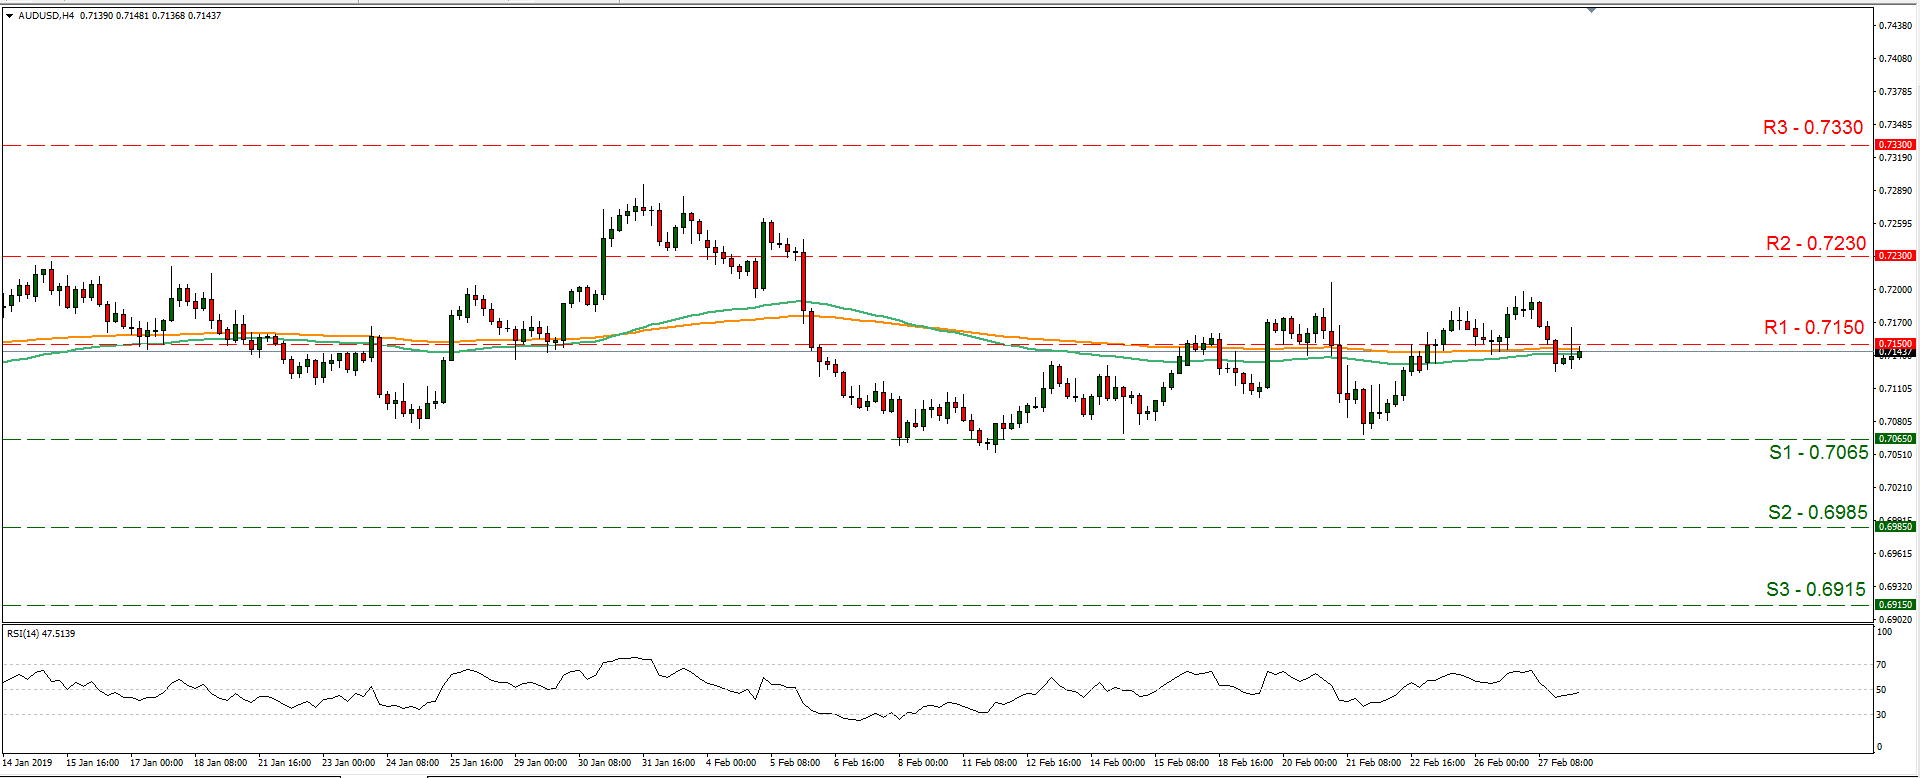
Support: 0.7065 (S1), 0.6985 (S2), 0.6915 (S3)
Resistance: 0.7150 (R1), 0.7230 (R2), 0.7330 (R3)
USDCHF Extends Downtrend Below 3-Month Highs
USDCHF came under a strong sell-off early on Thursday as risk-off sentiment returned to the markets. Technically, the cautious attitude could persist in the short term as the MACD continues to lose weaken below its red signal line and towards zero and the RSI is moving into bearish territory, both endorsing a neutral to bearish bias.
Further losses could reach the area around the 50% Fibonacci of 0.9921 of the downleg from 1.011 to 0.9715, which is surrounded by the 50- and the 200-day moving averages. A shift below the 200-day MA, could open the door for the 38.2% Fibonacci of 0.9873, while even lower the 23.6% Fibonacci of 0.9812 could also provide support to negative corrections.
Alternatively, an upside reversal would likely retest the 20-day MA currently at 1.00 before entering the 1.003-1.009 region. A decisive close above the 1.011 top could prove pricey for the bulls as more gains could follow, shifting attention up to the next resistance of 1.025. The neutral outlook in the bigger picture would also change to a bullish one in this case.

NZDUSD Creates Bearish Rally, Neutral In Short Term
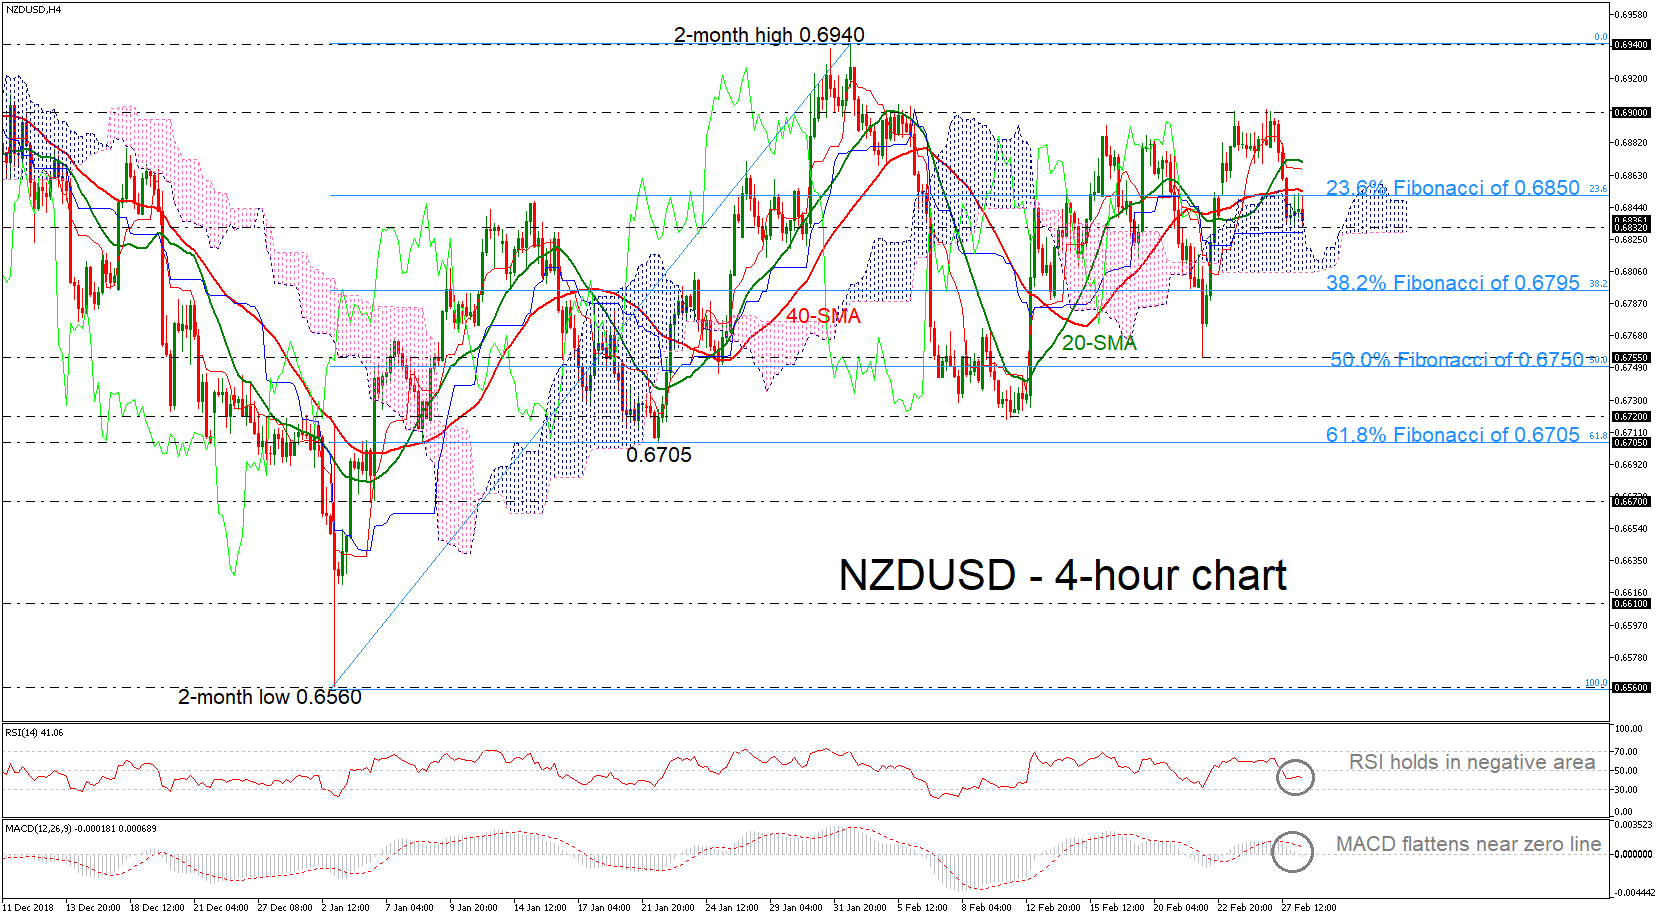
NZDUSD has lost its positive momentum following the bounce off the 0.6900 psychological level, which pushed the price below the 20- and 40-simple moving averages (SMAs) as well as below the 23.6% Fibonacci retracement level of the upleg from 0.6560 to 0.6940, around 0.6850. Also, the price is struggling inside the Ichimoku cloud and the RSI and the MACD are moving with weak momentum in the 4-hour chart, suggesting a neutral mode.
In the negative scenario, a slip below the 0.6832 support could open the way towards the 38.2% Fibonacci of 0.6795 before heading until the 0.6750 – 0.6755 support area, which encapsulates the 50.0% Fibonacci region.
A reversal to the upside and a successful jump above the 23.6% Fibonacci and the 40-SMA could retest the 20-SMA currently at 0.6870. Higher still, the 0.6900 handle would increasingly come into scope, while the two-month high of 0.6940 could be the next resistance for investors to turn their attention in the near term.
In the longer-timeframe, NZDUSD has been slightly bullish after the bounce off the two-month low of 0.6560, however, in the short-term the price has been remaining neutral over the last month.
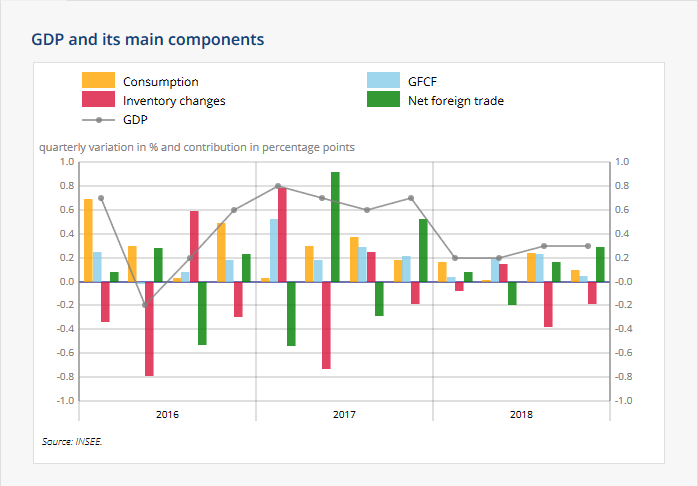
French GDP grew 0.3% in Q4, positive contribution from foreign trade
French GDP grew 0.3% qoq in Q4, matched expectations. Over the year, growth slowed to 1.5% in 2018, down from 2.3% in 2017. Looking at the details, final domestic demand excluding inventory changes decelerated: it contributed 0.2 points to GDP growth, after 0.5 points in the previous quarter. Foreign trade balance contributed positively to GDP growth again: +0.3 points, after +0.2 points in Q3. Conversely, changes in inventories contributed negatively to GDP growth again (−0.2 points after −0.4 points).
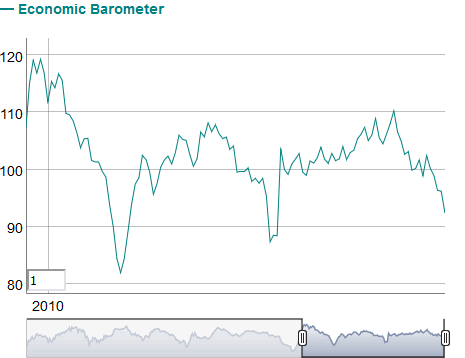
Swiss KOF dropped to 92.4, deteriorating sentiment extended from manufacturing to others
KOF economic Barometer dropped to 92.4 in February, down from 96.2 and missed expectation of 96.0. KOF noted that recent downward tendency " continued unabated", and the Swiss economy can expect to experience a "weak phase" in the coming months. And, the marked decline is predominantly due to negative impulses from the manufacturing industry; but the deteriorating sentiment has meanwhile also extended to the other components of this barometer.