Sample Category Title
Brexit Risks Ahead
Risk appetite is again on the back burner after President Trump and N. Korea’s Kim failed to make any agreement at the Hanoi summit – the meet was cut short by Trump.
Cautious market sentiment is also being aided by uncertainty over the progress in Sion-U.S trade talks. U.S Trade Representative Lighthizer’s guarded comments this week that increased Chinese purchase of U.S goods is “not enough” to make a trade deal.
On the data front, China’s economic growth continued to slow, albeit the data was influenced by the Lunar New Year holiday. Chinese PMI, the first official gauge for this month, showed activity slumped further, below the 50 mark, that signifies contraction to 49.2, while new export orders also slid. While in Europe, inflation data for February showed small steps of improvement and should help the ECB to achieve its target later in the year.
Stateside, U.S Q4 GDP came in at +2.6%, better than the +2.2% forecasted by the street, but lower than the +3.4% growth seen in Q3. The miss in the headline is being blamed on the recent U.S government shutdown and the China-U.S trade war.
The reduced risks of a “no-deal” Brexit have helped lift the EUR and GBP this week, however, upside is likely to be relatively contained,” particularly given concerns over eurozone economic weakness and the Brexit final outcome.
Brexit timeline:
Vote on a revised deal (meaningful vote) – By Mar 12
May has promised to bring back a revised deal to parliament and hold a vote on whether to approve it by March 12.
If that fails, MPs will be offered two separate votes:
- One, on the following day, on whether MPs support a no-deal Brexit – so the UK would “only leave without a deal on 29 March if there is explicit consent in the House for that outcome”
- If that fails, then MPs will get a vote by 14 March on requesting an extension to the two-year Article 50 negotiation process to delay EU withdrawal beyond 29 March
PM May has indicated that she does not want to see Article 50 extended.
EU SUMMI – Mar 21-22
EU leaders are due to meet in Brussels. This could be an opportunity for an eleventh-hour deal, or it would be the last chance to agree an extension of the Article 50 negotiation period and delay Brexit to avoid no-deal disruption.
Last weekend – Mar 23-24
If a deal is seen as viable at the summit, officials could work through the weekend to nail down the details with a final deal – and a possible extension to June 30 conditional on British parliamentary approval – announced on Sunday, Mar 24-Monday, March 25.
Final week – Mar 25-29
If a deal could be clinched, then the British parliament could vote on it, possibly on March 26. The European Parliament could ratify the deal that week.
Exit Day – Mar 29?
If May does not get a deal approved by parliament by March 29, Britain faces a disorderly exit or may be forced to seek an extension of Article 50 to give more time to reach an agreement. It is not certain the EU would agree to this.
Geopolitical ‘hotspot’
Tensions between Pakistan and India are at their highest point in almost 50 years after Pakistan shot down an Indian military jet flying over the disputed Kashmir territory and India carrying out a pre-emptive strike on a terrorist training camp in Pakistan.
On the Economic Calendar, no releases are scheduled for this weekend.
Market concerns:
• U.K/Brexit fallout
• Sino/U.S – trade & tariffs
• China/Aussie – coal war
• Weaker China data
• Muller/Trump – AG Barr is set to announce the completion of the report
• OPEC, Saudis, Venezuela & Trump
• Geo-political concerns in Russia, Ukraine and France
• India/Pakistan – tension high amongst two nuclear nations
• ‘Twitter Trump’
• U.S debt ceiling worries
• Spanish snap elections expected to be full of surprises April 28
Next week: Reserve Bank of Australia (RBA) monetary policy announcement (Mar 4/5), AUD GDP (Mar 5), CAD Trade balance, Bank of Canada (BoC) rate announcement & AUD retail sales (Mar 6), European Central Bank (ECB) rate announcement (Mar 7), U.S non-farm payrolls (NFP) & CAD employment release (Mar 8)
Dollar Mixed after Better than Expected GDP
- US GDP – American Growth is Great
- Korea – Summit ended early with no deal
- China – Weak PMIs may not be as bad as you think
- Oil – Unfazed by GDP data
- Gold – Softer after US GDP cools
GDP
The US economy appears to be on solid footing after fourth quarter GDP cooled better than expected. The fourth quarter reading for US GDP came in at 2.6%, better than the 2.2% forecast by analysts, but lower than the 3.4% growth seen in the third quarter. The December effects from the government shutdown and trade war appear to have slightly brought down growth prospects and will lead many to believe the retail sales collapse in December will see a positive revision.
The US economy does not appear to be losing steam and this economic cycle is showing signs it is here to stay. Fed rate cut expectations are likely to dwindle and we could see arguments return for the next move to be a rate hike.
The US dollar is slightly stronger against the Japanese yen and commodity currencies. The yield on the 10-year Treasuries is higher by 2 basis points at 2.706%. US equities are slightly lower in early trade.
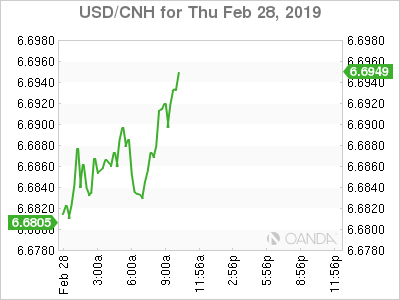
Korea
President Trump walked out on Kim Jong Un after it become apparent North Korea wanted all the sanctions lifted for the removal of their main nuclear facility in Yongbyon. Kim was blindsided at the summit with evidence they created additional secret nuclear sites. The market reaction was negative to risk appetite, but hardly anyone thought something concrete would come from this trip.
What was disconcerting was the way the US handled the trip to Vietnam. Surprising North Korea with evidence that would likely derail their negotiation strategy was unlikely to make them cave and probably should have been provided in advance. The visual of Trump walking out of the second summit with Kim will likely raise concerns that Trump may use the same move with President Xi when they attempt to end the US-China trade war.
China
China’s factory activity gauge declined further in February to a 3-year low. The effects of the Lunar New Year holiday definitely weighed on the data, but many analysts expected the data could have been much worse as factory workers took off a full week. The key to a rebound will remain on a resolution with the US-China trade war. Delaying the tariff increase is not good enough to solidify Chinese economic growth and a framework agreement is needed next month.
Oil
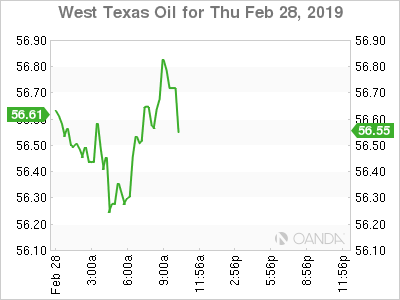
Crude prices remained stable after US economic growth did not cool as much as expected. The key to oil remains the battle between President Trump and OPEC. With crude imports to the US falling to a two-decade low and sanctions firmly in place on Iran and Venezuela, oil could remain supported until US production picks up in the warmer months.
Gold
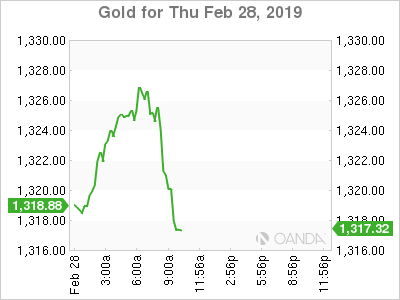
Gold lost of all its gains after the US delivered an impressive fourth quarter GDP reading. The de-escalation in tensions between India and Pakistan also provided some pressure on the yellow metal earlier in the session, but by no means should lead one to believe this risk event is off the table. Gold will likely be supported on slower economic readings from China and Europe and concerns the trade war will intensify before we see a deal. Yesterday, US Trade Representative Lighthizer’s cautious comments on trade progress served as a reminder a deal is not necessarily imminent.
Sunset Market Commentary
Markets
Global core bonds are edging lower today. After a drop yesterday, core bonds stabilized during Asian trading hours. Sentiment soured overnight as weak Chinese manufacturing PMI’s added to concerns over slowing global growth, while US President Trump abruptly left the negotiation table with North Korea without a deal. US Treasuries rebounded cautiously, while German Bunds lost additional ground. EMU CPI readings printed little below, but close to, expectations and had little impact on trading. The German yield curve is bear steepening with changes up to +2.3 bps (30-yr). US Treasuries upheld a slightly upward bias throughout the day as the US/NK talks ended unexpectedly and investors awaiting a full eco calendar. US Q4 GDP growth printed above expectations (2.6% ann. vs 2.2% exp.) and so did the Core PCE inflation gauge (1.7%, Q/Q vs. 1.6% exp.). US Treasuries fell lower, dragging other core bonds with it. The Chicago Purchasing Manager index for February printed strong too (64.7 vs. 57.5 in January). The US yield curve edges higher with changes from +0.3 bps (30-yr) and + 1.9 bps (5-yr). Peripheral spreads over the German 10-year yield tighten today with Italy (-4 bps) and Greece (-6 bps) outperforming.
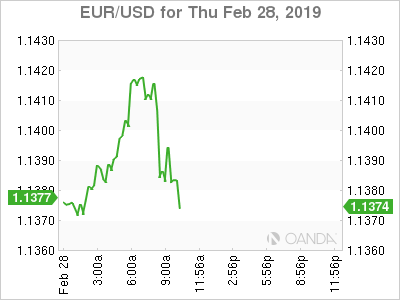
The ‘returned-to-Europe trade’ continued today and propelled EUR/USD above the 1.14 handle. Global sentiment turned more cautious as the meeting between US President Trump and North Korean Leader Kim Jong Un ended abruptly without an agreement, but this global topic had only a modest impact on European markets. European inflation data were mixed and are still quite far away from the ECB ‘s 2% target. Still, markets see signs of a potential bottoming both in EMU activity and inflation, supporting recent tentative rise of European yields and of EUR/USD. EUR/USD traded north of 1.14 going into the publication of the US Q4 GDP report. US Q4 growth (2.6% QoQa) was stronger than expected and so was the core PCE inflation. Later, the Chicago PMI also surprised the consensus by a significant margin. The dollar rebounded, but EUR/USD maintained most of recent gains. Interest rate differentials between the US and Germany are still narrowing in a daily perspective. EUR/USD is trading in the 1.1385 area. USD/JPY profits from the US data and from the rise in core (US & EMU) yields. The pair returned north of 111.
Recent GBP rally did run into resistance after yesterday’s Brexit votes in the UK Parliament. Today, sterling fell prey to modest profit taking. High profile Brexit headlines are receding as backstage negotiations between the UK and the EU continue. In an ideal scenario, this process should lead to an approval of a Brexit deal in the UK Parliament on March 12. Chances on a no deal Brexit diminished substantially, but all event risk isn’t out of the way yet. With some good news discounted, ST sterling longs took some chips off the table. EUR/GBP rebounded and is trading in the 0.8575 area. Cable dropped below 1.33.
News Headlines
Swedish GDP growth beat 0.6% Q/Q forecast in Q4 2018, rising by 1.2% Q/Q and coming from a minor decline in Q3 (-0.1% Q/Q). Details showed contributions from consumption, net exports and government expenditure while investments declined. Strong January retail sales furthermore suggest an extension of momentum in Q1 2019. EUR/SEK fell back below 10.50 as data strengthen the Riksbank’s case for a second rate hike in H2 2019.
US 2018Q4 GDP beat expectations and grew a solid 2.6% QoQa vs. 2.2% expected. Private consumption proved the strongest driver of growth (adding as much as 1.92% points), followed by a recovery of business investment (0.62% points). Growth impact of inventories (+), government spending (+) and net exports (-) was negligible. Q4 core PCE increased a tad to 1.7% QoQ (vs. stabilization at 1.6% expected).
US: GDP Growth Slows a Bit in Q4-2018
Although real GDP growth slowed in the fourth quarter, the stronger-than-expected outturn should alleviate some concerns that the economy is in serious trouble.
Deceleration in PCE Leads to Slower GDP Growth
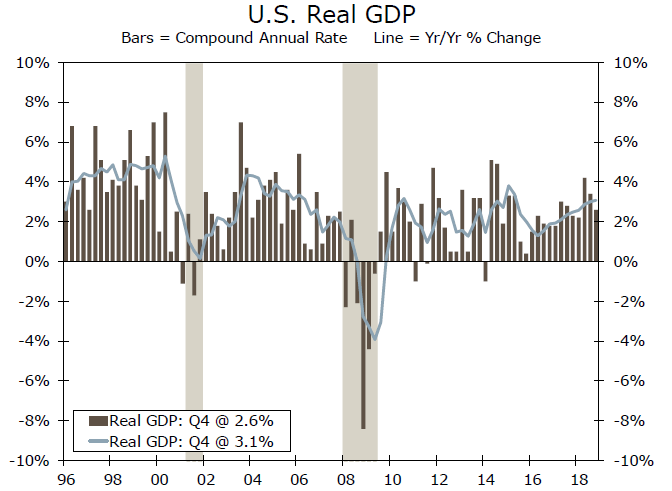
Data released this morning, which had been delayed due to the government shutdown, showed that real GDP in the United States grew at an annualized rate of 2.6% in Q4-2018 relative to the previous quarter (top chart). The outturn was stronger than the 2.2% rate that the market consensus had expected, but it still represents a stepdown from the very strong growth rates that were registered earlier in the year.
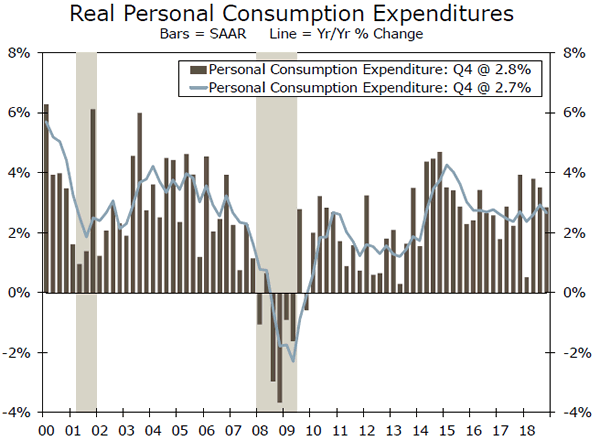
The breakdown of the GDP data into its underlying demand components showed that the deceleration was led by real personal consumption expenditures (PCE), which grew 2.8% in Q4 (middle chart). Real PCE was boosted, at least in part, earlier in the year from the personal tax cuts that were part of the Tax Cuts and Jobs Act (TCJA) of December 2017. Although the real income-boosting effects of the tax cuts will fade over time, income growth should remain solid due to the robust labor market. Not only has employment growth remained strong, but wages are now rising at a decent clip. Although growth in real PCE is not likely to rebound to the rates that were registered earlier in 2018, we look for PCE to grow at a 2%-plus clip in coming quarters.
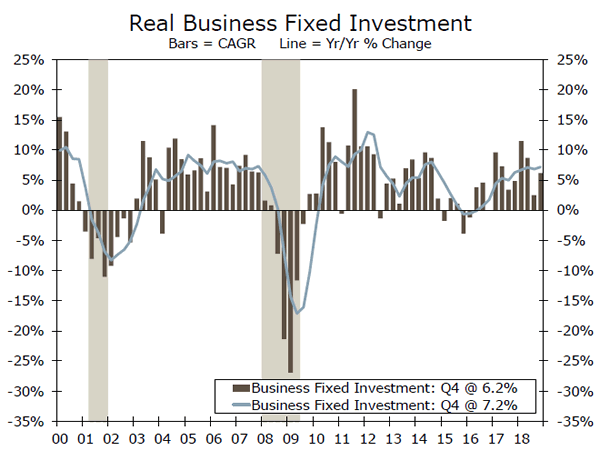
Business fixed investment (BFI) spending, which grew only 2.5% in Q3-2018, rebounded to a growth rate of 6.2% in Q4 (bottom chart). That said, the construction component of BFI spending remained weak. Non-residential construction spending slipped 4.2%, which likely reflects weakness in the energy sector. In addition, residential construction fell for the fourth consecutive quarter, a victim of the one-two punch of rising house prices and higher mortgage rates. Looking forward, recent data on durable goods orders suggest that growth in capital spending likely will be anemic in the first half of 2019. In short, there really has not been a sustained acceleration in BFI spending as some analysts had hoped a year or two ago.
The effects of the government shutdown, which started in December, also showed up in the data as non-defense federal government spending tumbled at an annualized rate of 5.6% in Q4. Because the shutdown lasted into January, this component of spending likely will be weak in Q1 as well before rebounding in Q2. Some inventory building added a bit to topline GDP growth, although net exports exerted some modest headwinds.
The stronger-than-expected GDP outturn should alleviate some concerns that the economy is in serious trouble. Our current forecast looks for further deceleration in the first quarter—we look for real GDP to grow roughly 2% in Q1—but we look for a modest rebound starting in Q2. Growth is probably not strong enough right now to induce the Fed to resume its tightening cycle. But we look for the FOMC to tap on the brakes again with another 25 bps rate hike later this year (probably sometime in the third quarter).
EUR/JPY Mid-Day Outlook
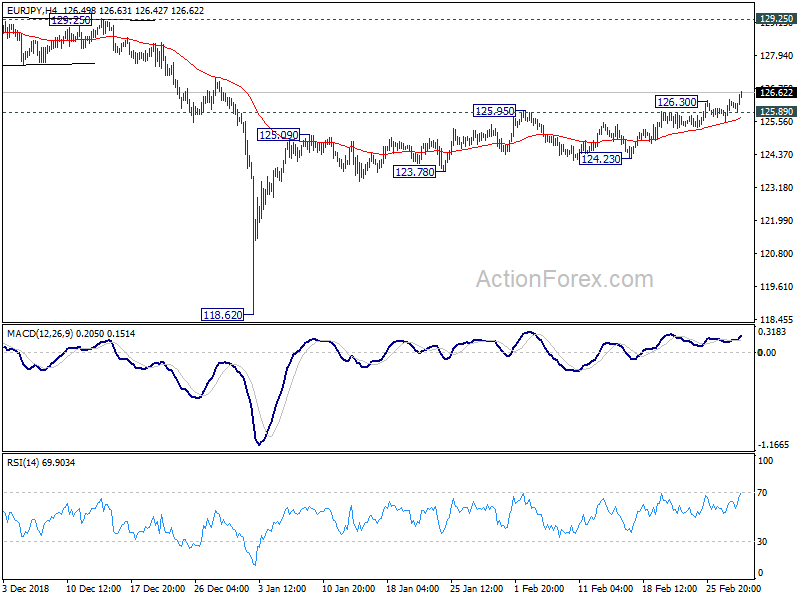
Daily Pivots: (S1) 125.70; (P) 126.03; (R1) 126.52; More....
EUR/JPY's solid break of 126.30 suggests resumption of rise from 118.62. Also, with 55 day EMA now firmly taken out, further rise should be seen to 129.25 resistance next. Decisive break there will target 133.12 key resistance. On the downside, below 125.89 minor support will turn intraday bias neutral first. But near term outlook will remain cautiously bullish as long as 124.23 support hoods.
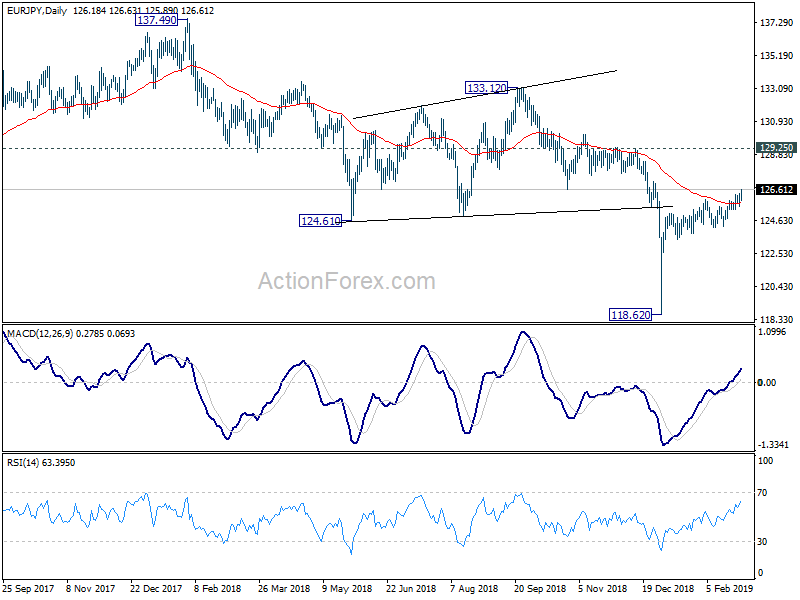
In the bigger picture, current development argues that medium term decline from 137.49 (2018 high) has completed at 118.62 already. Decisive break of 133.12 resistance will confirm this bullish case. And whole up trend from 109.03 (2016 low) might resume through 137.49 in that case. On the downside, break of 124.23 support will invalidate this case and turn focus back to 118.62 instead.
U.S. Economy Ends 2018 on a Positive Note
The U.S. economy downshifted to a 2.6% annualized pace in the fourth quarter, from a 3.4% clip in Q3. Q4's showing beat market expectations for a 2.1% gain. The U.S. economy grew 2.9% in 2018 as a whole, tying 2015 for the best year for growth since the recession.
Due to the government shutdown, this "initial" estimate of GDP is based on a blend of the source data used in the advance estimate and some of the data used in the second estimate of GDP, therefore, it is less complete than the typical second estimate of GDP.
Consumer spending growth cooled from Q3's 3.5% to a still-strong 2.8% annualized. Spending on durable goods was quite strong (+5.9%), helped by gains in motor vehicles (+9.2%). Outlays for nondurable goods (+2.8%) and services (+2.4%) cooled, but remained healthy.
Business investment was a pleasant surprise, rising 6.2% in Q4, up from 2.5% in Q3. This positive news came despite a bigger-than-expected decline in structures (-4.2%). Lower oil prices likely weighed on spending in the energy sector. In contrast, outlays for intellectual property jumped up 13.1% thanks to double-digit growth in both software and R&D. Spending on equipment was also healthy, accelerating to a 6.7% pace.
Weakness in residential investment continued in the fourth quarter, contracting 3.6%. Residential investment has declined for four quarters straight, as higher mortgage rates and tax changes weighed on the housing market.
Government spending was softer than expected, rising only 0.4%. Federal spending rose a modest 1.6%, as nondefense expenditures dropped 5.6%, and state and local government spending fell 0.3%. The BEA estimates that the impact of reductions in services provided by the federal government (due to the partial shutdown) subtracted about 0.1 percentage point from real GDP growth in the fourth quarter.
Inventory growth surprised to the upside, contributing positively to headline GDP (+0.1 percentage points).
Exports rose a modest 1.6% after a 4.9% decline in Q3, while imports rose 2.7%. As expected, net exports were a drag on headline GDP (-0.2%-pts).
Key Implications
The U.S. economy had more momentum at the end of 2018 than anticipated. There were pleasant surprises on consumer and business spending. Final domestic demand ran at a 2.6% pace, just a shade off the 2.9% outturn in the third quarter
Yesterday's victories don't win today's ballgames. The economy may have chalked up 3.1% growth in 2018 (Q4/Q4), but high-frequency data indicates that momentum slowed heading into 2019. Some of this weakness was due to the confidence hit from the government shutdown, but not all of it.
We expect growth of slightly better than 2% over the course of 2019, but there are a lot of downside risks out there. It looks like the worst case scenario on the China-U.S. tariff escalation won't come to pass, but fiscal risks still loom as the year progresses. Overall, Q4's better-than-expected performance is backward looking and as such is unlikely to move the Fed off its wait-and-see stance.
EUR/USD Mid-Day Outlook
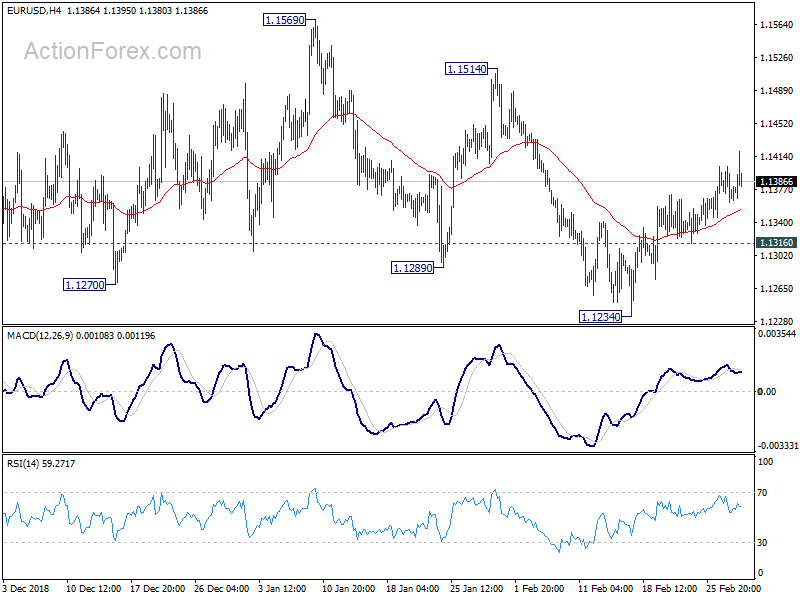
Daily Pivots: (S1) 1.1354; (P) 1.1378; (R1) 1.1395; More.....
EUR/USD's rebound from 1.1234 is still in progress and as long as 1.1316 minor support holds, further rise is expected. Current rally is seen as another leg in the consolidation pattern from 1.1215 and could target 1.1514 resistance and above. On the downside, though, break of 1.1316 minor support will argue that the rebound is completed. Intraday bias will be turned back to the downside for 1.1215 low.
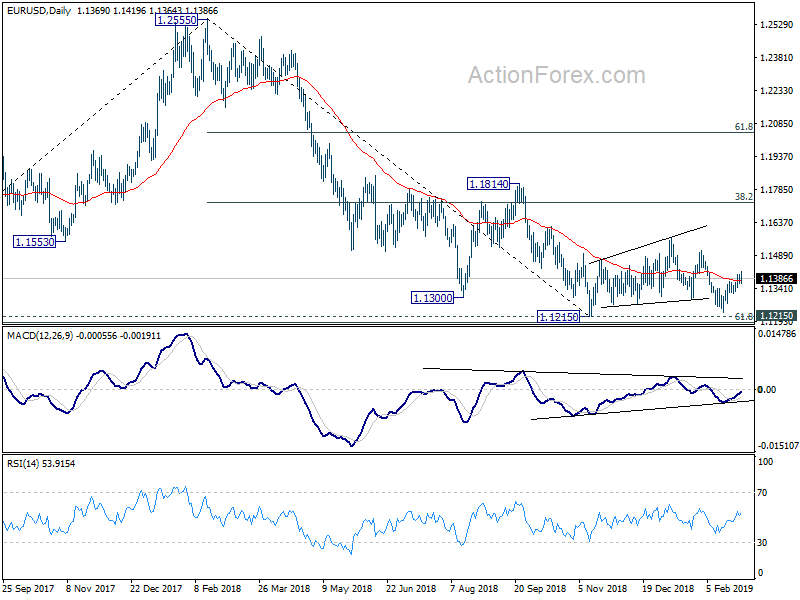
In the bigger picture, as long as 1.1814 resistance holds, down trend down trend from 1.2555 medium term top is still in progress and should target 61.8% retracement of 1.0339 (2017 low) to 1.2555 at 1.1186 next. Sustained break there will pave the way to retest 1.0339. However, break of 1.1814 will confirm completion of such down trend and turn medium term outlook bullish.
GBP/USD Mid-Day Outlook
Daily Pivots: (S1) 1.3244; (P) 1.3298; (R1) 1.3362; More....
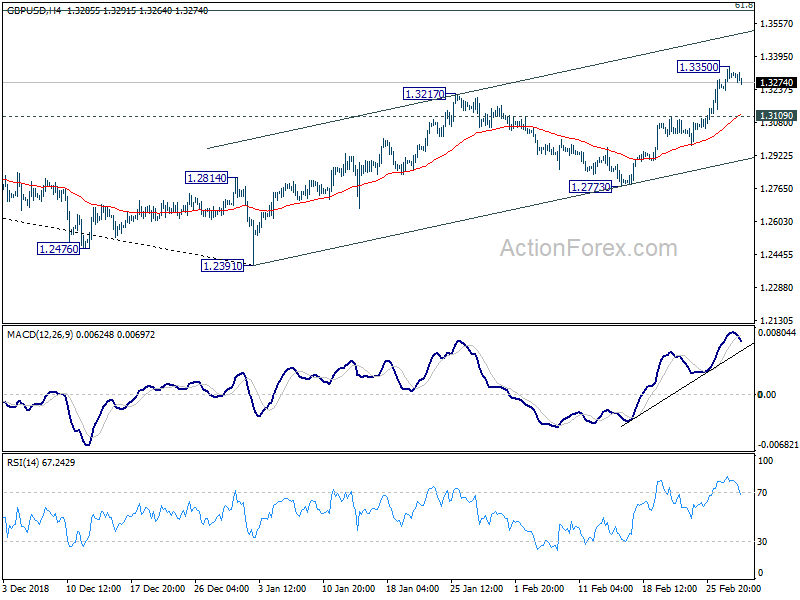
A temporary top is in place at 1.3350 with 4 hour MACD crossed below signal line. Intraday bias in GBP/USD is turned neutral for some consolidations. Downside of retreat should be contained by 1.3109 resistance turned support to bring another rally. On the upside, above 1.3350 will target 61.8% retracement of 1.4376 to 1.2391 at 1.3618 next. Sustained break will pave the way to 1.4376.
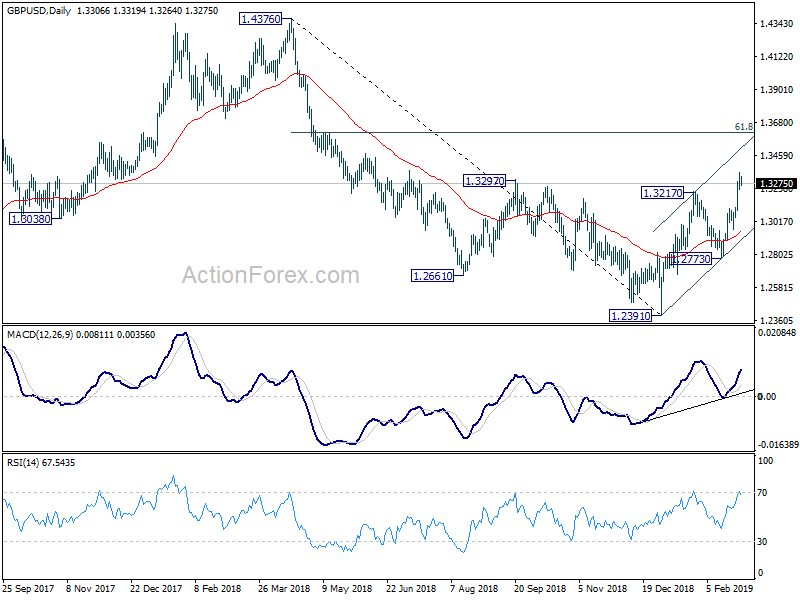
In the bigger picture, medium term decline from 1.4376 (2018 high) should have completed at 1.2391. Rise from 1.2391 is now seen as the third leg of the corrective pattern from 1.1946 (2016 low). Further rise could be seen through 1.4376 in medium term. On the downside, though, break of 1.2773 support will turn focus back to 1.2391 low and then 1.1946.
USD/CHF Mid-Day Outlook
Daily Pivots: (S1) 0.9979; (P) 0.9997; (R1) 1.0033; More...
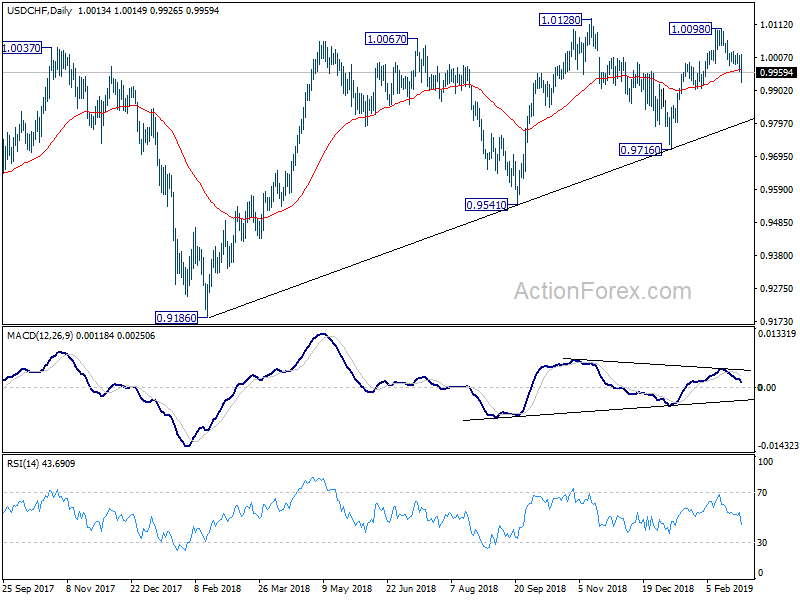
USD/CHF's fall from 1.0098 extends to as low as 0.9926 so far today. Intraday bias remains on the downside for 61.8% retracement of 0.9716 to 1.0098 at 0.9862. We'd look for bottoming signal again below there. On the upside, break of 1.0014 minor resistance will suggests that the pull back from 1.0098 has completed. In this case, intraday bias will be turned back to the upside for 1.0098/0128 resistance zone.

In the bigger picture, USD/CHF drew strong support from medium term trend line and rebounded. That suggests rise from 0.9186 is still in progress. Further break of 1.0128 will confirm up trend resumption and target 1.0342 key resistance. Nevertheless, break of 0.9716 will dampen this bullish view and at least bring deeper fall to 0.9541 key support.
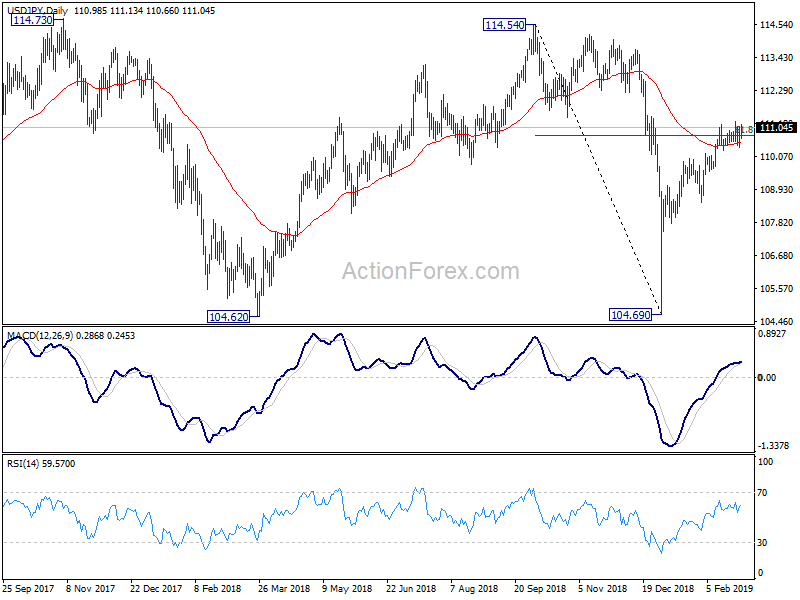
USD/JPY Mid-Day Outlook
Daily Pivots: (S1) 110.53; (P) 110.81; (R1) 111.26; More...
USD/JPY rebounds notably in early US session but it's staying in range of 110.25/111.23, intraday bias remains neutral first. On the upside, decisive break of 111.23 will firstly confirm resumption of whole rebound from 104.69. Secondly, that will indicate strong support from 55 day EMA, and likely firm break of 61.8% retracement of 114.54 to 104.69 at 110.77 too. In that case, further rise should be seen back to 114.54 key resistance next. On the downside, though, break of 110.25 minor support will suggest rejection by 110.77. And in that case, the rebound from 104.69 has likely completed. Intraday bias will be turned back to the downside for 108.49 support for confirmation.
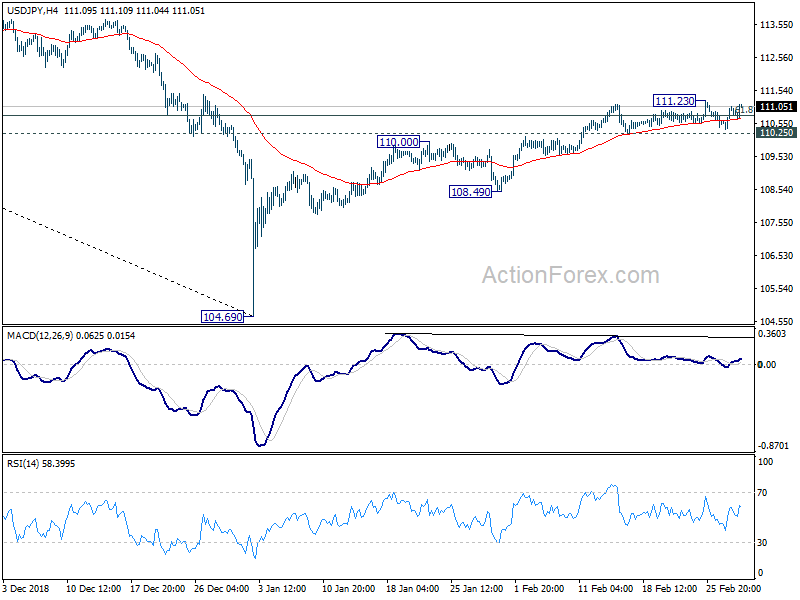
In the bigger picture, while the rebound from 104.69 was stronger than expected, it's struggle to get rid of 55 day EMA completely. Outlook is turned mixed first. On the downside, break of 108.49 support will revive that case that such rebound was a correction. And, larger down trend is still in progress for another low below 104.62. But sustained trading above 55 day EMA will turn focus to 114.54. Decisive break there will confirmation completion of the decline from 118.65 (2016 high).