Sample Category Title
Elliott Wave View: Short Term Bullish In Alibaba
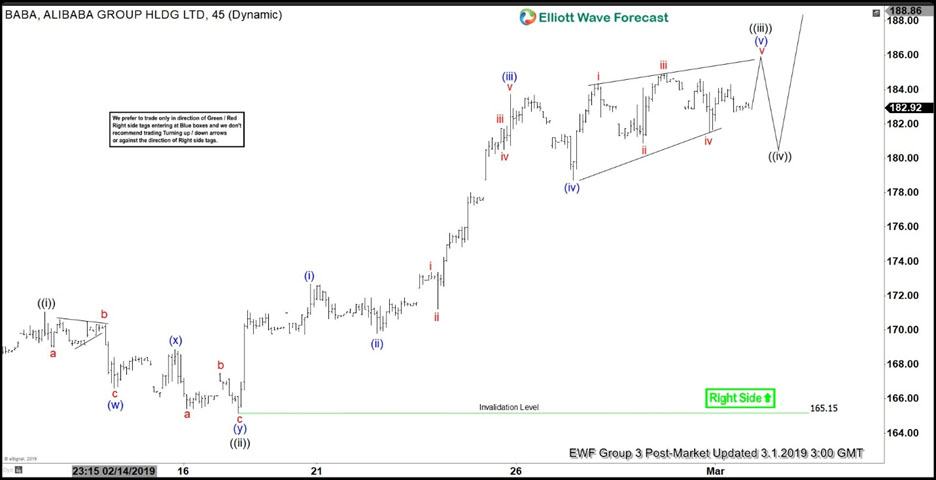
Short Term Elliott Wave view in Alibaba is bullish with the rally from February 8, 2019 low ($163.58) unfolding as an impulse. Furthermore, the cycle starting from January 23, 2019 low has not reached 100% target, thus still favoring further upside. Near term, rally from Jan 23 low to $171.05 ended wave ((i)) and pullback to $165.14 ended wave ((ii)). Wave ((iii)) is currently in progress and the subdivision is also an impulse structure of lesser degree.
Up from $165.14, wave (i) ended at $172.68, wave (ii) ended at $169.8, wave (iii) ended at $183.72, and wave (iv) ended at $178.71. Wave (v) is unfolding as an ending diagonal and we can see 4 overlapping waves already forming within wave (v). Another leg higher is expected before ending wave (v) of ((iii)). The stock should then pullback in wave ((iv)) to correct cycle from Feb 19, 2019 low in 3, 7, or 11 swing before the rally resumes. Potential target to the upside is 100% – 123.5% Fibonacci extension from Jan 23 low which comes at $186.55 – $191.95. As far as pivot at $165.15 stays intact, favor more upside in Alibaba in near term.
1 Hour Crude Alibaba (BABA) Elliott Wave Chart
AUD/USD And NZD/USD Could Extend Losses
AUD/USD failed to break the 0.7200 resistance and declined sharply. Similarly, NZD/USD is under pressure and it recently broke the 0.6840 support level.
Important Takeaways for AUD/USD and NZD/USD
- The Aussie Dollar declined recently and broke the 0.7160 and 0.7150 supports against the US Dollar.
- There is a major bearish trend line in place with resistance at 0.7120 on the hourly chart of AUD/USD.
- NZD/USD started a major slide it failed to move above the 0.6900 resistance level.
- There is a crucial connecting bearish trend line formed with resistance at 0.6850 on the hourly chart.
AUD/USD Technical Analysis
This past week, the Aussie Dollar traded higher and broke the 0.7120 and 0.7150 resistance levels against the US Dollar. The AUD/USD pair even broke the 0.7180 resistance, but it faced a major hurdle near the 0.7200 area.
The pair traded as high as 0.7196 on FXOpen and later started a major downside move. Sellers gained pace and pushed the pair below the 0.7150 and 0.7120 support levels. The decline was such that the pair even broke the 0.7100 support level and the 50 hourly simple moving average.
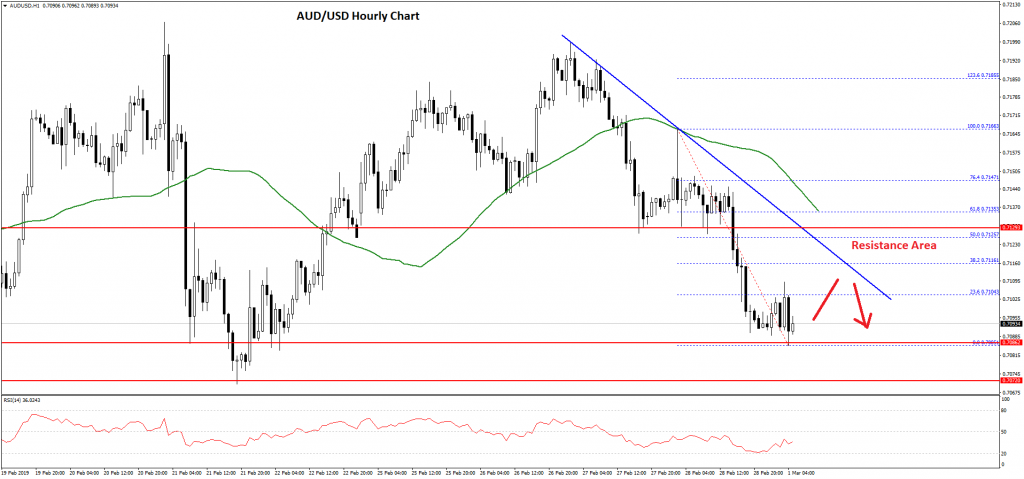
A low was formed at 0.7085 and the pair is currently consolidating losses. An initial resistance is near 0.7110 and the 23.6% Fib retracement level of the recent decline from the 0.7166 high to 0.7085 low.
On the upside, there are many resistances near the 0.7120 and 0.7130 levels. There is also a major bearish trend line in place with resistance at 0.7120 on the hourly chart of AUD/USD.
Besides, the 50% Fib retracement level of the recent decline from the 0.7166 high to 0.7085 low is near the 0.7125 level. Therefore, the pair must break the 0.7120 and 0.7125 resistance levels to move into a positive zone.
On the other hand, an initial support is at 0.7085, below which the pair may perhaps continue to decline towards the 0.7070 and 0.7050 support levels.
NZD/USD Technical Analysis
The New Zealand Dollar also followed a similar pattern and started a major decline from well above the 0.6880 level against the US Dollar. The NZD/USD pair broke the 0.6870 and 0.6850 support levels to move into a bearish zone.
The pair broke the 0.6820 support and the 50 hourly simple moving average. It traded close to the 0.6800 support level and formed a low at 0.6796.
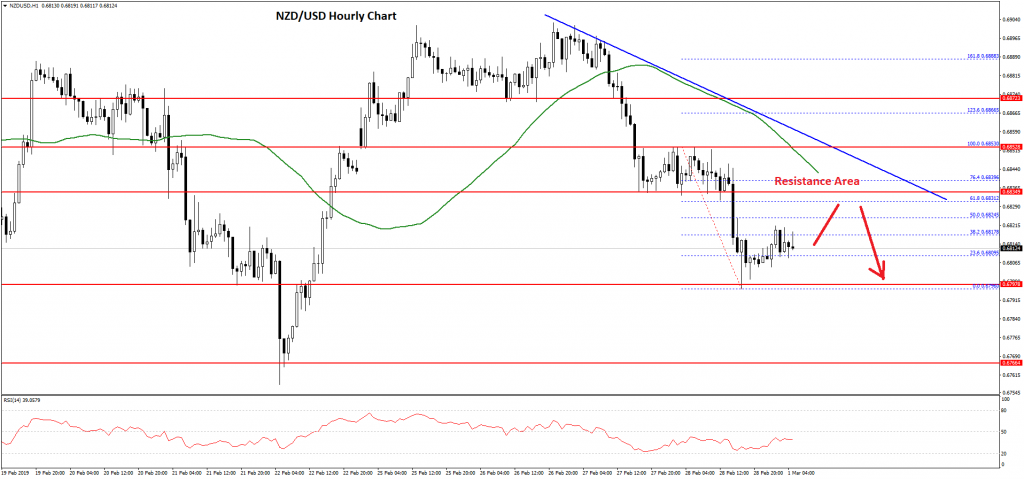
Later, the pair started a short term upside correction and tested the 38.2% Fib retracement level of the recent decline from the 0.6853 high to 0.6798 low. On the upside, there are many hurdles for buyers near the 0.6830 and 0.6840 levels.
There is also a crucial connecting bearish trend line formed with resistance at 0.6850 on the hourly chart. The 50% Fib retracement level of the recent decline from the 0.6853 high to 0.6798 low is also near 0.6825 to act as a resistance.
Therefore, the pair is likely to face a lot of hurdles on the upside near the 0.6825-0.6835 zone. On the downside, the 0.6800 level is a strong support. If there is a bearish break below the 0.6800 support, the pair could decline sharply towards the 0.6760 and 0.6750 support levels.
Market Morning Briefing: USDCNY Has Risen From Immediate Support Just Below 6.68
STOCKS
The upmove in equities seems to have taken a break. Dow and Shanghai look vulnerable for a corrective fall while the DAX and Nikkei are consolidating within the overall uptrend. The Indian benchmark indices, the Sensex and Nifty 50 also remains under pressure and has a crucial support coming up near current levels.
Dow Jones (25,916.00, -69.16, -0.27) has been continuing to move down as expected. As mentioned yesterday, a test 25,750 is possible while the Dow remains below 26,000.
DAX (11,515.64, +28.31, +0.25%) dipped below 11,440 but has bounced-back again. The index seems to be consolidating between 11,400 and 11,550. While above 11,400 a rally to 11,750 and 11,800 cannot be ruled out in the coming days.
Nikkei (21,574.51, +189.35, +0.89%) is oscillating around 21,500. A strong close above 21,500 today will leave the doors open for a test of 21,950-22,000 next week. Key support is at 21,400.
Shanghai (2,945.87, +4.91, +0.17%) continues to trade below 3,000 and remains vulnerable for a corrective dip to 2,900-2,880 in the near term.
Sensex (35,867.44, -37.99, -0.11%) and Nifty 50 (10,792.50, -14.15, -0.13%) continues to trade under pressure. They can dip to test their crucial supports at 35,730 (Sensex) and 10,750 (Nifty). A break below these supports can drag Nifty to 10,680 or 10,620 and the Sensex to 35,435.
COMMODITIES
Gold and Silver has dipped as expected and are coming closer to key supports. A bounce in the coming days is possible while these supports hold. Copper is consolidating within its uptrend. Oil is holding higher and can move up to test a key resistance.
Gold (1314) has come-off from the day's high around 1327 and is likely to test 1310 as expected. Though a break below 1310 can drag it to 1300, a further fall below 1300 could be difficult as fresh buyers may come in the 1300-1295 region and limit the downside.
Silver (15.60) is trading around the key 15.60-15.5 support zone. A bounce from the 15.5-15.0 region can take silver higher again to 15.8 and 16 in the coming days. A break below 15.5, though less likely, can take the prices lower to 15.4 and 15.3
Copper (2.95) is consolidating between 2.93 and 2.98 over the last few days. A break above 2.98 can test 3.0 and 3.02. On the other hand, a break below 2.93 can trigger a corrective fall to 2.90 and 2.88.
WTI (57.4) has been inching higher as expected to test 57.5-58. A break above 58 can take it to 59 and 59.5. But a pull-back from 58 can drag it to 56 and 55.5
Brent (66.5) remains stable above 66. The near-term outlook remains positive for a test of 67.5-68. As mentioned yesterday, a range-bound move between 64 and 68 can be seen for some time. Within this range, the bias is bullish to see a break and rise above 68 targeting 70 in the coming weeks.
FOREX
Dollar-Index (96.28) is stable but while below 96.30, there is scope for a fall towards 95.50-95.00 in the near term. Else the current bounce if sustains could take it back to re-test 97.0-97.30 levels. There is no directional clarity for the medium term just now while overall broad range of 97-95 is likely to hold for some more time.
Euro (1.1366) tested 1.1420 yesterday before coming off from there. While the resistance holds, Euro could dip back towards 1.1320/00 in the near term. Looking at the weekly candles there is room on the downside towards 1.11. Could this indicate a rise in Dollar Index towards 97 or higher? Probably.
Euro-Yen (126.97) has moved up as expected and is testing resistance at 127. There are two important resistances above current levels one at 127 and the other at higher levels of 127.60. This seems likely to hold in the near term with a possible corrective dip to 126-125 levels in the medium term.
Dollar Yen (110.86) has taken support from the 21-day MA near 110.35 and since has been moving up for the past 3-sessions. Important resistances are coming up at 112.0-112.5-113.0 levels. We expect 112 to hold on first testing before a rise towards 112.5-113.0 is seen in the longer term.
Pound (1.3258) has come off from 1.335 and could head towards support at 1.32 from where a bounce back to 1.35/1.36 is possible as seen on the weekly charts.
Aussie (0.7089) is trading at crucial levels just now and unless a bounce from here itself is seen, it would be vulnerable to a fall towards 0.70-0.6950.
USDCNY (6.6958) has risen from immediate support just below 6.68. There is room on the upside towards 6.72/74 for the near term. A fall below 6.68 if seen again would take it down to 6.65.
Dollar Rupee (70.73) came down sharply yesterday but this could be news driven (that Pakistan will return the Indian wing commander today, calling for peace). We need to see if the fall sustains below 70.60 today. Only if the fall sustains can we look at a possible test of lower levels targeting 70.20. Else we could see a bounce back towards 70.80-71.00 today which could shift the earlier 71.50-70.80 range to 70.60-71.25 now. We would keep a close watch on the movement today and next week.
INTEREST RATES
The US yields have risen well. The 2Yr (2.51%), 5Yr (2.52%), 10Yr (2.72%) and 30Yr (3.08%) are up from 2.48%, 2.47%, 2.67% and 3.05% respectively. The rise came in after the US Q4 GDP came out at 2.6%. The rise in the 30YR could be limited to 3.10% while the 10Yr could face rejection from 2.73% or higher from 2.80% levels.
The US-JGB 10Yr (2.74%) has risen sharply and could rise further to test 2.78%. This could pull up Dollar-Yen in the near term.
The UK-US 10YR (-1.55%) is coming off from -1.53%. An initial dip towards -1.58% is possible before rising back towards -1.50%.
The German-US 10YR (-2.54%) is trading along important near term support and could move up in the near term towards -2.49%. Failure to bounce back from current support could take it higher to -2.58%.
The 10Yr GOI (7.5907%) almost tested 7.70% before coming off from there. While we expect 7.55% to hold on the downside, we could see another attempt of rising towards 7.65% in the near term.
China’s February PMI Sent Mixed Message. Update on PBOC’s New Tool to Stimulate Economy
The official manufacturing PMI data, published by the National Bureau of Statistics, slipped -0.3 point to 49.2 in February. The market had anticipated no change from the prior month. This shows that large corporations in the sector, staying in contraction for three months in a row, has been in the worst condition since February 2016. The freshly released reading by Markit /Caixin, focusing on small and medium firms, surprisingly rose to 49.9, from January's 48.3. This has beat consensus of 48.5.
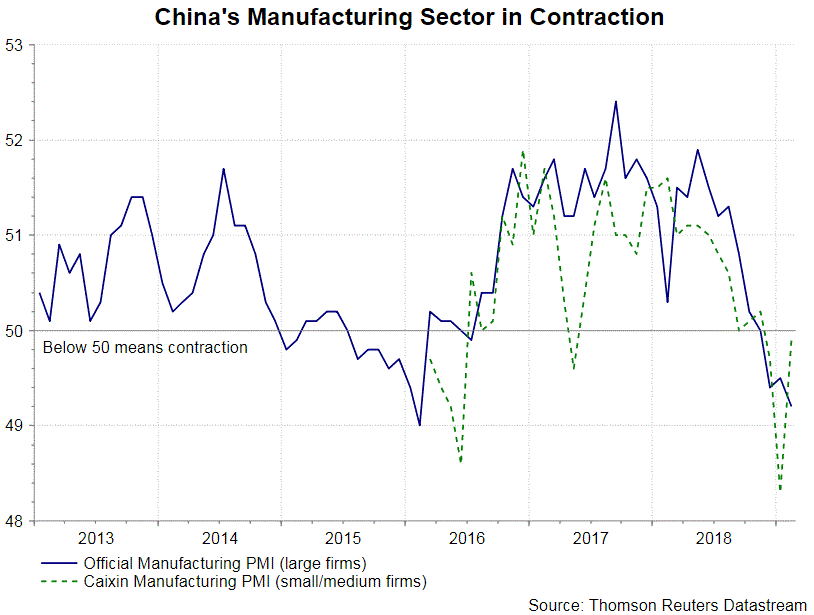
Markit/ Caixin appears positive over the development, noting that the report pointed to "an easing of the economic downturn". It suggested that the "new orders" and "output" sub-indices "returned to expansionary territory".This probably signaled improvement in domestic demand. Meanwhile, it also pointed to the strong new exports order, with the sub-index hitting its second highest level since March 2018. This shows that "foreign demand was not deteriorating as quickly as last year". The report also added a positive note that "selling prices increase for first time in four months".
Note, however, that the February data is likely distorted by seasonal factors - the week long Lunar New Year holiday. Meanwhile, in addition to the "double-11" festival in November, Western Valentine's Day on February 14 and the Lantern Festival on February 19 this year are periods for big spending in the country. these might have inflated "new orders" and selling prices.
Update on PBOC's Central Bank Bill Swap
We remain cautions in China's economic outlook. As mentioned in the previous report, we expect the People's Bank of China (PBOC) to accelerate the effort to stimulate the economy through various forms of monetary easing measures. Apart from usual measures it has been using (reverse repo, RRR cut), the central bank kick off a new instrument - central bank bill swap - last week. The ultimate goal of the instrument is raise commercial banks' capability to lend. The central bank swapped RMB 1.5B of 1-year central bank bills for perpetual bonds with a coupon of 2.45%. So far, the Bank of China has issued RMB 40B worth of perpetual bonds.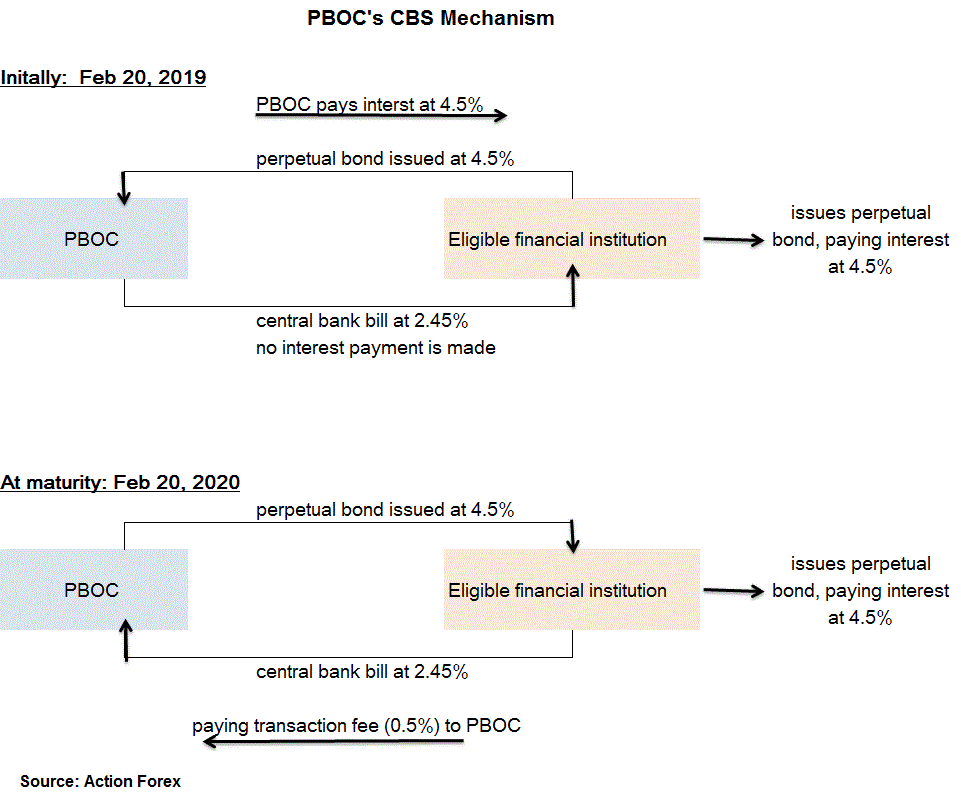
Daily Markets Broadcast
Wall Street edges lower despite above forecast GDP data
GDP growth data beat economists’ estimates in the fourth quarter, but the improvement failed to prevent a slide on Wall Street. PMI readings feature heavily on the data calendar, with both German and Eur-zone numbers seen at multi-year lows.
US30USD Daily Chart
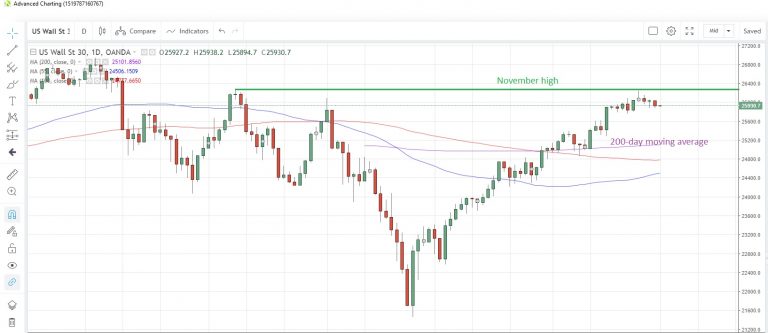
The US30 index declined yesterday but failed to take out Wednesday’s low, which might suggest today may be an uneventful day
Resistance at the November high of 26,249 remains intact. Support may be found at the 200-day moving average at 25,101
The ISM manufacturing PMI for February could be the highlight on the US data calendar. It rebounded in January, but this month’s print is expected to ease off to 55.5 from 56.6, the latest survey shows.
DE30EUR Daily Chart
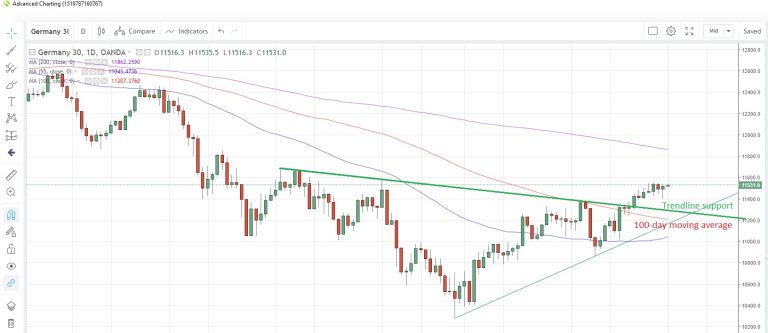
The Germany30 index edged higher yesterday, keeping within a tight 11,399-11,558 range so far this week
The index is still struggling to overcome the December high at 11,571. Trendline support may be found near the 11,292 level today, with the 100-day moving average below at 11,207
Final Markit PMI readings for February are due today, with no revision to initial readings expected for the manufacturing PMI for Germany at 47.6 (lowest since December 2012) and the Euro-zone at 49.2 (lowest since June 2013).
UK100GBP Daily Chart
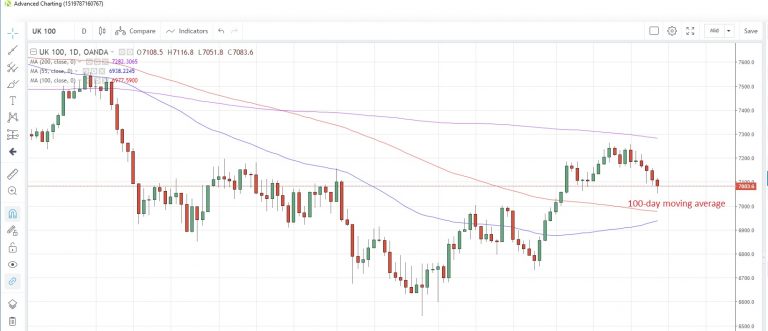
The UK100 index fell for a fourth straight day yesterday, the longest losing streak since late-January, as Brexit uncertainty continues to weigh ahead of key Parliamentary votes later this month
The index fell to a more than three-week low and is possibly eyeing the 100-day moving average at 6,977
Markit’s manufacturing PMI reading for February is seen slipping to 52.0, the weakest in four months, from 52.8 in January. UK govt says Brexit talks with EU ongoing; aiming to ensure that it cannot be held in backstop indefinitely. EU’s Barnier reiterates will not re-open the Withdrawal Agreement for negotiation.
USD/JPY In Significant Uptrend Above 111.00
Key Highlights
The US Dollar climbed higher and broke the 111.00 resistance against the Japanese Yen.
There is a crucial bullish trend line in place with support at 110.60 on the 4-hours chart of USD/JPY.
The US GDP in Q4 2019 grew 2.6% (Prelim), better than the forecast 2.3% forecast.
The US ISM Manufacturing Index for Feb 2019 will be released today, which could decline from 56.6 to 56.2.
USDJPY Technical Analysis
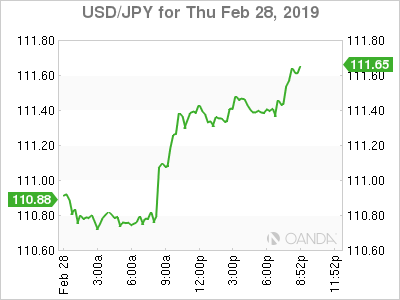
After a downside correction, the US Dollar found support near 110.35 against the Japanese Yen. The USD/JPY pair started a fresh bullish wave and traded above the key 111.00 resistance.
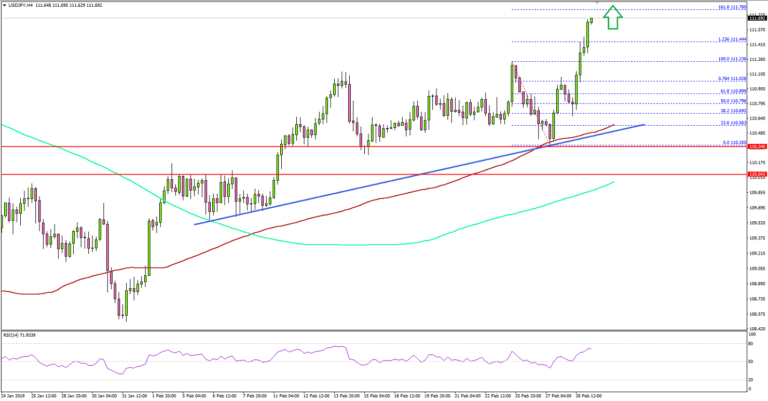
Looking at the 4-hours chart, the pair declined from the 111.23 swing low and traded below the 110.50 support. However, the 110.35 level and the 100 (red) simple moving average (4-hours) acted as a strong support and prevented further losses.
More importantly, there is a crucial bullish trend line in place with support at 110.60. The pair bounced back recently above the 110.60 level and the 76.4% Fib retracement level of the last decline from the 111.23 high to 110.35 low.
The pair even climbed above the 111.00 resistance and the 1.236 Fib extension level of the same wave. Therefore, the pair is likely gain momentum above the 111.50 swing high. The next resistance is close to the 112.00 level, above which the pair could rally towards the 112.20 level.
On the downside, the trend line, the 110.50 support, and the 100 (red) simple moving average (4-hours) hold the key. If there is a downside break below 110.50, the pair could correct lower towards the 110.00 support area.
Fundamentally, the Gross Domestic Product report for Q4 2018 (prelim) was released recently by the US Bureau of Economic Analysis. The market was looking for a 2.3% growth in the GDP, less than the last 3.4%.
The result was better than the forecast the US GDP grew 2.6% (according to the “initial” estimate), which was a lot less than the third quarter GDP (3.4%).
The report added that:
The deceleration in real GDP growth in the fourth quarter reflected decelerations in private inventory investment, PCE, and federal government spending and a downturn in state and local government spending.
The US Dollar gained bids after the release and EUR/USD plus GBP/USD corrected lower. Besides, USD/JPY remains supported on dips and it could rise further towards 112.00.
Economic Releases to Watch Today
- Germany's Manufacturing PMI for Feb 2019 – Forecast 47.6, versus 47.6 previous.
- Euro Zone Manufacturing PMI Feb 2019 – Forecast 49.2, versus 49.2 previous.
- UK Manufacturing PMI Feb 2019 – Forecast 52.0, versus 52.8 previous.
- Euro Zone CPI for Feb 2019 (YoY, Preliminary) – Forecast +1.5%, versus +1.4% previous.
- Euro Zone CPI for Feb 2019 (MoM, Preliminary) – Forecast +1.1%, versus +1.1% previous.
- US Personal Income for Dec 2018 (MoM) – Forecast +0.4%, versus +0.2% previous.
- US ISM Manufacturing Index for Feb 2019 – Forecast 56.2, versus 56.6 previous
- Canadian Gross Domestic Product for Q4 2018 (Annualized) – Forecast +1.4%, versus 2.0% previous.
GOLD Remains Vulnerable With Eyes On Key Support At 1,302.00 Zone
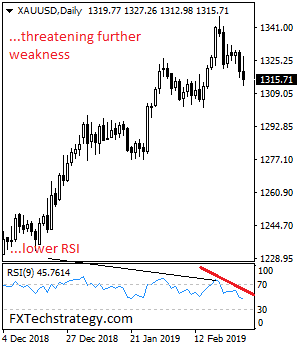
GOLD remains vulnerable with eyes key support at 1,302.00 zone. On the downside, support comes in at the 1,310.00 level where a break will turn attention to the 1,300.00 level. Further down, a cut through here will open the door for a move lower towards the 1,290.00 level. Below here if seen could trigger further downside pressure targeting the 1,280.00 level. Conversely, resistance resides at the 1,330.00 level where a break will aim at the 1,340.00 level. A turn above there will expose the 1,350.00 level. Further out, resistance stands at the 1,360.00 level. All in all, GOLD looks to move further lower on bear pressure.
Negativity Bias Overwhelms GDP And MSCI
Negativity bias overwhelms GDP and MSCI
Wall Street continued easing overnight despite better-than-expected US GDP data, with the S&P, Dow Jones and Nasdaq all closing down 0.30%. This extended the malaise in stocks that began in Asia yesterday following poor China and Japan data. President Trump calling a premature end to the North Korean summit in Hanoi had traders fretting that the US-China trade talks could end the same way. They could, but the two are entirely different beasts, and negativity is premature.
Wall Street should have been boosted by US GDP data that beat expectations with the economy growing at an annualised 2.90%, a number most developed economies can only dream of. The warm afterglow was short lived though as the quarterly number showed yet another fall for the third quarter in a row. This followed a pattern of slowing growth around the world, which started in China and Europe. This also further reinforces the recent trend of the world’s central banks pirouetting to an easing bias, led by the Federal Reserve.
As stocks wobbled on the US-North Korea summit and economic concerns, the street saw a rotation into safe-haven US dollars, which saw the greenback strengthen against both major and emerging market currencies.
It will be interesting to watch the reaction by Chinese stocks today as MSCI announced overnight they will be increasing their weighting in the MSCI market index to 3.30% throughout 2019. Selected China mid-cap stocks will also join, which has surprised markets expecting a heavyweights-only bout.
Due to be released at 0945 Beijing time, the Caixin China PMI Manufacturing data will be closely watched today following poor official figures yesterday, with a forecast of 48.7. The Eurozone CPI will follow before the week finishes with the US ISM and Manufacturing numbers. Given the general – and perhaps premature – malaise that has settled over equities, a low print on any of these numbers could have an outsized adverse effect on stocks and emerging-market FX today.
FX
The US dollar benefited from haven inflows overnight as the seas of red on the Asian and European stock markets prompted traders to reduce risk. USD/JPY rose to two-month highs and opened just shy of resistance at 111.50. Regional FX was on the back foot overnight, and with the anaemic Wall Street close, this could continue into the Asia session, mainly if the China data is weak. The fall-out from the Trump/Kim summit should be limited for the Korean won (and KOSPI) because South Korea is closed for a public holiday today.
Equities
Regional stock markets sank yesterday led by China and Japan’s poor numbers. With no help from Wall Street overnight, Friday’s opens are likely to be soft across Asia initially. In China, we will know soon enough whether the MSCI announcement was a buy the rumour, sell the fact, or bring fresh buyers to the market. The Caixin PMI data will likely overshadow MSCI; however, a negative print could bring new selling with it.
Oil
Brent Crude and WTI were almost unchanged overnight with a stronger dollar balancing supply concerns. Brent closed at USD66.25 a barrel and WTI at USD57.00 a barrel in a listless session. Both should trade quietly in Asia today consolidating the week’s gains and awaiting new impetus.
Gold
Gold had a volatile session trading in a USD10 range before ending the day USD5 lower at USD1,314.00 an ounce. A reduction in tension between India and Pakistan, a stronger dollar and declining but still respectable US GDP data combined to swipe the legs out from under the yellow metal. Gold’s critical support on the charts lies at 1,300.00 with longer-term liquidation possible should it fail. Gold could be supported in Asia though as traders reduce risk ahead of China data and the weekend.
Markets Struggle To Rally Despite A Better Than Expected GDP Report
US stocks struggled as markets processed improving economic optimism from the two largest economies in the world while battling geopolitical risks. The US economy grew at a better pace than what markets expected and China’s factory gauge fell to a 3-year low, but many feared worse as the data included a week long break from factory workers due to the Lunar New Year holiday. Positive trade banter from White House Economic Adviser Kudlow and Treasury Secretary Mnuchin attempted to support risk appetite, while four Fed members provided patient and cautious tones. The dollar traded modestly higher against most of its major trading partners, while US stocks drifted lower as trade concerns linger.
- US GDP – Economy still showing signs of strength
- Korea – Goodbye noble peace prize
- VIX – Poised to snap 9-week losing streak
- Oil – Bullish supply outlook continues to be ignored
- Gold – pullback continues on strong GDP report
GDP
The US economy performed better in the fourth quarter than what most economists expected. The last quarter of the year delivered 2.6% quarterly growth, down from 3.4% in third quarter but well above the analysts’ consensus of 2.2%. For the full year, real GDP increased 2.9%, just missing the President’s goal of 3.0%, but well above the 2.2% seen in 2017.
The strength in the September to December period came from robust consumer and business spending. Growth is expected to continue to slow as the effects of the Trump tax cuts are mostly done and risks of slower global growth remain.
The Fed will remain patient and it with economic growth and the labor market still showing strength, we may need to see a few months of deteriorating data for expectations to grow for the Fed’s next move to be a rate cut.
The US dollar rallied against the majority of its trading partners, while the 10-year Treasury yield rose to 3.1 basis points to 2.713%.
Korea
Talks on denuclearization with North Korea appear to be over now. As expected by most political experts, President Trump left Vietnam without an agreement with North Korea. Many Democrats feared he would settle on a poor deal and were pleased with the President’s decision.
President Trump claims he walked out on Kim Jong Un because he wanted all the sanctions lifted for the removal of their main nuclear facility in Yongbyon. North Korean officials are stating Kim requested to only have the sanctions lifted that were imposed in 2016 and 2017. Kim is said to have now lost the will continue talks. The economic pain in North Korea leaves the North Korean leader with little options, so he may aim to focus on strengthening their relationship with China.
VIX
The Cboe Volatility Index appears poised to snap a 9-week losing streak as geopolitical risks grow. Indian-Pakistan tensions along with US-China trade uncertainty have the volatility indicator approaching levels we saw right before the December swoon. As US stocks fail to make fresh highs, the path of least resistance could be lower and that could be accompanied with a surge in volatility.
Oil
Crude prices grinded higher on optimism the US economy remains on firm footing. The recent oil rally was supported by falling imports to the US and OPEC’s commitment to keep production cuts till year end.
Sanctions remain firmly in place as Venezuela’s presidential situation remains deadlocked. Venezuela’s opposition leader Juan Guaido is poised to return to Caracas this weekend despite threats he will be imprisoned. President Maduro is continuing to deny humanitarian aid into the country and there is no end in sight for his reign. The economic crisis is deepening each day and as sanctions increase, political violence will surge and pressure will grow on the military to disobey Maduro.
Gold
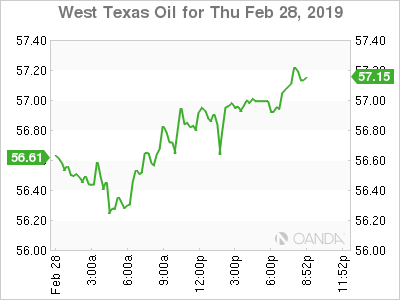
Gold’s slide continued after the US economy posted a better than expected GDP report. Weakness stemmed earlier from the de-escalation in tensions between India and Pakistan. The yellow metal is seeing the recent bullish trendline that began on November 13th tentatively break down.
Gold is not getting any help from better than expected US data and will likely need to see slower economic readings from China and Europe for the pullback to end.
USD/CAD Canadian Dollar Flat Awaiting Monthly GDP
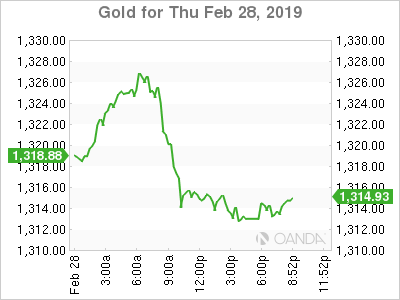
The Canadian dollar is flat against the US dollar on Thursday. The loonie is trading at 1.3158 ahead of the monthly GDP release to be published on Friday morning. The currency stood its ground versus the greenback despite disappointing data. The Canadian current account deficit was wider than expected and raw material prices were weaker than expected at 3.8 percent.
The Bank of Canada (BoC) will be one of the highlights of next week, but it’s not expected to raise its benchmark rate above 1.75 percent. The Fed pausing its rate hike path and global growth concerns, give the BoC some room for patience.
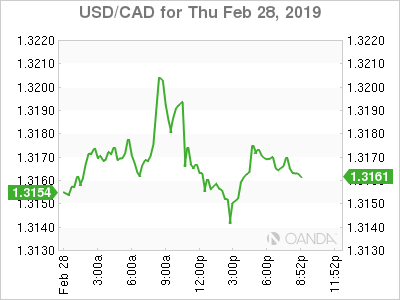
Oil prices were mixed as the North American benchmark rose still impacted by a surprise drawdown in weekly inventories in the US.
The resurgence of the US dollar and the potential downside risks for oil prices will put pressure on the Canadian dollar next week. Only a hawkish assessment of the economy by Governor Poloz could relieve some of that pressure, but a soft GDP data point could take that off the table.
The US dollar is higher against most major pairs. The greenback has appreciated against the GBP, JPY, NZD and AUD, but is flat against the CAD and has depreciated against the CHF and the EUR.
Gold Lower on Strong US Data and Higher Safe Haven Appeal of Swiss Franc
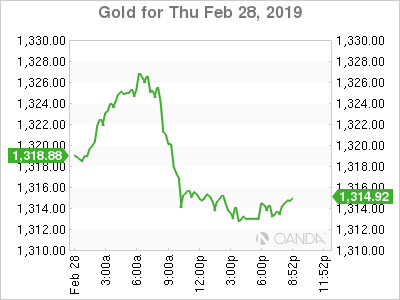
Gold fell 0.44 percent on Thursday after a strong US GDP and with India and Pakistan tensions easing with the expected release of an Indian fighter pilot reducing the appetite for the metal as a safe haven. Investors looking to hedge exposures went looking instead to the Swiss franc.
The resurgence of the US dollar was in part thanks to the first estimate of growth in the fourth quarter. The Q4 GDP capped a 2.9 percent growth for the US in 2018. While there are some dark clouds setting on the horizon for the US, the data dependant Fed could bring back at least 1 rate hike this year.
Mixed Global Economic Data Begets Mixed Crude Benchmarks
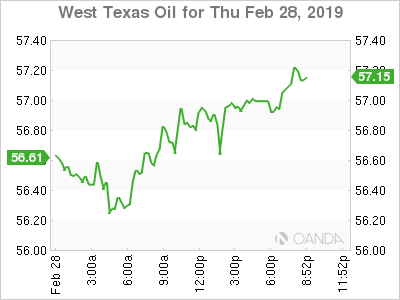
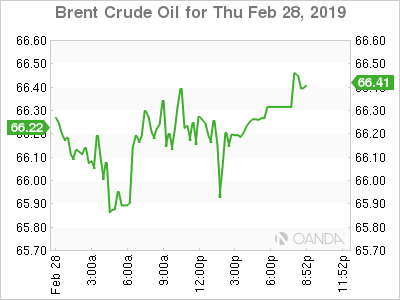
WTI rose 0.42 percent while Brent is flat after yesterday’s surprise drawdown in US weekly crude inventories and the Chinese factory activity dropped to a 3-year low. Oil stocks fell 8.65 million barrels when the market was expecting a rise of 2.8 million. West Texas Intermediate is still down 0.16 percent on a weekly basis with crude lower with a 1.18 percent loss.
US President Trump’s tweet warning OPEC to relax caused a massive drop in both benchmark, but as economic data in the US has remained strong with baked in demand for energy forecasted higher the American benchmark is closer to rebounding.
Saudi Arabia responded to Trump and no immediate change is expected as OPEC+ will continue to limit production seeking to stabilize prices.
The producers that are part of the agreement have given no signs that they are ready to reassume normal production, but there are concerns on how long they can keep limiting their revenue.
Despite positive trade news as the US and China appear near an agreement to end their tariff feud, there are still lots of unknowns on what the deal will look like. Global growth estimates have been slashed as the two largest economies engaged in a trade war.
Supply disruptions will continue to boost prices, but once those are priced in there is little to suggest global energy demand is on the mend, putting more pressure on crude going forward.
Slow Brexit News Day Gives Way to Profit Taking
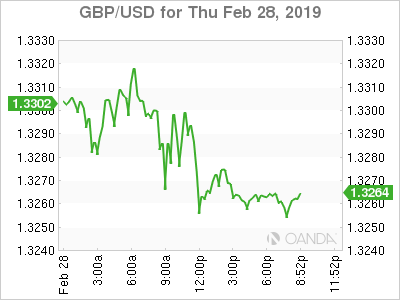
The pound lost 0.34 percent on Thursday, but so far this week the currency has advanced 1.63 percent on the back of higher chances of avoiding a no-deal Brexit. The lack of information brought about a bout of profit taking until there are more news to price into the currency.
European leaders have given strong hints that an extension could be in the cards, but as much as those comments have eased some concerns, they are merely delaying what now seems inevitable. All scenarios are still on the table, and they have the backing of certain groups that will fight to the end making the prospect of an orderly exit almost impossible.
Theresa May’s cabinet continues to lose members who disagree with her strategy putting into evidence the difficulty of reaching a compromise within the UK, let alone with the EU.
Swiss Franc Rises on Safe Haven Flows
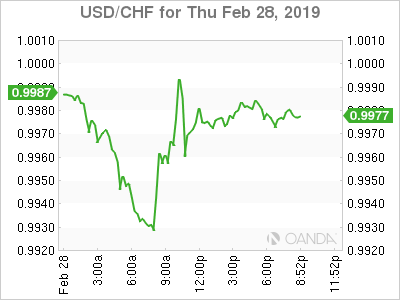
The Swiss franc rose 0.41 percent as investors were looking to the currency as a safe haven. Soft Chinese factory activity, tensions between India and Pakistan, the collapse of the US-North Korea summit and the lack of progress on the US-China trade negotiations are amplifying market anxiety.