

Sample Category Title
Westpac expects the RBA to cut the Cash Rate by 25bps in August and November
Westpac now expects the Reserve Bank to cut the cash rate by 25bps in both August and November this year.
We have revised down our GDP growth forecasts for 2019 and 2020 from 2.6% to 2.2%. With the slower growth profile we now expect to see the unemployment rate lift to 5.5% by late 2019. That makes a strong case for official rate cuts to cushion the downturn and, in turn, meet the RBA's medium term objectives.
The Reserve Bank recently revised down its growth forecasts for 2019 and 2020 from 3.25% and 3.0% to 3.0% and 2.75% respectively. It also cut its estimate for 2018 from 3.5% to 2.75%.
Momentum in 2018 slowed dramatically through the year. The annualised growth rate in the first half was 4% whereas in the second half we estimate that the pace slowed to 1.5%.
Moving from a 1.5% pace to a 3% pace in 2019 seems to be a very large stretch.
Westpac's growth forecast in 2019 and 2020 has been a much weaker 2.6% in each year but even that number now appears too high.
Our new forecast for GDP growth in 2019 and 2020 is 2.2%.
In particular, we have been expecting only a modest impact on consumer spending from the likely negative wealth effect associated with falling house prices in Sydney and Melbourne.
Our growth forecasts have assumed a lift in the savings rate across 2019 from 2.4% to 2.9%. That would be consistent with consumption growth of 2.4%. Note that we expect momentum in consumption growth in the second half of 2018 to be closer to 1.5%.
A more reasonable assessment of the lift in the savings rate in 2019 is from 2.4% to 3.5% with a lift towards 5.0% expected in 2020. Those savings rates imply consumer spending growth around 2%.
That lift assumes that house prices in Sydney and Melbourne will continue to fall through 2019. Our estimates of the need to restore affordability and the impact of tighter lending standards on prices point to falls of around 5%-10% in Sydney and Melbourne over the course of 2019 complemented by softness in other markets.
Absent any policy response from the RBA we expect that further falls will be necessary in 2020 before stability in these markets will be achieved.
These headwinds for the housing market and activity are also apparent in developments around credit. In the second half of 2018 new lending for housing fell by 14.9% with both investors (-15.5%) and owner occupiers (-14.7%) being affected. This is a sharper correction than we had anticipated. These falls are a combination of both demand (concerns around falling prices and stretched affordability) and supply (new regulations and caution from some lenders in a falling market).
We expect these falls, albeit at a much slower pace, to continue through 2019 representing a negative feedback loop to prices.
That negative wealth effect is therefore likely to persist through 2020 with a further extension of the soft profile for consumer spending.
Other important dynamics will be around the sharp downturn in residential housing construction. We have revised down our forecast for residential housing construction in 2019 to –10% from –7% and –5% in 2020 from –3%. We also envisage a weaker profile for business equipment investment as businesses adjust their plans to a softening growth environment.
Overall we have revised down our GDP growth rates in 2019 and 2020 from 2.6% in both years to 2.2% respectively.
Consumer spending; residential housing construction and equipment investment are all key to the outlook for jobs growth.
With reasonable estimates for the participation rate our weaker jobs growth profile has the unemployment rate lifting to 5.5% in the second half of 2019 and further by end 2020.
Our process for forecasting monetary policy has always been to assume that the economy will evolve as we expect and then to anticipate the policy response once the authorities react to the new reality.
The decision by the Reserve Bank Board to accept the possibility that interest rates could fall further, despite the current record low levels, is profoundly important.
We can now be confident that if our growth profile does evolve the Reserve Bank will be prepared to act. Prior to this more balanced approach to rates it was reasonable to assume that it was most reluctant to lower rates. The view seemed to be that the adjustment in the housing market was a necessary development with limited spill over effects on the rest of the economy.
Lowering rates, as we last saw in 2016, would only disrupt that adjustment while the rest of the economy was not in need of further stimulus.
The approach now seems to be that the spill over effects to the rest of the economy are real and the "adjustment" process may be more substantial than earlier anticipated. Certainly the collapse in new lending and sharp falls in house prices would be attracting considerable attention.
Note that the current view of the Reserve Bank is GDP growth of 3% in 2019; and 2.75% in 2020. That profile is, in their view, consistent with a gradual fall in the unemployment rate from 5.0% to 4.75% by end 2020.
The rise in the unemployment rate which we envisage through 2019 will not be severe since unit labour costs are contained and labour enjoys a relative cost advantage over capital. However it will be contrary to the Reserve Bank's expectations and prompt a significant revision to the 4.75% forecast for 2020.
When might this decision be taken?
The forces around a slowing economy, falling house prices, and weak consumer spending are already apparent. However the current forecasts do not indicate that the Bank expects these conditions to persist.
Recognition of this persistence is likely to take some time, but not too much time. Our preferred estimate would be the August Board meeting. A full explanation of the reasons behind the decision can be set out in the August Statement on Monetary Policy.
That timing will also allow two more inflation prints to confirm that the further widening of the output gap, as growth remains stuck well below trend, is constraining inflation with little likelihood of achieving the current forecast of 2.25% inflation in 2020.
A second cut at the November Board meeting is likely to follow.
Unlike the response of the markets in 2016 to two rate cuts we do not expect that these two cuts will immediately stabilise housing markets. However there will be sufficient progress for the Reserve Bank to resume its cautious stance.
Adjustments will also be accommodated by the Australian dollar, possibly in lieu of even lower rates.
Partially offsetting our weaker profile for the AUD will be more "patience" on the part of the Federal Reserve with the federal funds rate. Following my trip to the US over the last few weeks where I met with a number of officials and market participants it is clear that even if the Federal Reserve decides that higher rates will be necessary it will take considerable time to make the case.
Accordingly we have eliminated our forecast for hikes in the federal funds rate in June and September leaving one more hike in December to recognise the need to finally settle on the neutral rate setting.
The net impact of these forecast changes is for a further 25bp deterioration in the overnight cash rate differential. That puts downside risks to our current target of USD 0.68 for the AUD in the second half of 2019 particularly if the expected cuts from the Reserve Bank are ineffective in settling markets.
The Risks to This Rate Outlook
Housing markets may stabilise more quickly than we anticipate and the extended negative wealth effect may not materialise.
The labour market may hold up more strongly than we expect. ( note the January Employment Report showing 39,000 new jobs). Certainly evidence from other countries points to unusually strong labour markets despite other less constructive developments in these countries. A relative improvement in the cost of labour may hold up labour markets despite soft demand conditions. Unit labour costs in Australia have been flat for many years.
We may be overestimating the appetite of the RBA to respond to the environment we are describing.
Wages growth may lift more quickly than we expect, boosting household incomes and supporting spending despite a negative wealth effect. That lift may be supplemented by unexpected increases in the terms of trade as China boosts its own growth through housing and infrastructure. On the other hand while this is a perfectly reasonable scenario, there is still likely to be little flow through from higher commodity prices to household incomes as mining companies remain cautious. Mining wages continue to languish highlighting the limited effect a strong terms of trade has on the broader economy.
There is mixed evidence around wealth effects in other countries although the scale of the adjustment in house prices in Sydney and Melbourne is too large to downplay.
Conclusion
Since the last rate cut in August 2016 Westpac has consistently held the line that the RBA cash rate would remain on hold for the foreseeable future (a standard 2-3 year window). That has been despite markets, the RBA and most economists expecting higher rates.
To an extent this view was influenced by the perception that the Bank welcomed the adjustment in the housing markets and saw insignificant spill over effects to the rest of the economy.
The recent change of rhetoric from the Bank on that issue is important. Our revised growth, inflation and unemployment forecasts now make a convincing case for lower rates.
Daily Markets Broadcast
Wall Street edges higher after Fed minutes
US indices ended higher after a choppy session, boosted by sentiment in Europe and then when FOMC minutes showed an intention to halt its balance sheet trimming by late 2019. Australia had another stellar jobs report in January.
US30USD Daily Chart
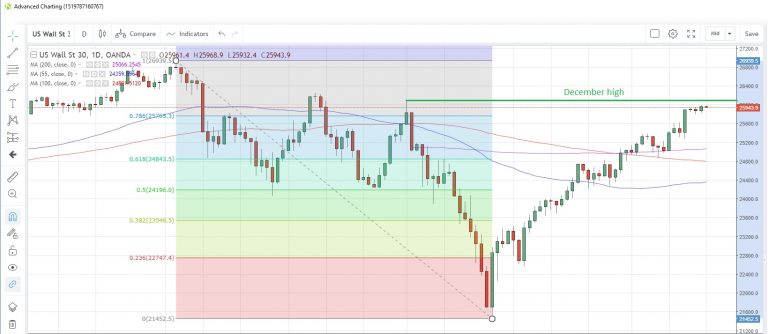
The US30 index edged higher to a fresh 2-1/2 month peak yesterday on the back of a relatively dovish tone to the minutes of the last FOMC meeting
The index touched the highest since December 3, though has still failed to cross above the psychological 26,000 mark. The December high was 26,082
It’s a busy data slate for the US, with delayed durable goods orders for December, flash Markit PMI readings for February and existing home sales for January all due. The manufacturing PMI will probably grab the most attention, seen easing to 54.7 from 54.9
DE30EUR Daily Chart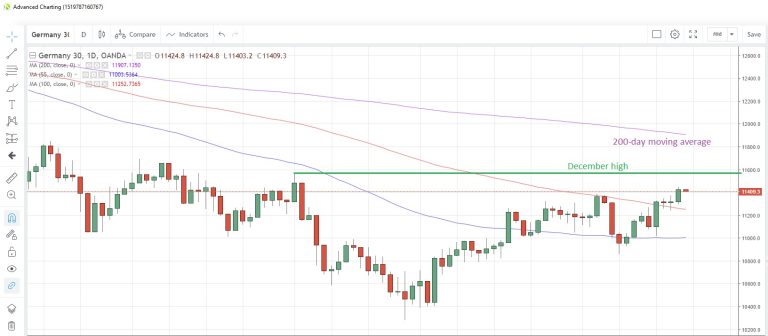
The Germany30 index powered ahead yesterday with the biggest one-day gain of the week.
The index moved to the highest level since December 4. The December 3 high of 11,571 could be the next resistance point.
German flash PMI data from Markit for February are expected to continue the softer trend, with the composite PMI edging down to 52.0 from 52.1.
AU200AUD Daily Chart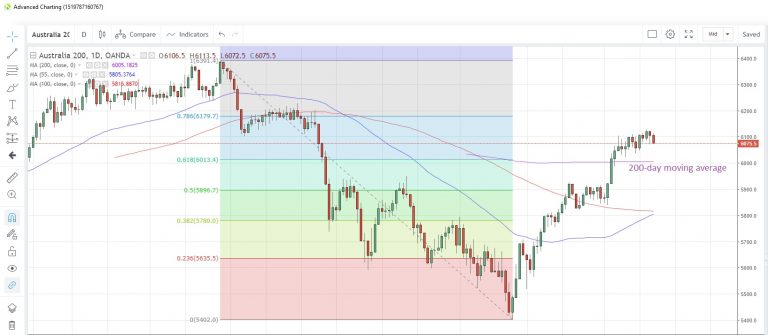
The AU200 index shrugged off a strong jobs report for January, retreating from 4-1/2 month highs for a second day
The 200-day moving average at 6,005 could act as the next support level
Australia added a net 39.1k jobs in January, but the details told an even stronger story. 65.4k full-time jobs were added with the loss of 26.3k part-time ones. Unemployment rate held steady at 5.0%, even with an uptick in the participation rate to 65.7%. It was a strong report, whichever way you slice or dice it.
FOMC Participants Debate Ending Balance Sheet Runoff in its Pivot to Patience
The minutes from the FOMC's January 29-30 meeting provided additional detail on the committee's pivot to "patience" as well as balance sheet "flexibility." With respect to the balance sheet, the consensus among the committee is that it can continue to conduct monetary policy "in an environment of ample reserves" and sees little need to stick to a program of balance sheet runoff.
Further to that point, "almost all participants thought that it would be desirable to announce before too long a plan to stop reducing the Federal Reserve’s asset holdings later this year." The FOMC will likely announce more details of its balance sheet plans in upcoming meetings.
The minutes offered several justifications for the move to a "patient approach to monetary policy" including waiting on additional data on consumer and business sentiment, understanding the persistence of lower inflation compensation (market-based expectations), evaluating the impact of the federal government shutdown, and international developments including trade policy and the apparent slowdown in European and Chinese growth.
Key Implications
The dramatic change in the Fed's monetary policy stance boils down to an assessment that uncertainty and downside risks to economic growth had increased (including from abroad), while upside risks to inflation had diminished.
The Federal Reserve has always intended for movements in its balance sheet to operate in the background with the federal funds rate its main policy tool. Still, while the Fed sees little evidence of its balance sheet impacting on its core policy instrument, it is cognizant of the fact that, even if misplaced, investor concern about balance sheet runoff can in itself tighten financial conditions. The move to flexibility and away from reserve scarcity is an attempt to take the focus off the balance sheet and put it back on the federal funds rate.
On that note, the case for any further increases in the federal funds rate lies in an expectation that the economy will continue to deliver above-trend growth and event risks will not throw it off its trajectory. In this kind of world, the FOMC will feel justified in nudging up the federal funds rate above the bottom of its "neutral range." Still, the onus is on inflation to prove that the current rate of policy is not the right one.
Fed Tries To Stay Ahead Of The (Yield) Curve
Fed tries to stay ahead of the (yield) curve
The Federal Reserve (FOMC) minutes passed with barely a flutter from markets overnight. Wall Street closed almost unchanged for the second day running, with currency and gold markets following suit. This week, the only game in town is the US-China trade talks with everything else relegated to B-team status.
The FOMC minutes signalled that the Fed would finish normalising its balance sheet by the end of the year. Interestingly, a dig through the text implies they would be prepared to hike rates if inflation accelerates and that the majority of governors judge rates to be neutral right here: i.e. no easing bias.
We would expect more of the same in Asia today with markets consolidating as the world holds its collective breath on the trade talks. There’s a lot of optimism baked into global markets on the outcome of the negotiations and precisely zero detail on the actual result. A sub-optimal outcome could make for a potentially ugly correction in equities and currencies in particular.
Regional highlights today are the Australian employment data this morning and an Indonesia rate decision this afternoon. We expect no movement on the latter as the central bank won’t rock the boat ahead of the Indonesian elections on 17 April.
FX
Both the euro and the pound gave back some of the previous day’s gains overnight as no Brexit breakthrough happened during PM May’s latest visit to Brussels. A glance across the major currencies against the dollar shows an almost unchanged scene versus the previous day, implying the FX markets are well and truly in wait-and-see mode.
Australia Employment data at 0830 Singapore should provide some short term volatility in the Australian dollar, but we expect this to be fleeting.
Equities
The S&P and Dow Jones closed higher by a tiny 0.2% for the second day running. This should be enough to signal a positive start to regional bourses, albeit not a very strong one. As I’ve said, there’s a lot of good news baked into equity prices regarding the trade talks. Stocks will be vulnerable to headlines and traders should stay nimble.
Gold
Gold popped higher to USD1,346 an ounce overnight before falling back to close at USD1,338. Risks around the trade talks have seen gold-buying from the get-go in Asia this morning with it trading gently higher to USD1,340.
he Relative Strength Index (RSI) technical indicator entered overbought territory implying some consolidation was on the cards after the recent rally.
Oil
Oil surged higher again overnight with Brent up 1.1% at USD67.20 a barrel and WTI climbing an impressive 1.5% to USD57.10 a barrel. Trade talk hopes, Saudi supply squeezes and Venezuelan disruptions were rolled out as the usual gang of excuses.
The RSI on both contracts is in overbought territory, implying at least a consolidation at these levels. Again, a lot of excellent trade talk news is baked into oil prices at these levels, and some caution would be well warranted.
Eco Data 2/21/19
[php_everywhere instance="1"]
US update: CAD strong as WTI oil breaks 57, Sterling flip-flops
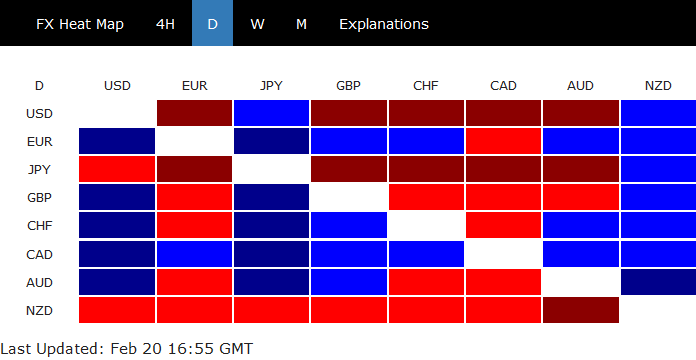
Canadian Dollar is the strongest one today, with the help from rally resumption in oil price. WTI breaks 57 handle and is now at around 57.4. Swiss Franc is the second strongest for today, followed by Euro. New Zealand Dollar, Yen and Dollar remain the weakest ones. The greenback will look into FOMC minutes to be released soon.
Stock markets are trying to extend recent rally but without much follow through momentum. There is no news regarding US-China trade talks, except that USTR will testify in the House Ways and Means Committee on Feb 27. Sterling was initially pressured on news that three Conservative lawmakers quit the party. But it then regained strength as Spanish Foreign Minister said an updated Brexit deal is being hammered out.
In US markets, currently:
- DOW is up 0.15%.
- S&P 500 is up 0.14%.
- NASDAQ is up 0.25%.
- 30-year yield is up 0.015 at 3.006, back above 3.0 handle.
In Europe:
- FTSE rose 0.69%.
- DAX rose 0.82%.
- CAC rose 0.69%.
- German 10-year bund yield dropped -0.0045 to 0.102, but defended 0.1 handle.
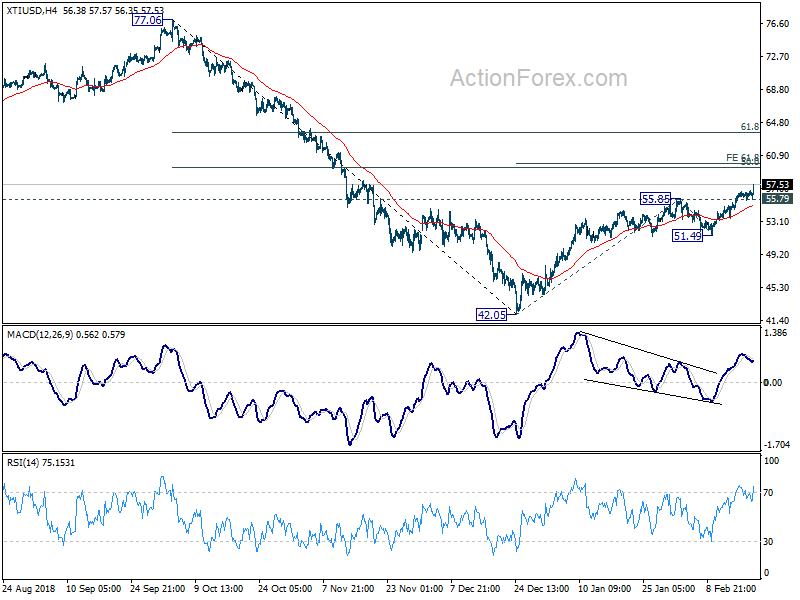
WTI crude oil resumes recent rally to as high as 57.57 so far. Further rise is now expected. But still, rise from 42.05 is seen as a corrective move. Hence, strong resistance will likely be seen around 61.8% projection of 42.05 to 55.85 from 51.49 at 60.01 to limit upside. That is is actually close to 50% retracement of 77.06 to 42.05 at 59.55. 55 week EMA (now at 59.60) is also in proximity.
Pound Rally Takes Pause, Markets Await FOMC Minutes
GBP/USD is unchanged in the Wednesday session, after posting sharp gains on Tuesday. In North American trade, the pair is trading at 1.3064, up 0.01% on the day. It’s a quiet day on the release front. The sole U.K. indicator, CBI Industrial Order Expectations rebounded with a score of 6, crushing the estimate of -5 points. There are no data indicators in the United States. On Thursday, the U.K. releases public sector net borrowing, with the markets expecting a rare budget surplus. The U.S. will release durable goods orders and unemployment claims.
It’s been an impressive rally for the British pound, as GBP/USD has jumped 2.0% since Friday. On Tuesday, the pair climbed to 1.3070, its highest level in two weeks. Investors were pleased with the January job numbers, as the U.K. labor picture remains rosy despite the pressures of the global trade war and the tensions around Brexit. Wage growth remains strong, posting a second straight gain of 3.4%, just below the forecast of 3.5%. The number of employed people continues to grow, and the unemployment rate remained pegged at just 4.0%. Consumer spending surged in January, as retail sales jumped 1.0%, its second strong gain in three months.
The Federal Reserve has turned dovish in 2019, after aggressively raising rates four times in 2018. If recent comments from Fed policymakers are a reliable indication, the minutes from the January policy meeting are also likely to be dovish in tone. The January rate statement discarded previous pledges of “further gradual increases” in interest rates, and said it would be “patient” before any further hikes. The current Fed projection calls for two rate hikes this year, but that is subject to change, based on the strength of the U.S. economy. The markets have priced in a hold on rates for the near-term, with little expectation of a rate hike in the first half of the year.
Spanish FM Borrell said updated Brexit agreement being hammered out
Sterling is lifted as Spanish Foreign Minister Josep Borrell was quoted saying that an updated Brexit agreement is already be hammered out. And the agreement could be ready before a summit in Egypt on Sunday.
Borrell said in an interview at the ministry's palace in Madrid "I think the accord is being hammered out now, without having to go to Sharm El-Sheikh to do it".
He added that "the EU's position is that the treaty won't be reopened, but can be interpreted, or complemented with explanations that may be satisfactory."
Gold Rips Higher Amid a Quiet Flight to Safety
Bullion prices continue to surge, ascending to fresh 10-month highs this week. Since the correlation between gold and the US dollar has diminished lately, it seems a flight to safety is quietly going on, amid global growth and recession concerns. Yet, for buyers to pierce above the elusive $1365 area, some more ‘fuel’ may be required, such as a fresh escalation in growth risks or a materially weaker dollar.
Gold has had an impressive run so far this year, rising by 4.7% in less than two months. The precious metal’s gains can be tracked back to two main factors: the Fed’s dovish pivot, and safe-haven demand as investors seek a hedge against a myriad of risks, with a slowdown in global growth topping this list.
Fed turnabout
Let’s start with the Fed, which in a surprising deviation from its earlier signals, recently announced it will hit the ‘pause button’ on future rate hikes while it monitors the health of the US economy. Rising interest rates typically hurt precious metals like gold, as the ‘opportunity cost’ of holding them increases. Remember that bullion not only pays no interest when holding it but also carries storage costs. Thus, as rates rise, other interest-bearing assets – like bonds – start looking much more attractive in comparison. In this logic, the Fed’s signal that it won’t raise rates any further, for now at least, increased the yellow metal’s appeal.
Seeking shelter
Then, there are the growth concerns and the flight to safety. Economic data have been losing momentum across the globe in recent quarters, from the US to China to the UK, though the weakness is perhaps most evident in the Eurozone. This has led both investors and policymakers to start considering worst-case outcomes, such as an outright global recession.
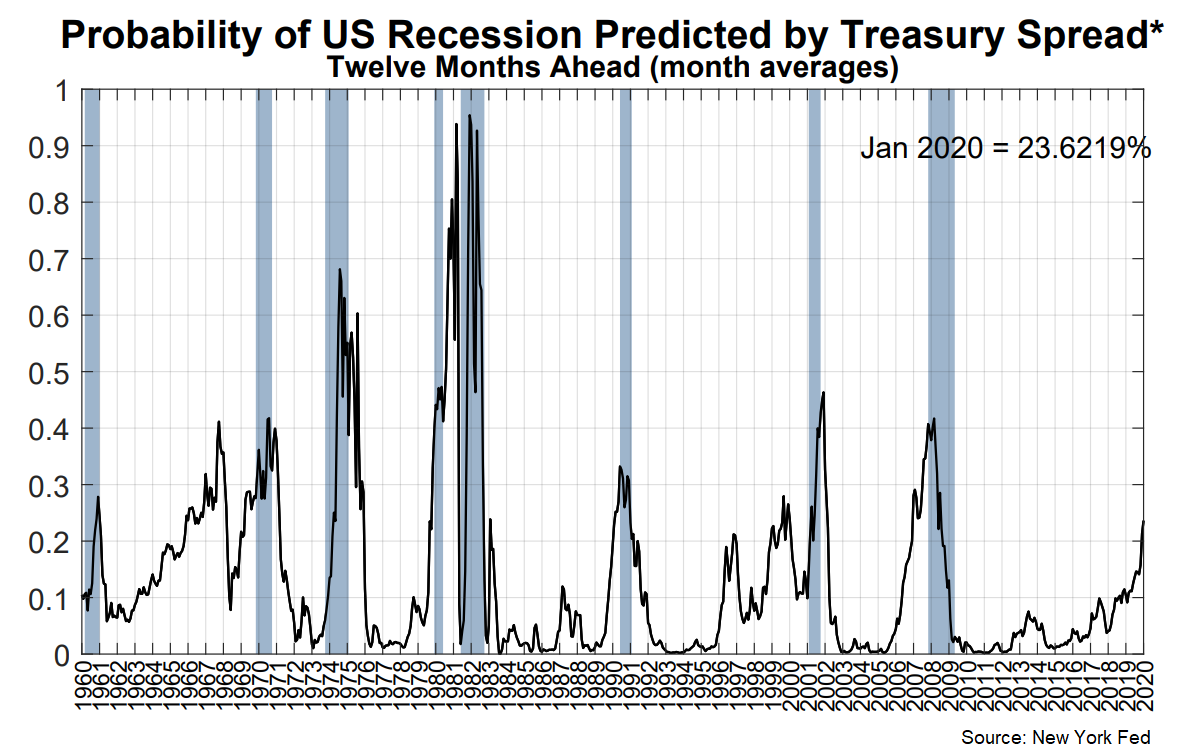
In fact, as pictured above, the probability for a US recession by early 2020 has been rising steadily recently and now rests at 23.6%, according to New York Fed models. Regardless of whether a slump will actually happen or not, the mere fact that expectations for a downturn are growing is enough to fuel demand for haven assets.
What makes gold’s winning streak particularly impressive, is that the US dollar index is also marginally higher year-to-date (+0.4%). Usually, these two assets have a strong negative correlation, meaning that when the greenback gains, gold loses – and vice versa. This stems from the fact that gold is denominated in dollars, so when the US currency strengthens, it becomes more expensive for investors using foreign currencies to buy bullion, dampening its demand.
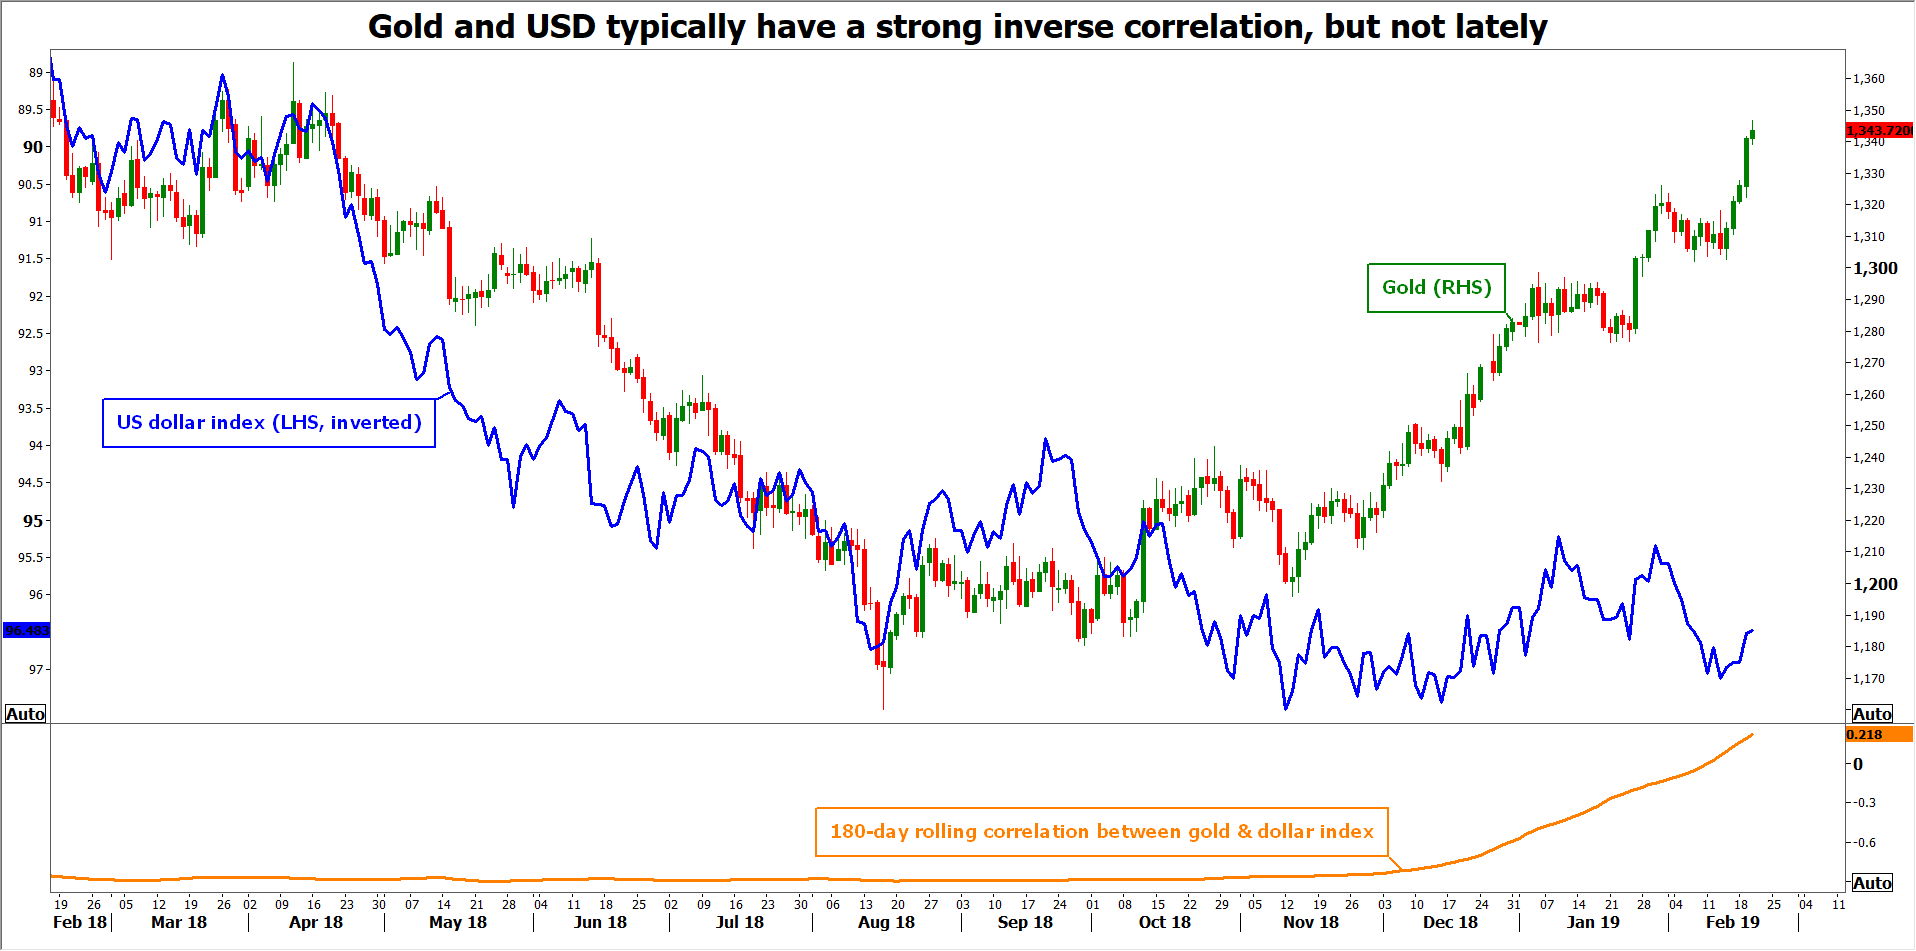
Therefore, gold has been outperforming this year even despite a slightly stronger dollar applying downward pressure on it. This fading correlation between the two confirms that investors are buying gold for reasons other than movements in the dollar, like increasing defensive exposure.
More fuel
While the medium-term outlook for gold is clearly positive, the speed and magnitude of the recent gains suggests some cause for caution, as most of the aforementioned risks are likely reflected in the price by now. This implies 1) that the risk of a corrective pullback in the immediate term may be elevated and 2) that for the bulls to break above the 2018 highs around $1365 in a sustainable manner, some fresh catalyst may be needed. Either a further escalation in market growth concerns, or a significant drop in the dollar, or both. Of course, there are several risks in the political arena that could also do the trick, the most notable being a disorderly Brexit.
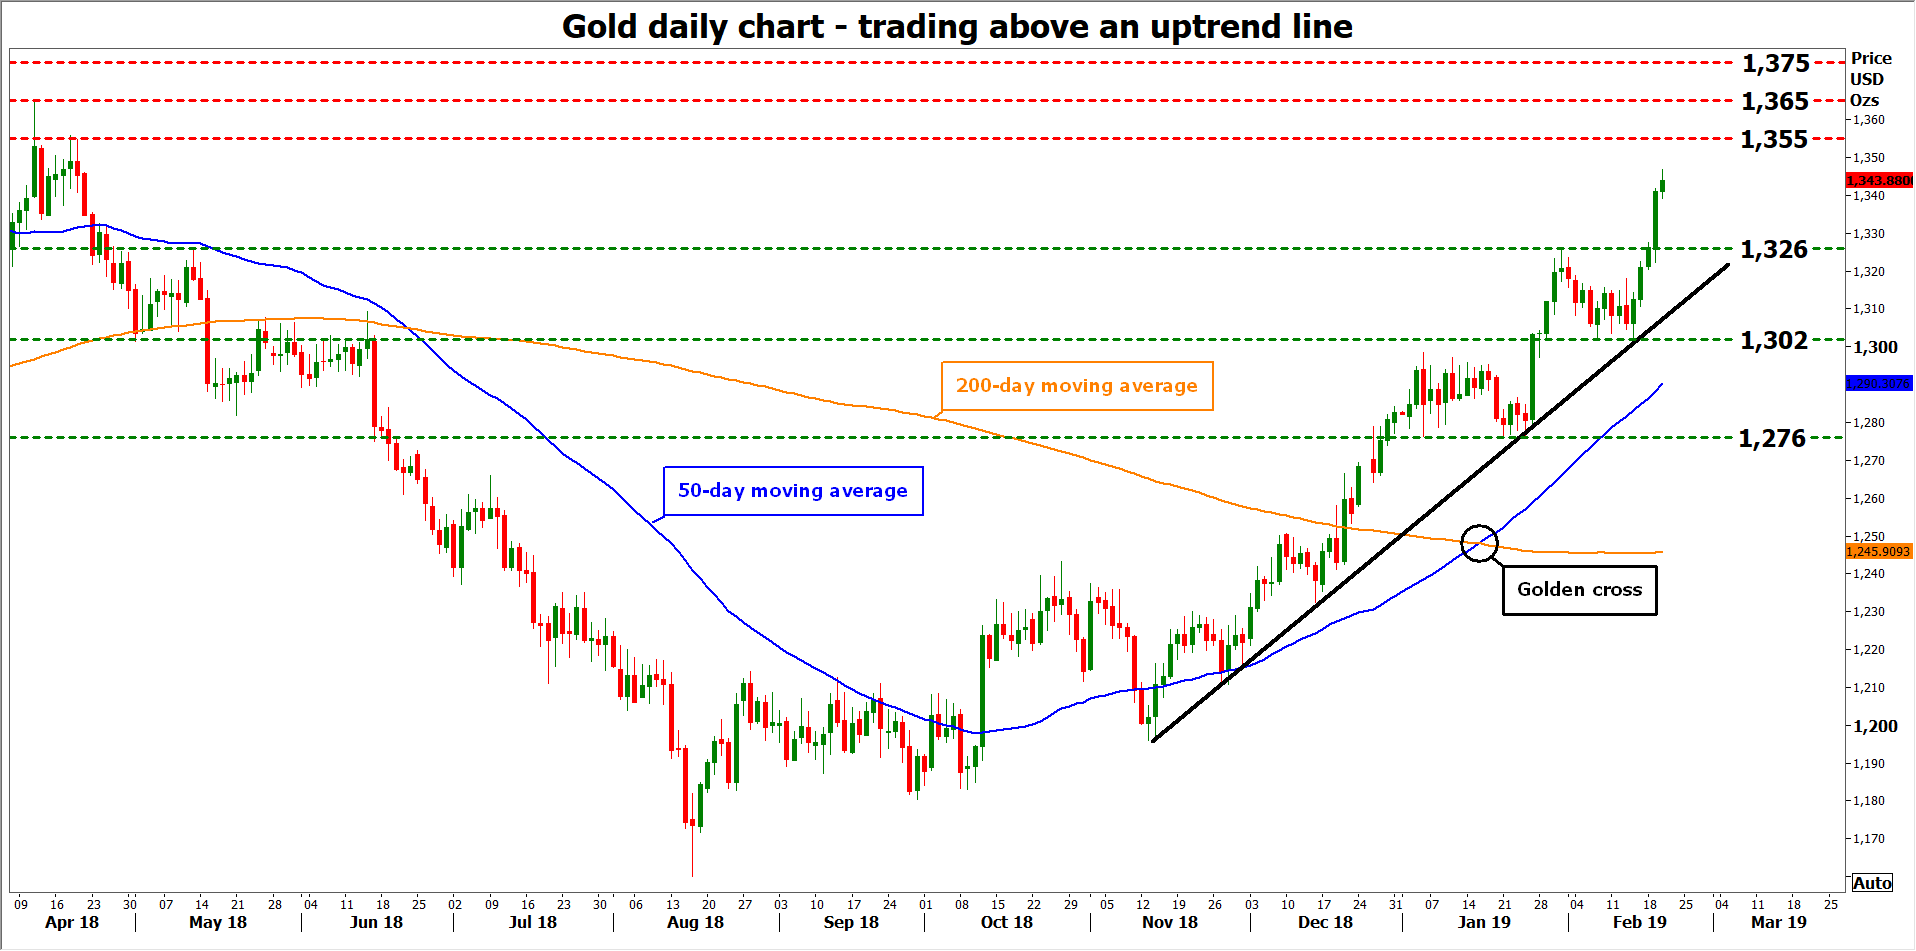
The technical picture is equally positive, as gold prices are posting higher highs and higher lows above a medium-term uptrend line drawn from the lows of November. Additionally, the 50-day simple moving average (SMA) has crossed back above the 200-day one, which is a bullish signal. Another wave of advances in prices could encounter resistance around the $1355 level, marked by the May 19 peaks. Even higher, the bulls could stall near $1365.
On the flipside, a corrective pullback may find immediate support at $1326, which halted the rally on January 31. A downside break would shift the attention to the crossroads of the $1302 zone and the aforementioned uptrend line. If the bears manage to violate that area too, that would shift the technical outlook back to neutral.
The Outlook for the Fed’s Balance Sheet: An Update
Executive Summary
In a two-part report we wrote last summer, we analyzed the assets and liabilities of the Fed's balance sheet to determine at what point it might stop reducing the size of its balance sheet.1 Our analysis found that the Fed would stop the process of "quantitative tightening" in late 2019/early 2020 when the balance sheet had receded to roughly $3.7 trillion, from a peak of $4.5 trillion in 2015. We concluded in that report that if the Federal Reserve continues to hold trillions of dollars of Treasury securities, then long-term interest rates on Treasuries likely would be a bit lower than they would be otherwise, everything else equal. We also wrote that if the Fed reverts to its pre-crisis policy of holding sizeable quantities of T-bills, then the yield curve would be a bit steeper than it would be otherwise, everything else equal.
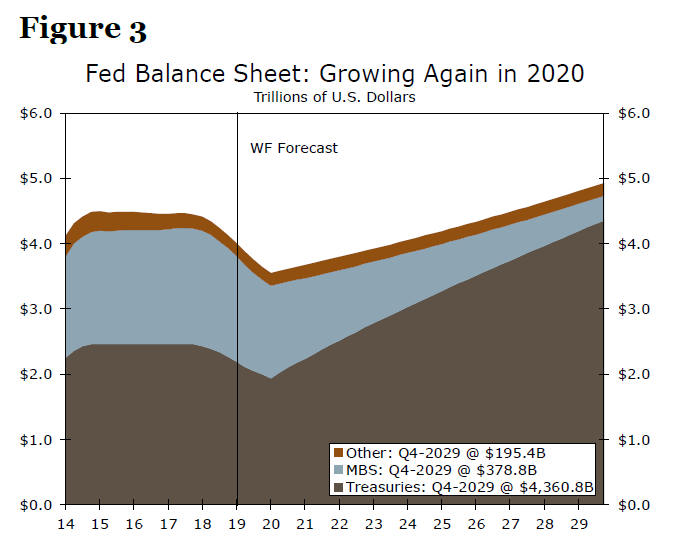
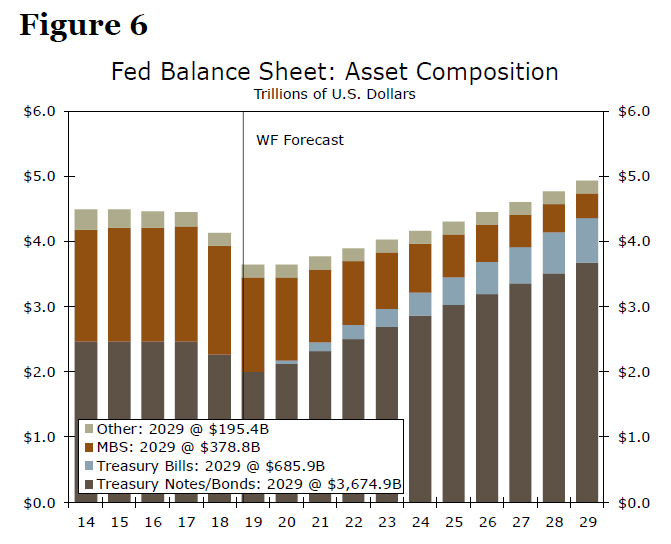
In this report, we update our previous analysis. We confirm our earlier finding that shrinkage of the Fed's balance sheet likely will stop at the end of 2019 at a terminal size of roughly $3.6 trillion, with about $1.1 trillion in excess reserves. We then extend our analysis by forecasting the size and composition of the Fed's balance sheet over the next 10 years. Starting next year, we expect the balance sheet to start growing organically again, eventually reaching $5 trillion in 2029. In terms of composition, we assume that mortgage-backed securities (MBS) continue to roll off indefinitely. As a result, in the near term, we expect the Fed's holdings of Treasuries to rise roughly $175 billion in 2020 and $280 billion in 2021, with T-bills comprising about $50 billion and $80 billion of those totals, respectively. Sizable Fed Treasury holdings and a return to the bill market likely mean lower Treasury yields and a steeper curve than would otherwise be the case.
Fed Balance Sheet to Start Growing Again in Early 2020
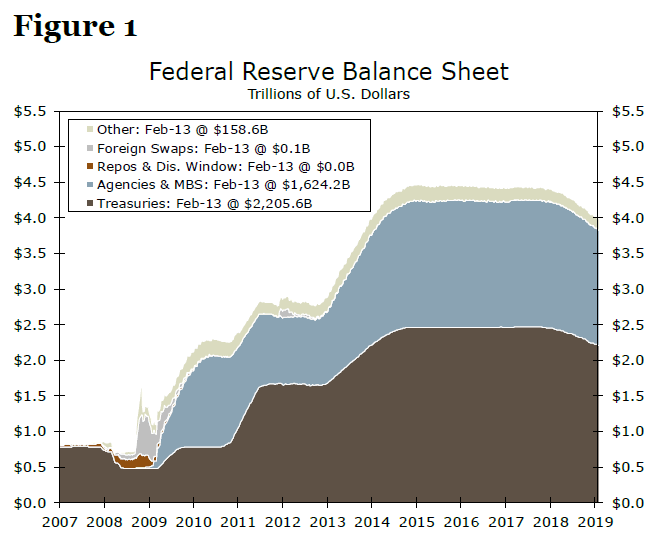
In early September 2008, the Fed's balance sheet totaled about $900 billion (Figure 1). Six years later, after the Fed had bought trillions of dollars of Treasury securities and MBS via quantitative easing (QE), the balance sheet had ballooned to more than $4.5 trillion. The Fed ended its QE purchases in late 2014, although it continued to reinvest the proceeds of maturing securities until October 2017. Now that the Fed is allowing maturing Treasury securities and MBS to roll off, the balance sheet has shrunk about $500 billion from its peak.
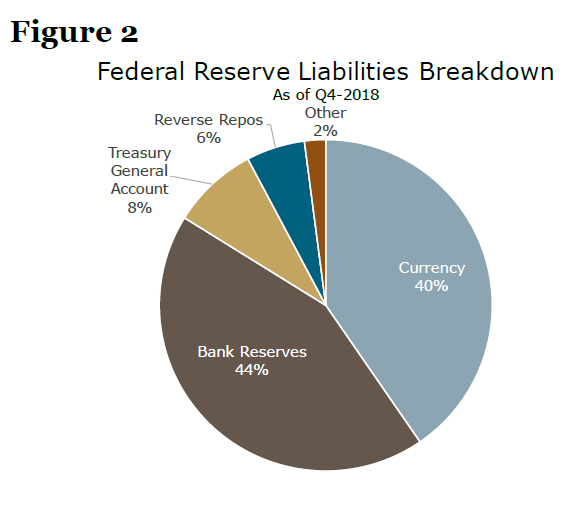
As we discussed in our two previous reports, it is more straightforward to project the size of the Fed's balance sheet going forward by focusing initially on liabilities. Currency in circulation and bank reserves comprise the vast majority (nearly 85%) of the Fed's total liabilities (Figure 2). Using some assumptions about the growth of currency outstanding and bank reserves (as well as the U.S. Treasury's cash holdings at the Fed and the outstanding amount of reverse repurchase agreements) we can generate a forecast of the liability side of the Fed's balance sheet.2
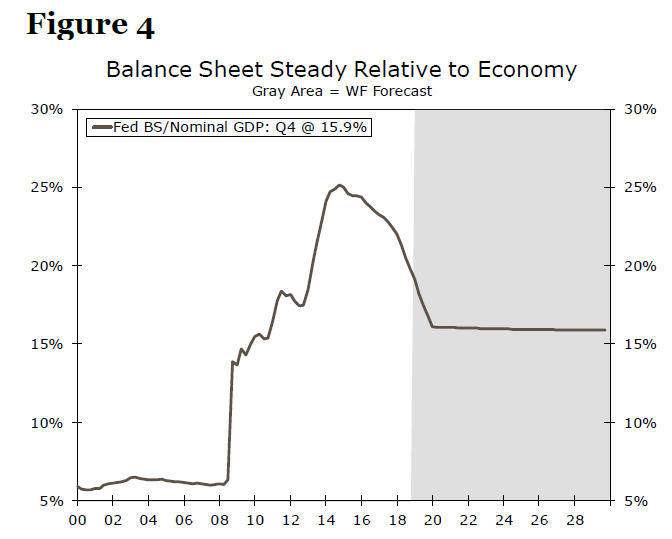
For the next year or so, we anticipate that banks will have the capacity to let the excess reserves that they hold at the Fed continue to decline. This drop in excess reserves will allow Treasuries and MBS to continue to roll off on the asset side and reduce the aggregate size of the balance sheet. But by the start of 2020, we anticipate that the banking system will be near the lower limit of the amount of excess reserves it desires to maintain at the Fed. At that point, we expect the Fed's balance sheet will begin to grow organically again, as is standard under "normal" circumstances. Under the assumptions we employ about currency and reserve growth, we project that this inflection point will be reached at the end of 2019, when the aggregate size of the balance sheet is roughly $3.6 trillion, with about $1.1 trillion in excess reserves. Starting next year, we expect the balance sheet to start growing again, eventually reaching about $5 trillion in 2029 (Figure 3). While this number seems quite large in dollars, relative to nominal GDP this would be down quite a bit relative to 2014, when the Fed was last purchasing securities (Figure 4).
What About the Composition of the Fed's Holdings?
With the prospect of a growing Fed balance sheet drawing closer, an important question arises: what will the composition of the Fed's asset holdings look like in the years ahead? There are numerous combinations and permutations the Fed could follow, and the guidance we have received from policymakers so far has been somewhat limited and qualitative in nature. That said, based off of the guidance we do have, we employ the following assumptions to build out an estimate of the Fed's asset holdings over the next decade:
- The Fed will allow its holdings of MBS to continue to roll off indefinitely, subject to a cap of $20 billion/month.3
- The Fed will purchase Treasury securities in 2020 and beyond in proportion to the overall mix of Treasury issuance including T-bills.4
- The mix of net Treasury issuance over the next decade will be split roughly 30% T-bills and 70% notes and bonds.5
By assuming that the Fed will allow its holdings of MBS to continue to roll off indefinitely, we can then calculate the amount of Treasuries that it will need to hold to bring assets and liabilities into balance. Not only will the organic growth of the balance sheet cause the Fed's ownership of Treasuries to rise, but the Fed will also need to buy Treasuries to replace the MBS that continue to roll off. For example, we forecast the Fed's balance sheet will grow organically by about $120 billion over the course of 2021. However, we estimate that the Fed holdings of Treasuries will need to rise approximately $280 billion that year because we project that roughly $160 billion worth of MBS will roll off the balance sheet in 2021.
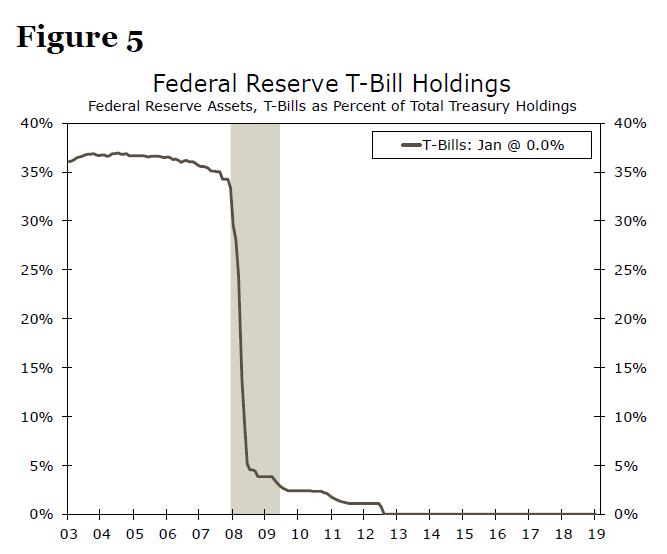
So what will happen to the composition of the Fed's holdings of Treasuries going forward? We argued in our series last year that Fed buying of T-bills would come with several advantages, including greater flexibility in an economic downturn, less upward pressure on interest rates in repo markets and a steepening of a flat yield curve. As shown in Figure 5, T-bills accounted for onethird of the Fed's Treasury holdings before 2008. That proportion plunged significantly during the Great Recession as a result of a variety of measures taken by the Fed to backstop the financial system. The Fed subsequently reduced its T-bill holdings to zero in 2011-2012 in an effort to flatten the yield curve via "Operation Twist." In part because the Fed owns no T-bills at present, the weighted-average maturity (WAM) of the Fed's portfolio of Treasuries is about 7.8 years, roughly two years longer than the WAM of the total Treasury market.
Using the assumptions laid out above, in the near term we expect the Fed's holdings of Treasuries to rise roughly $175 billion in 2020 and $280 billion in 2021, with T-bills comprising approximately $50 billion and $80 billion of those totals, respectively (Figure 6). While this comes to a relatively modest-sounding $6 billion a month over that period, it would still amount to the Fed taking down nearly a quarter of projected net T-bill supply over the next two years. Over the longer-run, our projections gradually bring the T-bill share of the Fed's Treasury holdings to 16% by 2029, about half the pre-crisis share, but up from 0% today.
It is worth reiterating that these forecasts rely on a variety of assumptions that could change as the Fed provides more guidance on the balance sheet. The Fed could instead, for instance, reduce the cap on monthly MBS redemptions in the years ahead, slowing the pace of MBS shrinkage and thus reducing the amount of Treasuries that must be bought in the coming years. The Fed could also announce sometime in the near future that it intends to taper its current monthly pace of Treasury/MBS redemptions. This would have the benefit of slowing the pace of decline of bank reserves on the liability side of the balance sheet, allowing the Fed to more cautiously and gradually approach the hard-to-pinpoint acceptable level of bank reserves. These represent just two of several options available to the Fed and currently under consideration. That said, even if we are wrong on a few of the particulars, it has become increasingly clear that the Fed's Treasury holdings will start growing in the years ahead, potentially to the tune of almost $300 billion a year as soon as 2021.
From a market standpoint, we believe there are two key takeaways. First, as we discussed in our previous series, the Fed maintaining an ample supply of excess reserve/a historically large balance sheet likely means it will continue to hold a historically high proportion of Treasuries relative to the overall market. This in turn should lead to perpetually lower yields than otherwise would be the case, all else equal. Back in 2017 when the balance sheet unwind began, the Fed pegged the cumulative effect of its asset purchases and maturity extension program as having reduced the 10-year Treasury yield term premium by about 100 basis points.6 While some of this downward pressure has likely dissipated over the past couple years amid balance sheet reductions, the bulk of the remaining impact is likely to be a permanent feature of the Treasury market for years to come.
Second, if the Fed re-enters the T-bill market for the first time in a decade, it should lead to some steepening in the yield curve, all else equal. By shortening up the WAM of the Fed's Treasury holdings, this de facto "reverse twist" could offset some of the downward pressure on the term premium that is likely to return in the face of more Fed buying of Treasury notes and bonds. Removing some T-bill supply from the market should also help alleviate some of the upward pressure on Treasury repo rates specifically, a topic we covered in a recent special report.7 While buying T-bills could help remove some of the upward pressure put on the effective fed funds rate by high repo rates, it would not surprise us if the Fed also tries to deal with this issue more holistically as it continues reviewing the process by which it utilizes administered policy rates to implement monetary policy.
1 See "Will the Fed's Balance Sheet Ever Return to 'Normal'?" Part I and Part II. Both reports are available upon request.
2 See Part I of our aforementioned two-part series for more details on our forecast methodology and how we define "organic" growth of the liabilities on the Fed's balance.
3 At present, the Fed's stated goal is to hold, in the longer run, "primarily Treasury Securities." See the Federal Reserve's Policy Normalization Principles and Plans, adopted effective September 16, 2014.
4 Per the December 2018 FOMC minutes: "Several participants noted that a portfolio of holdings weighted toward shorter maturities would provide greater flexibility to lengthen maturity if warranted by an economic downturn, while a couple of others noted that a portfolio with maturities that matched the outstanding Treasury market would have a more neutral effect on the market."
5 Per guidance from the Treasury Advisory Borrowing Committee that about one-quarter to one-third of the financing gap should be met with Treasury bills. For more, see the minutes from the October 31, 2017 TBAC meeting.
6 Bonis, Brian., Ihrig, Jane, & Wei, Mei. (2017). "The Effect of the Federal Reserve's Securities Holdings on Longer-term Interest Rates." FEDS Notes.
7 See "Getting Technical: Managing the Fed Funds Rate." Also available upon request.