Sample Category Title
Forex Technical Analysis: EUR/USD, USD/JPY, GBP/USD
EUR/USD
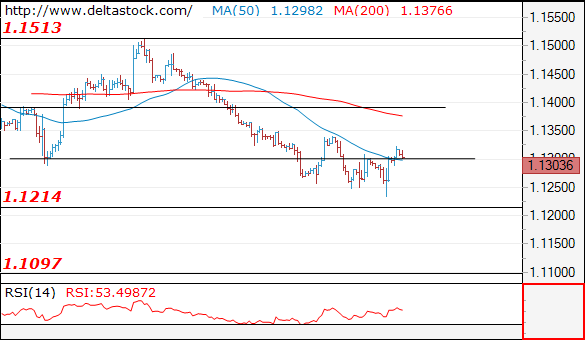
Current level - 1.1303
My outlook on the lower frames is rather positive, for a rise towards 1.1350, with a risk of a climb to 1.1400 area.
| Resistance | Support | ||
| intraday | intraweek | intraday | intraweek |
| 1.1350 | 1.1630 | 1.1214 | 1.1214 |
| 1.1400 | 1.1820 | 1.1214 | 1.1100 |
USD/JPY
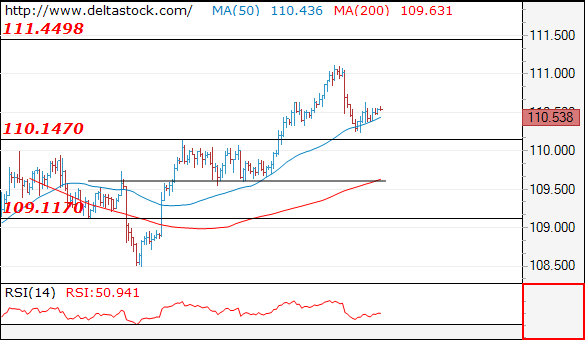
Current level - 110.53
The outlook is bearish below 110.80, for a violation of 110.20 support, en route to 109.10.
| Resistance | Support | ||
| intraday | intraweek | intraday | intraweek |
| 110.80 | 111.45 | 110.20 | 106.70 |
| 111.45 | 114.50 | 109.10 | 104.60 |
GBP/USD
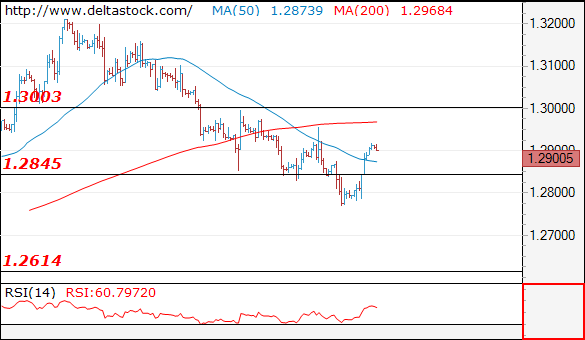
Current level - 1.2900
The minor reversal at 1.2760 signals a positive bias, for a test of 1.3000 resistance zone. Key support is projected at 1.2845.
| Resistance | Support | ||
| intraday | intraweek | intraday | intraweek |
| 1.2930 | 1.3000 | 1.2845 | 1.2800 |
| 1.3000 | 1.3290 | 1.2700 | 1.2610 |
EUR/USD Outlook: Rebound Faces Strong Headwinds And Stays Away From Key 1.1341 Fibo Barrier
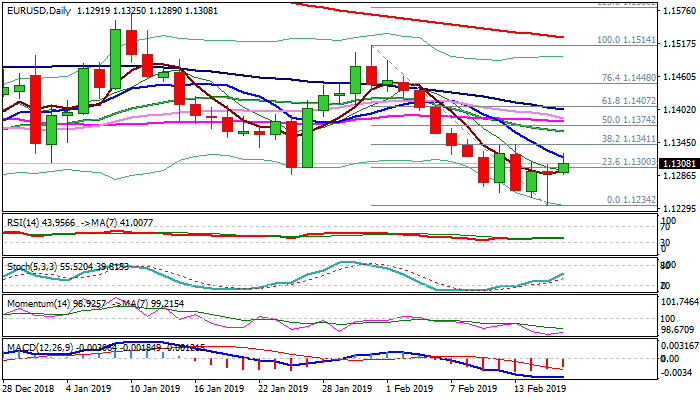
The Euro holds positive tone in early Monday’s trading and rebounds after strong downside rejection on Friday, which left long-tailed daily Doji candle.
Increased prospect for US/China trade deal pressured greenback on fresh demand for riskier assets that pushed the single currency from the dangerous zone (Friday’s spike low marks the lowest in three months).
Daily momentum is turning up after bottoming while stochastic is in steep ascend, supporting scenario.
Fresh bulls took out initial barrier at 1.1300 (Fibo 23.6% of 1.1514/1.1234) but show hesitation at falling 10SMA (1.1317).
Recovery needs lift above 10SMA and extension and close above 1.1341 (Fibo 38.2% of 1.1514/1.1234/ last week’s highs) to generate bullish signal for stronger recovery and expose a cluster of daily MA’s at 1.1364/1.1402 zone.
A number of negative signals from the EU (signs of negative growth in Germany, US threats of tariffs on EU cars, Italian recession and slower bloc’s economic growth) weigh on Euro and could limit recovery.
Return and close below 5SMA (1.1295) would weaken near-term structure and increase risk of renewed attempt at key m/t support at 1.1215.
Res: 1.1317, 1.1341, 1.1364, 1.1402
Sup: 1.1295, 1.1260, 1.1234, 1.1215
Bitcoin To Break Five Consecutive Months Of Losses. What Is Behind The Move?
One thing that the J.P. Morgan’s digital coin has brought to the crypto space is a positive month for Bitcoin. I will discuss this in more detail later. Let’s focus on some facts about the price action fist.
The crypto-currency king is on track to secure its first positive month since July 2018. The trading action for the past two months shows that downward moves were not supported by volume. The six consecutive months of sell-off were the longest losing streak since 2014, when we had five consecutive months. The tide may be about to change.
The question is what has triggered this change in momentum?
It is the price action and the price action alone. The bitcoin price had been way oversold. It was widely expected that this monthly string of consecutive losses could not last forever. As long as the Bitcoin price closes above the 3405-level: the open price of this month (which is the same as the closing price of last month), the sell-off pressure is likely to ease off. Perhaps, this could encourage more buyers into the market.
With the wind of change blowing, the fundamentals are likely to improve in the coming months for the cryptocurrency space. The hopes are pinned on the improvement of the transaction volume for on-chain transactions. This will attract growth because of a larger number of industries becoming part of this infrastructure.
Another stability element for the Bitcoin price comes from the second biggest coin. The Ethereum price has stayed above the critical mark of $100. This is critical for the Bitcoin price because Ethereum is the most broadly used protocol by enterprises. The fact that the recent low of $100 (formed on February 6) was much higher than the previous low of $80 (formed on December 14), produced an early indication that the price may be moving higher. However, the price still needs to clear the level of $158 before we can be confident about the uptrend. In terms of volume, things are looking great for Ethereum. The volume has soared from $2.07 billion (as of February 17) to $5.02 billion as of today.
Now let’s focus on some of the major fundamentals that are also behind the current momentum in the bitcoin price. The Japanese Amazon Rakuten is considering accepting cryptocurrencies as a form of payment. In addition to this, Argentina announced that they are going to accept Bitcoin payments for goods sold to Paraguay. All of this makes the sentiment more positive.
A Bitcoin ETF may become a reality in 45 days, and this is also behind the current momentum. The NYSE is looking for five distinct Bitcoin ETFs for both bull and bear market and it filed for the permission last year. If the decision comes back positive in the next 45 days, which the market is hoping, it will involve institutional money. Such a development will be positive for the markets.
To finish off, it is all about JPMCoin as I said earlier. The Wall Street giant announced last week that it is going to use its blockchain Quorum for its digital coin for cross border payments. The bank decided to peg the coin to the dollar at 1:1 ratio in order to bring stability.
When it comes to cross-border payments, only one coin comes to mind: Ripple and the digital currency XRP. The comparison between the XRP token and JPMCoin will flare a serious debate. To start with, the decentralized element pretty much knocks the J.P. Morgan’s coin out of its place. But the upper hook of JPMCoin in terms of its capacity of moving $5 trillion in wholesale payment each day takes the wind out of XRP token. But at the end of the day, the fact is that JPM using the digital coin for cross-border payment only strengthens the entire space. And for me, JPM jumping in this space is not a matter of competition between XRP and JPM’s coin, but it only fosters the very concept that these digital coins are the future.
The bottom line is that fundamentals are shifting positively, and the selling pressure lost its momentum with no substantial backing of volume. This leads me to believe that all that negativity which we have been facing in the industry for the past five months may be coming to an end.
UK Lidington: Useful discussions with Brussels, but very difficult to reopen negotiations
UK Minister for the Cabinet Office David Lidington said today that the government is having useful discussion with Brussels. However, it's still very difficult to reopen withdrawal agreement negotiation.
He told BBC radio that "My experience last week... was that they were a lot more than courtesy calls. It was a very useful discussion about the politics, both within the United Kingdom and within the EU27, and a scoping out of what was possible." However, Lidington also noted that "Reopening the withdrawal agreement... will be very difficult."
Brexit Minister Steve Barclay will meet EU's chief Brexit negotiator today.
USD Weakens As US-SINO Progress Pushes Riskier Assets
The USD weakened against a number of its counterparts yesterday as hopes grew for further progress in the US-Sino negotiations. Both participants reported progress on the negotiations in Beijing, albeit the US also stated that much work remains to be done. Negotiations are expected to continue in Washington next week and market focus seems to concentrate on the possible outcome. Analysts point out that market's expectations for further progress have shifted investors away from the safety of the USD, in favor of riskier assets. Should the positive headlines about the US-Sino negotiations continue to reel in, we could see the USD continuing to weaken. EUR/USD strengthened on Friday and during today's Asian session, breaking the 1.1260 (S2) and the 1.1300 (S1) resistance lines, now turned to support. We could see the pair trading in a sideways manner today as the US markets are closed and no major financial releases are expected. Should the bearish momentum for the USD continue, we could see the pair aiming if not breaking the 1.1345 (R1) resistance line. On the other hand should the pair come under the selling interest of the market, we could see it breaking the 1.1300 (S1) support line and aim for the 1.1260 (S2) support barrier.
Pound strengthens on strong sales data
The pound strengthened on Friday as strong sales data, gave some relief to GBP traders, amidst Brexit uncertainty. January's UK retail sales growth rate acceleration was substantial and both the headline and core rate aligned, indicating stronger demand and stopping the weakening course of the pound. On the other hand, Brexit uncertainty remains, especially after Theresa May's symbolic defeat in the UK parliament last week. Analysts point out that Theresa May's recent defeat in Parliament, shows that she does not enjoy a majority among UK lawmakers, which could undermine her negotiating position with EU leaders. Should Brexit uncertainty continue and depending on the headlines, we could see the GBP weakening again yet financial releases may disrupt that trend in the coming days. Cable rallied on Friday, breaking the 1.2830 (S1) resistance line (now turned to support). Technically, it should be noted that the pair's price action, broke the downward trendline dominating the pair's direction since the end of January, hence we switch once again the pair's bearish outlook in favor of a sideways movement. Should the pound be under pressure today, we could see the bears taking over and cable could drop, breaking the 1.2830 (S1) support line. Should on the flip side, the bulls renew their momentum, we could see the pair breaking the 1.2960 (R1) resistance line and aim for the 1.3070 (R2) resistance hurdle.
Today's other economic highlights
It's expected to be a slow Monday today as no major financial releases from Europe are expected and the US and Canadian markets are to be closed. Never the less please be advised that we could see some surprises as it is expected to be a period of thin trading today.
As for the week ahead
On Tuesday, from Australia, we get RBA's meeting minutes, from the UK the employment data for December and from Germany the ZEW economic sentiment indicator for February. On Wednesday, we get Japan's trading balance for January, Australia's wage price index for Q4, Eurozone's preliminary consumer confidence for February, and from the US FOMC meeting minutes. On Thursday, we get Japan's Nikkei Mfg PMI for February, Australia's employment data for January, Germany's and Eurozone's preliminary PMI's for February, ECB releases its meeting minutes, while from the US we get the Durable goods orders growth rates and the Philly Fed Mfg Index. On Friday, we get Japan's CPI rates for January, Germany's Ifo Business Climate for February and Canada's retail sales growth rates for December.
GBP/USD H4
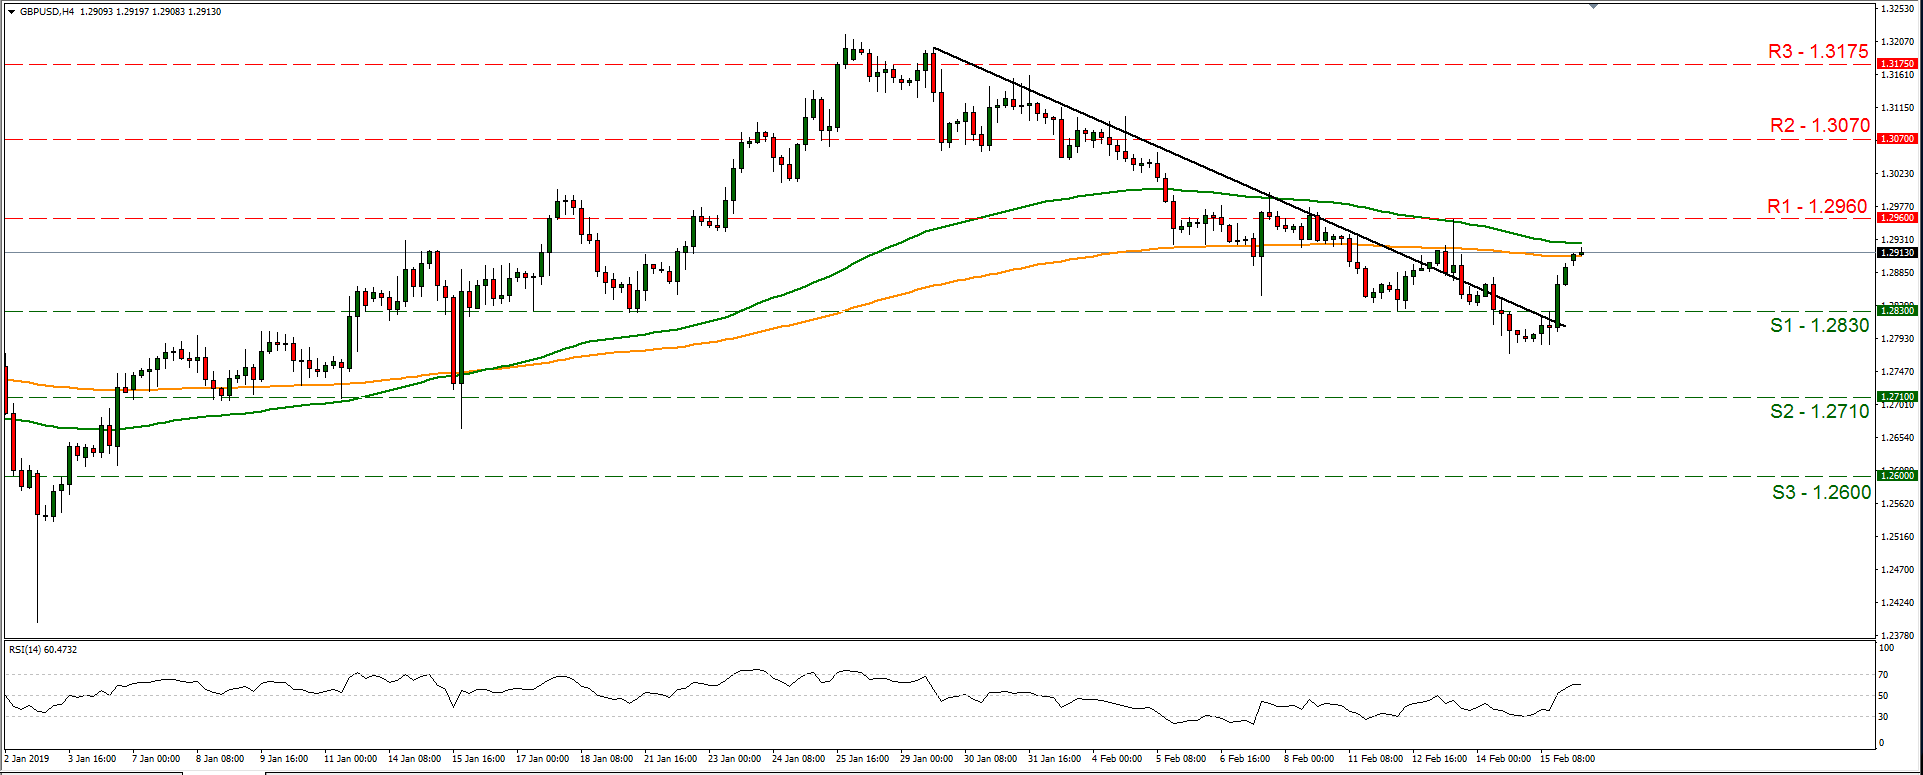
Support: 1.2830 (S1), 1.2710 (S2), 1.2600 (S3)
Resistance: 1.2960 (R1), 1.3070 (R2), 1.3175 (R3)
EUR/USD H4
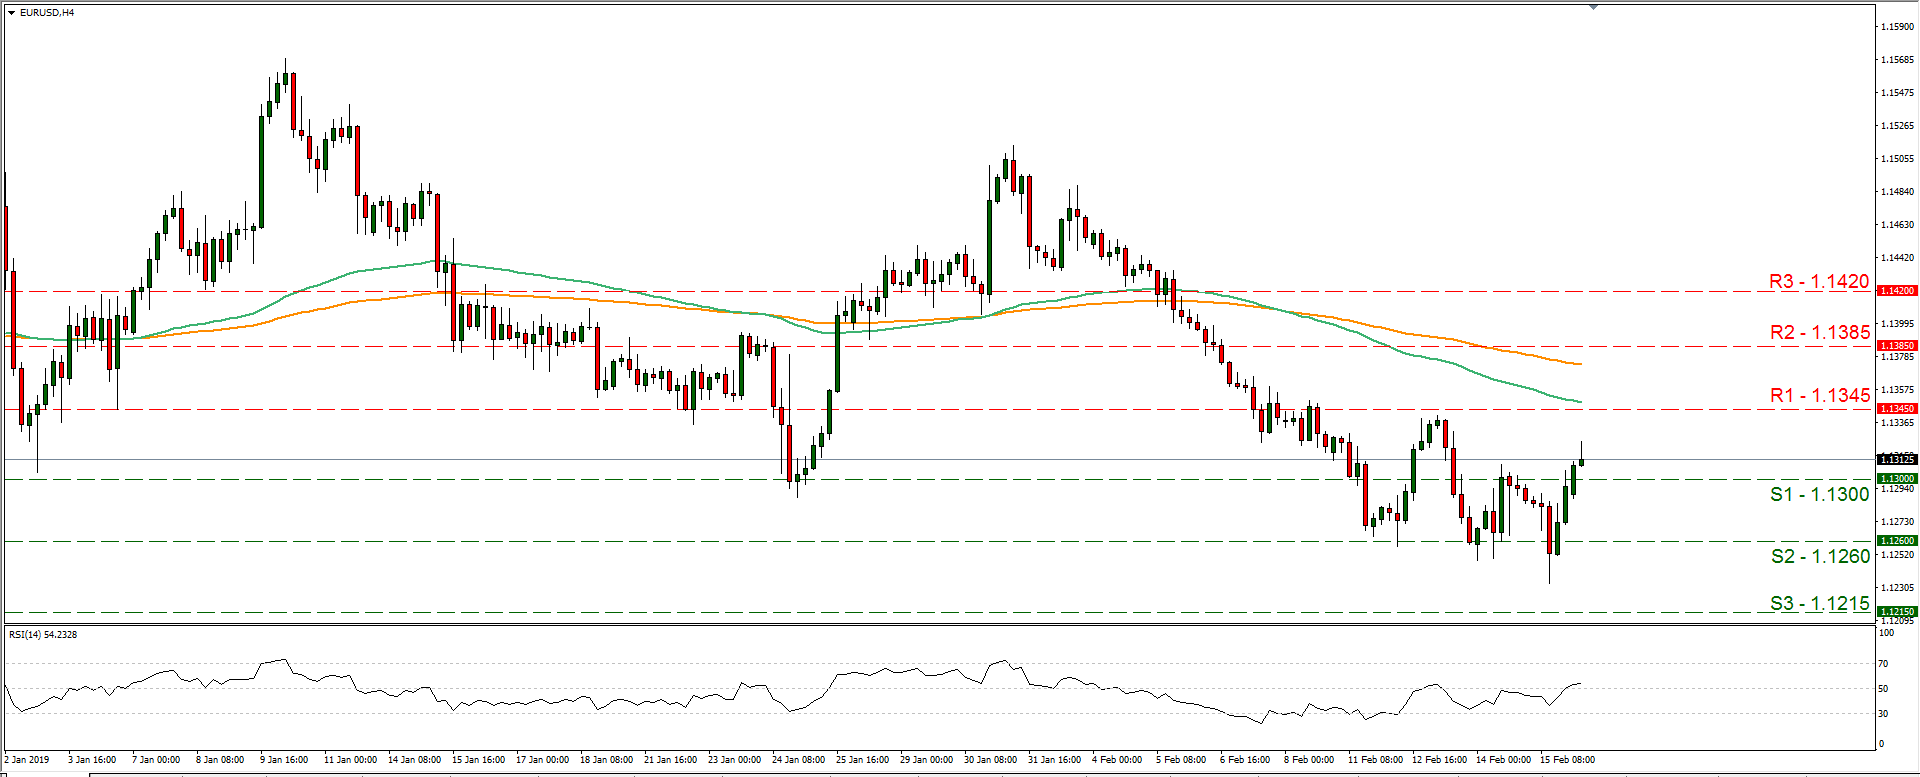
Support: 1.1300 (S1), 1.1260 (S2), 1.1215 (S3)
Resistance: 1.1345 (R1), 1.1385 (R2), 1.1420 (R3)
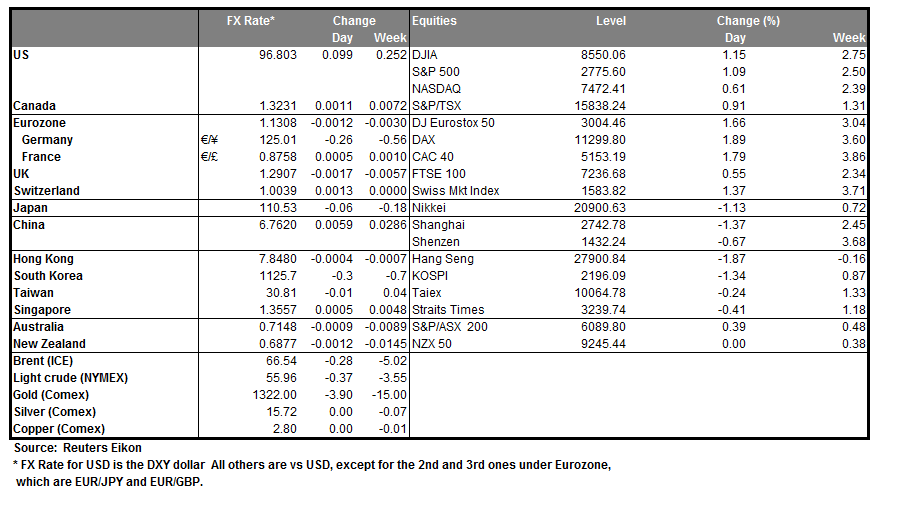
Stocks & Commodity Currencies Cheer Trade Optimism
- Risk sentiment buoyed by signs of progress in US-China talks, though risk of auto tariffs casts shadow
- ECB's Coeure sends the euro lower, but single currency bounces back
- US and Canada closed for today, attention may be on Brexit
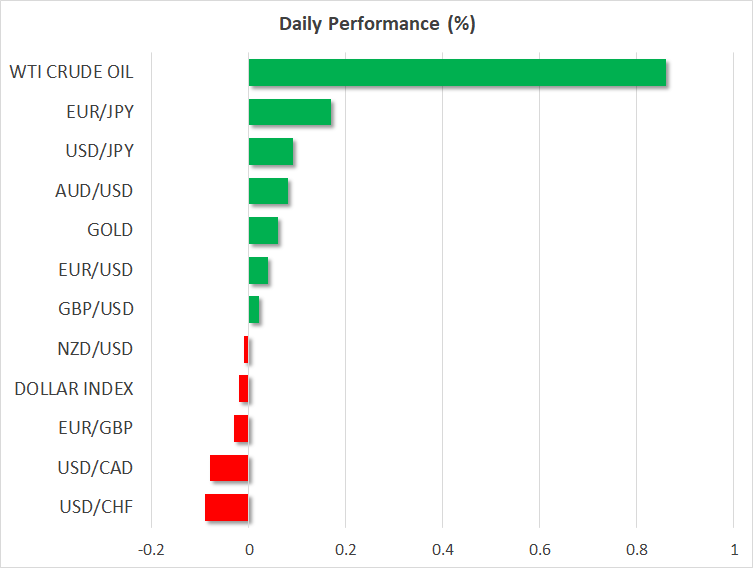
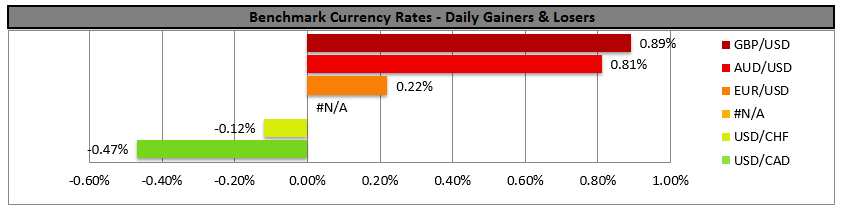
Stocks rally alongside commodity currencies amid trade “progress”
Encouraging headlines around the US-China trade talks boosted global risk sentiment on Friday, following the conclusion of the high-level talks in Beijing. Both sides played up hopes for a deal, with President Trump saying the negotiations are “going extremely well” and Chinese state media even claiming a “consensus in principle” has been agreed. The talks will continue in Washington this week.
Accordingly, US stock markets grinded higher, with both the S&P 500 (+1.09%) and the Dow Jones (+1.74%) advancing to 2½-month highs, with the S&P importantly also clearing its key 200-day moving average. In the FX spectrum, commodity-linked currencies like the aussie, kiwi, and loonie outperformed, drawing strength from gains in actual commodities. Meanwhile, the dollar retreated, as the diminishing risk of further escalation seemingly diverted haven flows out of the world’s reserve currency.
Overall though, some cause for caution remains. While the trade headlines are optimistic, there haven’t been any details on what was agreed so far, where progress was made, or on anything else for that matter. Moreover, overnight reports suggest the US Commerce Department has completed its report on auto tariffs, though the results have not been publicized. Remember, such reports typically precede the introduction of new tariffs. Hence, while the likelihood for a deal with China seems to be growing, one wonders whether the EU and its auto industry may be next in line, as the White House seems to prefer negotiating on one front at a time.
Coeure torpedoes euro after hinting new TLTROs are “possible”
The euro dived on Friday, following some remarks from ECB Executive Board member Coeure, who suggested policymakers are discussing the prospect of another round of long-term loans for banks, the so-called TLTROs. This was likely seen as a taste of what is to come at the ECB’s upcoming meeting in March. On the political front, news that Spain will head to early elections in late April probably didn’t help either.
Yet, euro/dollar managed to recover most of its losses to close the session only marginally lower, mainly due to softness in the dollar. Besides trade optimism, remarks by the Fed’s Daly that she doesn’t see a rate hike this year likely helped drag the dollar down as well. Going forward, the pair will likely take its cue from the minutes of the latest Fed and ECB meetings, due out on Wednesday and Thursday respectively.
Coming up: Brexit on the radar as US takes the day off
The economic calendar is practically empty on Monday.
US and Canadian markets will remain closed for the Presidents Day and Family Day holidays respectively. This implies liquidity may be thinner than usual, so sizeable moves may occur with little in the way of news behind them.
Attention will most likely be on the UK, following reports that some Labour lawmakers are considering breaking away from the party amid disagreements over how their leadership is handling Brexit. In particular, that the party is backpedaling on its previous commitment to seek another referendum.

EURGBP Opens With Gap Down, Soft Momentum In Near Term
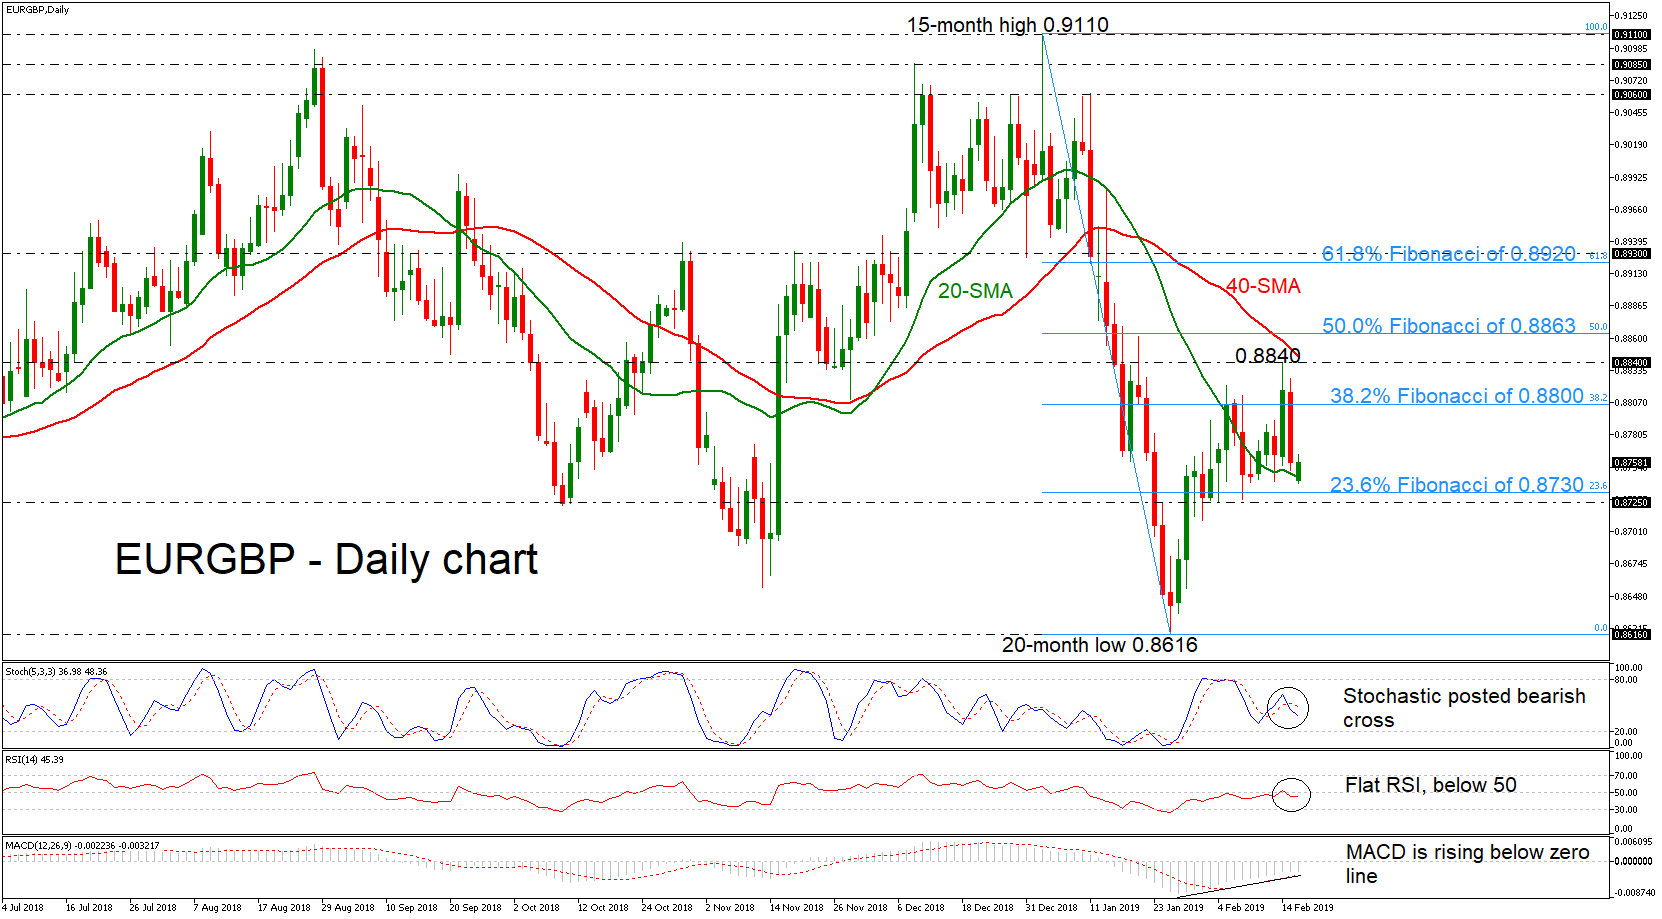
EURGBP opened with a gap down on Monday, challenging the 20-simple moving average (SMA) in the daily timeframe after it topped on the 0.8840 resistance level in the preceding week. Currently, the price is covering this gap and moving higher.
In the near term, the pair could consolidate as the RSI is flattening slightly below the 50 neutral mark, while the MACD continues to improve above its red signal line and towards zero but with softer speed. However, the stochastics are approaching the oversold zone after the bearish cross within %K and %D lines.
On the upside, the pair could retest the three-week high of 0.8840 after surpassing the 0.8800 round level, which is the 38.2% Fibonacci retracement of the downleg from 0.9110 to 0.8616. Higher, a break above the 0.8840 resistance and the 40-SMA the 50% Fibonacci of 0.8863 could be the next level to focus on. More advances could send prices until the 61.8% Fibonacci of 0.8920.
Should the price head south again and drop beneath the 23.6% Fibonacci mark of 0.8730 and the 0.8725 support, it could resume the bearish structure until the 20-month low of 0.8616, achieved on January 25. In case of more negative pressures, the pair could open the way towards the 0.8530, taken from the inside swing top on April 23.
In the medium-term picture, the neutral outlook remains intact since September of 2017 as the price failed to decline below the 0.8616 trough. A significant close above the 15-month high of 0.9110 would activate the bullish phase.
EURUSD Returns Above 1.13 But Negative Risks Still Alive
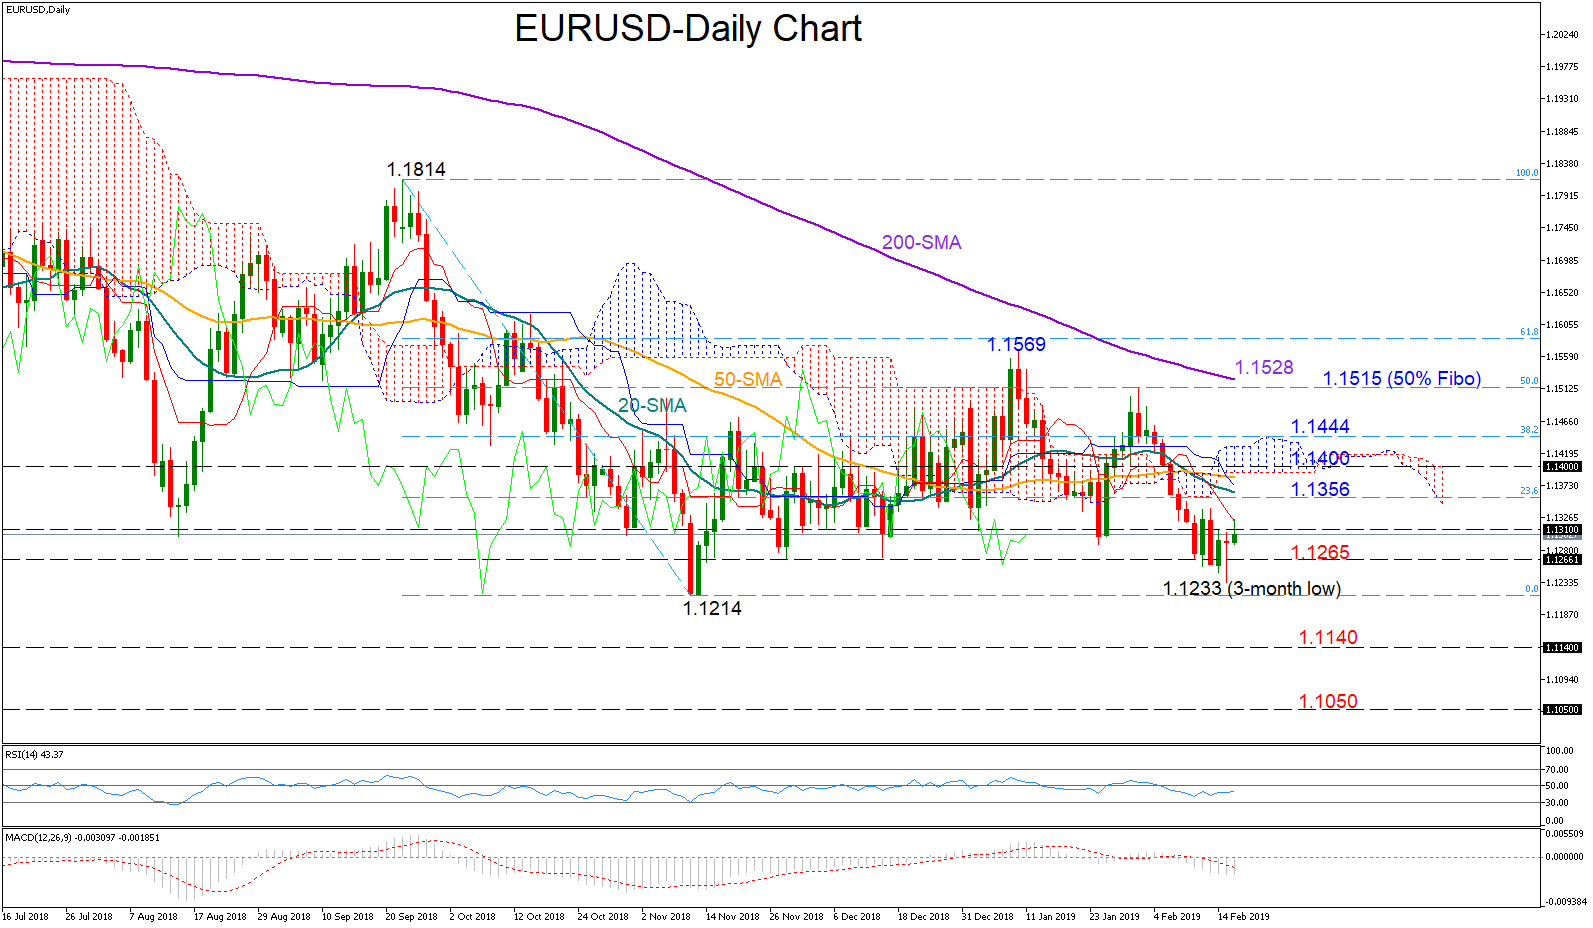
EURUSD registered a three-month low at 1.1233 on Friday before closing negative for the second consecutive week. On Monday the pair managed to rise back above the 1.1300 level, with momentum indicators shaping a bearish-to-neutral picture for the short term; the RSI is recovering towards its 50 neutral mark, the MACD seems to be showing easing negative momentum, while the red Tenkan-sen line continues to lose ground below the blue Kijun-sen line.
Support around 1.1265 should be in focus if bearish action resumes, while more importantly, a significant beat of the 1.1214 bottom would activate the long-term downtrend started from 1.2554 (January 2018), turning the medium-term outlook from neutral to negative. In such a case, the price could fall deeper to meet support around 1.1140, a frequently tested area during 2016-2017. If the sell-off continues then the next stop could be somewhere near 1.1050.
Alternatively, an extension higher could find immediate resistance from the 23.6% Fibonacci of 1.1356 of the downleg from 1.1814 to 1.1214. Should buyers drive the price above 1.14, the rally could pause near the 38.2% Fibonacci of 1.1444 before a crucial battle around the 200-day moving average which currently stands 1.1528 and slightly above the 50% Fibonacci. Further up and above the 1.1569 top, the market could experience fresh buying pressure.
Summing up, the short-term bias looks bearish-to-neutral, while the medium-term outlook holds neutral as long as the price trades below 1.1569.
GBP/USD Outlook: Bullish Outside Day Provides Positive Signal But More Work Needed At The Upside To Confirm Reversal
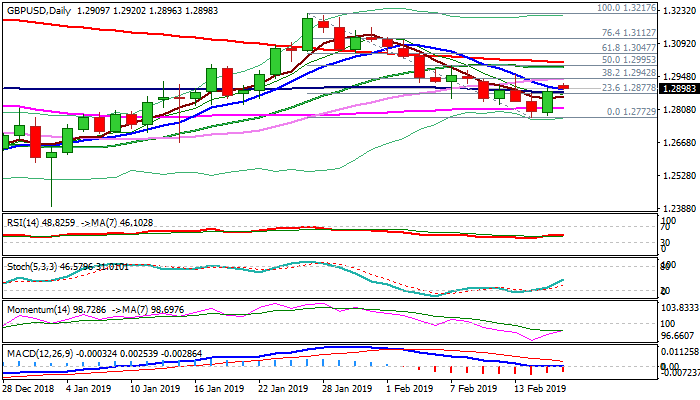
Cable is holding above 1.29 handle in early European trading, following Monday's gap-higher opening and extension to 1.2920 high in Asia, boosted by fresh risk appetite on optimism in US/China trade talks. Strong rally on Friday (the biggest one-day rally since 25 Jan) left double bottom at daily cloud top and also formed bullish outside day, initial sign of reversal. Friday's marginal close above 100SMA (1.2880) which capped the action in past five days, was initial bullish signal, which was reinforced by today's open and holding above 10SMA (1.2894). Momentum is in steep ascend and about to form bull-cross with its 7-d MA,stochastic is heading north and 5SMA is reversing up, all giving positive signals. Fresh bulls need close above 1.2942 (Fibo 38.2% of 1.3217/1.2772, reinforced by daily Kijun-sen) to generate stronger reversal signal and expose pivotal barriers at 1.3000 zone, converged 20/200SMA's (1.2989/1.3009) violation of which would confirm reversal. Repeated close above 100SMA would boost positive signals and keep hopes for stronger recovery alive. Conversely, failure to hold gains above 100SMA would keep the downside vulnerable, as daily cloud narrows and twists next week that could be magnetic.
Res: 1.2920,1.2942,1.2986,1.3009
Sup: 1.2896,1.2880,1.2864,1.2815
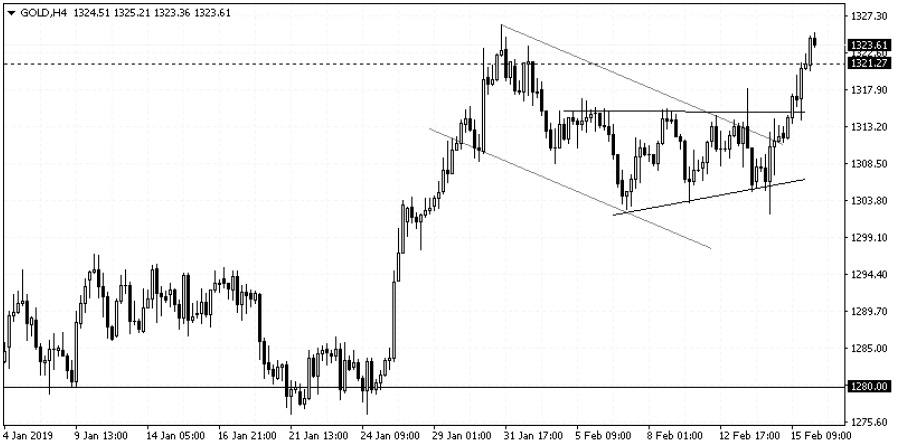
XAUUSD Intraday Analysis
XAUUSD (1323.61): Gold prices turned bullish on Friday with the price action on the 4-hour chart indicating a breakout from the ascending triangle pattern. This also triggered an upside breakout from the bullish flag pattern. Price tested the previously established resistance level of 1321 before easing back. Gold prices need to post a follow through and close above 1321 to set the sights for the next upside target. While the ascending triangle on the 4-hour chart signals a move to 1323, the daily time frame bullish flag pattern gives an upside target of 1347 at the very least. If gold manages to establish support at 1315, we could expect to see some bullish momentum taking over.