Sample Category Title
Limited Upside EUR In US–EU Trade Conflict
Following mid-2018 talk between US President Donald Trump and European Commission President Jean-Claude Juncker that avoided duties on EU car imports to the US, the story now resumes. Last week’s Security Conference in Munich showed that EU–US relations are eroding over the Iran deal, US disengagement in Syria and, again, auto tariffs.
The worst-case – imposition of tariffs – would hurt the euro. Trump has a 90-day period to act, allowing time to avert the worst. Maybe the EU can go the way of Canada and Mexico, which are among the top 5 car exporters to the US and benefit from the USMCA agreement that confers duty-free on 2.6 million cars per year for each member. Currently trading at 1.1309, EUR/USD is heading along 1.1325 short-term, as US market remain closed due to President’s Day and liquidity will remain low.
Trump is considering EU car tariffs along 20-25%. This would hit EU GDP growth and the single currency, because auto-related trade accounts for 10% of US–EU transactions. Germany has the most at stake; the EU economy as a whole remains highly exposed. Targeted industries would be automotive, steel and aluminium, also chemicals and textiles. The outcome for the US would be higher average vehicle prices of USD 2’750 and a threat to 367’000 US jobs in auto and related industries.
Fed watching
This Wednesday should bring news of the US Federal Reserve’s normalization strategy. The Fed’s January meeting dropped its tightening bias. Yet with interest rates on hold for now, investors will watch balance sheet management. Chairman Jerome Powell suggested the bank was near to settling a strategy for balance sheet roll-off. January meeting minutes could time the release of an updated Policy Nominalization Principle and Plans (PNPP): this would confirm the Fed is in a sustained holding pattern. Headwinds around GBP and EUR in Brexit fears and soft economic data mean that gains against the greenback are unlikely at this point. Play the range 1.1200-1.1500 in EUR/USD.
Today’s US holiday will keep trading subdued. The news flow remains dominated by old stories that refuse to move out of the way: trade tensions, Brexit and US political chaos. Perhaps this is why we are seeing buyers stepping back into Bitcoin. Or perhaps it is the surprise issuance of the JPM Coin. Additional Fed dovishness should also support cryptos.
GBPUSD Bullish Bias Above 1.2900
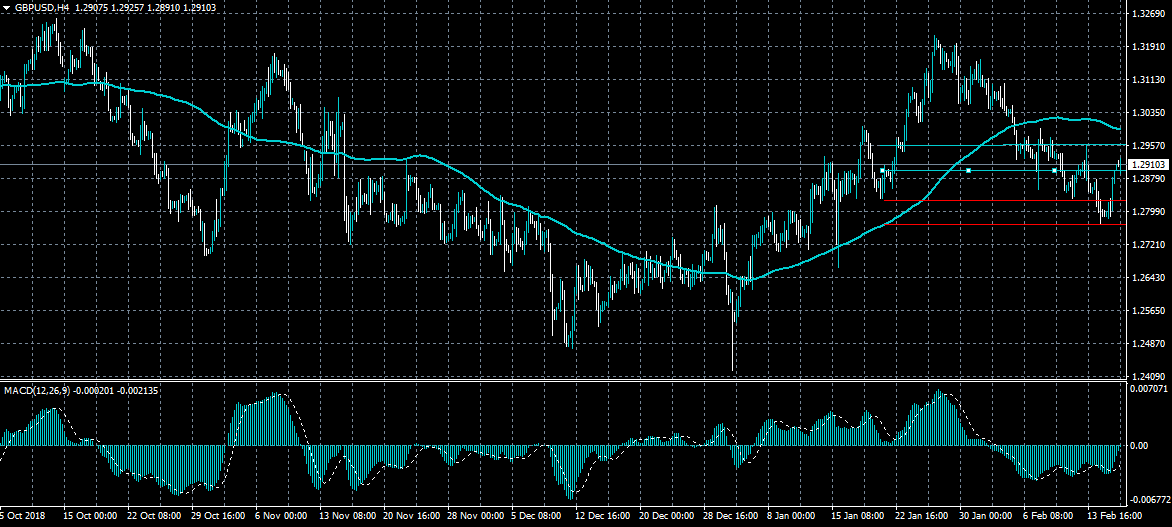
The British pound is continuing to trade above the 1.2900 level against the US dollar, following Friday’s strong technical reversal in the pair. If buyers can sustain price above the 1.2900 level, further intraday advancement towards the 1.2960 resistance level remains possible. If sellers move price back under the 1.2900 level, a further decline back towards the 1.2830 level may occur.
The GBPUSD pair is only bearish while trading below the 1.2900 level, key technical support is found at the 1.2830 and 1.2790 levels
If the GBPUSD pair holds above the 1.2900 level, buyers may test towards the 1.2960 and 1.3000 levels.
EURUSD Still Bullish Above 1.1300
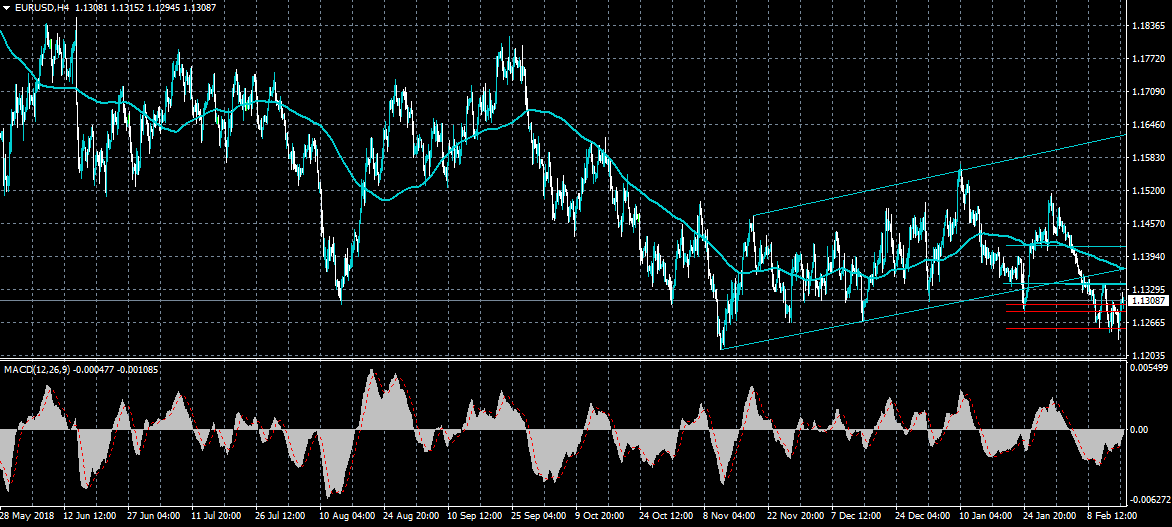
The euro continues to trade above the 1.1300 level against the US dollar, although traders are struggling to break the important 1.1337 resistance level. In the short-term, the EURUSD pair has further scope to trade higher, as technical indicators are still correcting from extremely oversold conditions. If buyers can hold price above the 1.1300 level, further advancement towards the 1.1370 resistance level remains possible.
The EURUSD pair is bullish while trading above the 1.1300 level, key technical resistance is found at the 1.1337 and 1.1370 levels.
If the EURUSD pair moves below the 1.1300 level, sellers may test towards the 1.1260 and 1.1237 support levels.
The Analytical Overview Of The Main Currency Pairs
The EUR/USD currency pair
Technical indicators of the currency pair:
Prev Open: 1.12939
Open: 1.12901
% chg. over the last day: -0.05
Day's range: 1.12894 – 1.13248
52 wk range: 1.1214 – 1.2557
EUR started to recover and retreated from the monthly minimums. The trading negotiations between the US and China remain in the spotlight. Both sides try to reach a compromise that would prevent an increase of fees on Chinese wares after March 1. This week the countries will continue negotiations in Washington. The FOMC minutes are set to release on Wednesday, February 20. EUR/USD is consolidating around 1.13000-1.13250. You should open positions from these levels.
The US and Canadian financial markets are closed due to the holidays.
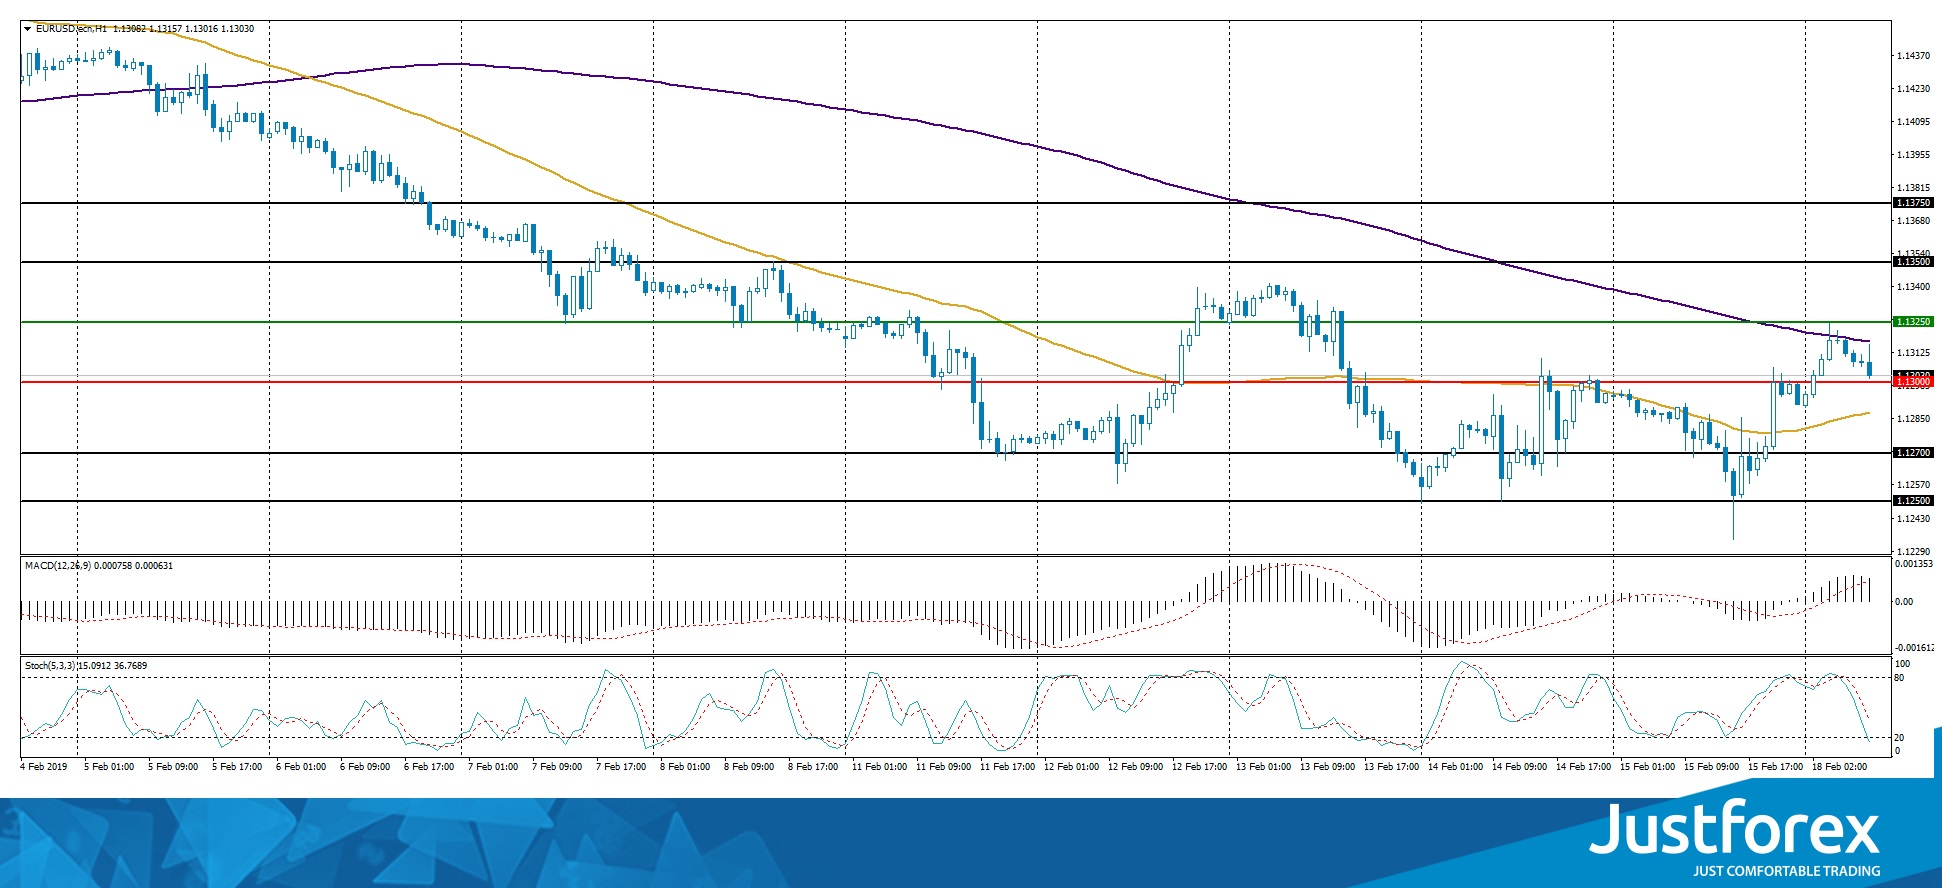
The indicators do not provide precise signals, the price fixed between 50 MA and 200 MA which act as strong dynamic support and resistance levels.
The MACD histogram is in the positive zone and above the signal line which points to further correction of the EUR.
The Stochastic Oscillator is in the neutral zone, the %K line is below the %D line, which points to a descend of EUR/USD quotes.
Trading recommendations
Support levels: 1.13000, 1.12700, 1.12500
Resistance levels: 1.13250, 1.13500, 1.13750
If the price fixes above 1.13250, expect the recovery toward 1.13500-1.13750.
Alternatively, the quotes can fall toward 1.12700-1.12500.
The GBP/USD currency pair
Technical indicators of the currency pair:
Prev Open: 1.27972
Open: 1.29005
% chg. over the last day: +0.61
Day's range: 1.28914 – 1.29203
52 wk range: 1.2438 – 1.4378
On Friday, February 15, GBP/USD had an aggressive buyout. The quotes grew by 100 points and updated the local maximums. The demand grew after the positive economic reports from the UK. Right now the quotes are consolidating around 1.28750 and 1.29200. The pound can recover further. Keep an eye on the Brexit conundrum.
The Economic News Feed for 18.02.2019 is calm.
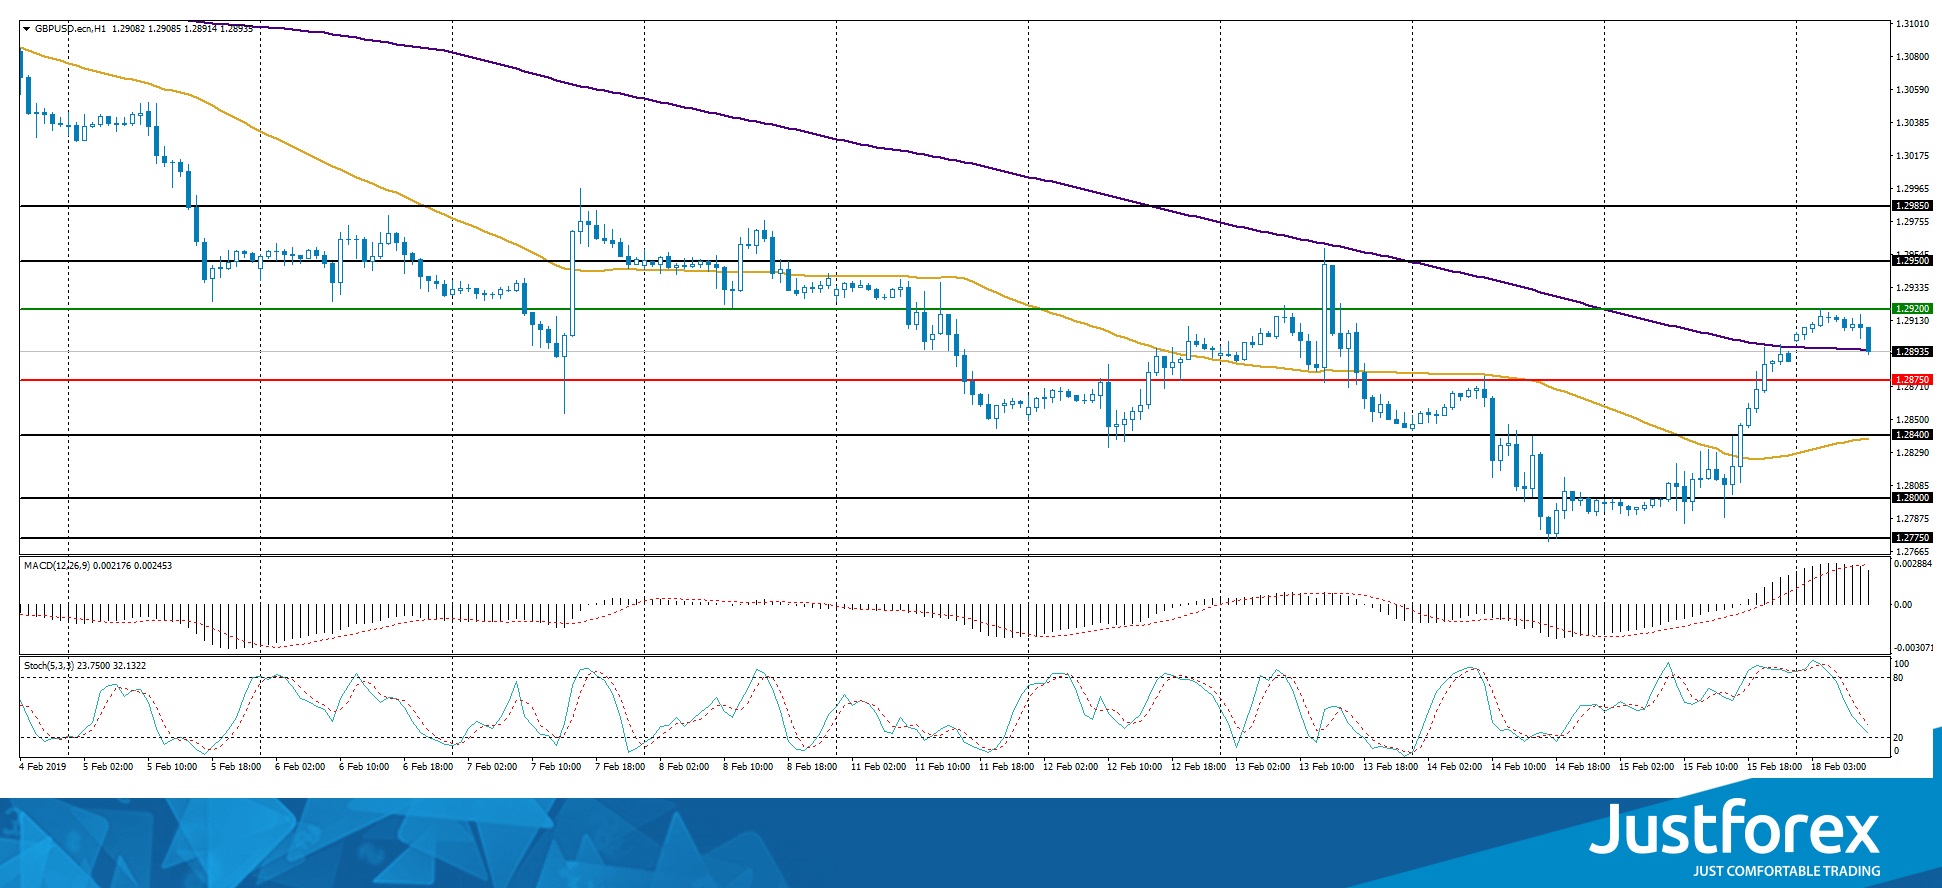
The indicators do not provide precise signals, the price has crossed 200 MA.
The MACD histogram is in the positive zone but below the signal line which gives a weak signal to buy GBP/USD.
The Stochastic Oscillator is in the neutral zone, the %K line is below the %D line which points to a bearish mood.
Trading recommendations
Support levels: 1.28750, 1.28400, 1.28000
Resistance levels: 1.29200, 1.29500, 1.29850
If the price fixes above 1.29200 expect the quotes to grow further toward 1.29500-1.29800.
Alternatively, the quotes can recover toward 1.28500-1.28200.
The USD/CAD currency pair
Technical indicators of the currency pair:
Prev Open: 1.32905
Open: 1.32509
% chg. over the last day: -0.38
Day's range: 1.32250 – 1.32538
52 wk range: 1.2248 – 1.3664
USD/CAD started to descend. On Friday the quotes fell by 50 points and are consolidating around the monthly minimums. The local support and resistance are 1.32250 and 1.32600. The trading instrument has a tendency to descend further. The additional support is provided by the positive oil quotes dynamics.
The Canadian financial markets are closed due to a holiday.
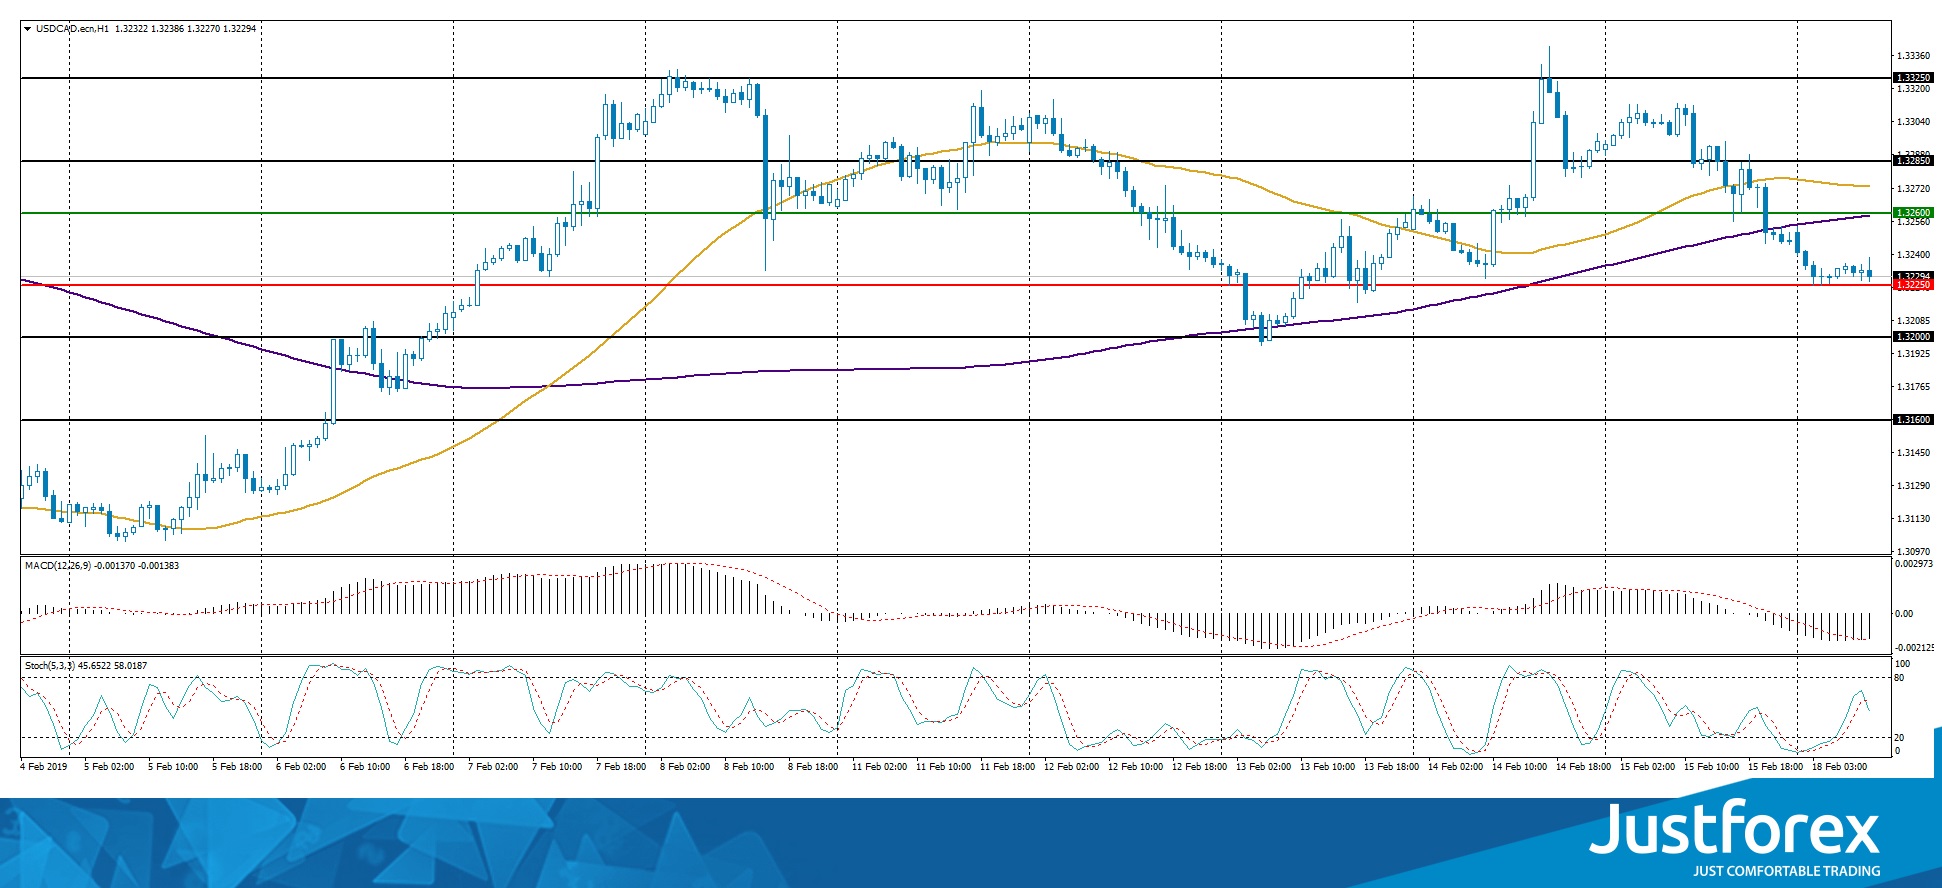
The indicators do not provide precise signals, the 50 MA us crossing the 200 MA.
The MACD histogram is in the neutral zone, the %K line is crossing the %D line. There are no signals at the moment.
The Stochastic Oscillator is in the neutral zone, the %K line is crossing the %D line. There are no signals at the moment.
Trading recommendations
Support levels: 1.32250, 1.32000, 1.31600
Resistance levels: 1.32600, 1.32850, 1.33250
If the price fixes below 1.32250, expect the qutoes to fall toward 1.32000-1.31700.
Alternatively, the quotes can recover toward 1.32800-1.33000.
The USD/JPY currency pair
Technical indicators of the currency pair:
Prev Open: 110.440
Open: 110.500
% chg. over the last day: +0.02
Day's range: 110.457 – 110.613
52 wk range: 104.56 – 114.56
USD/JPY has an ambiguous technical picture. The trading instrument is moving sideways, the investors are waiting for additional drivers. The safe haven currency is testing the key levels of 110.400 and 110.650. The USD/JPY quotes have a tendency to correct after a long rally. You should open positions from the key levels.
The Economic News Feed for 18.02.2019 is calm.
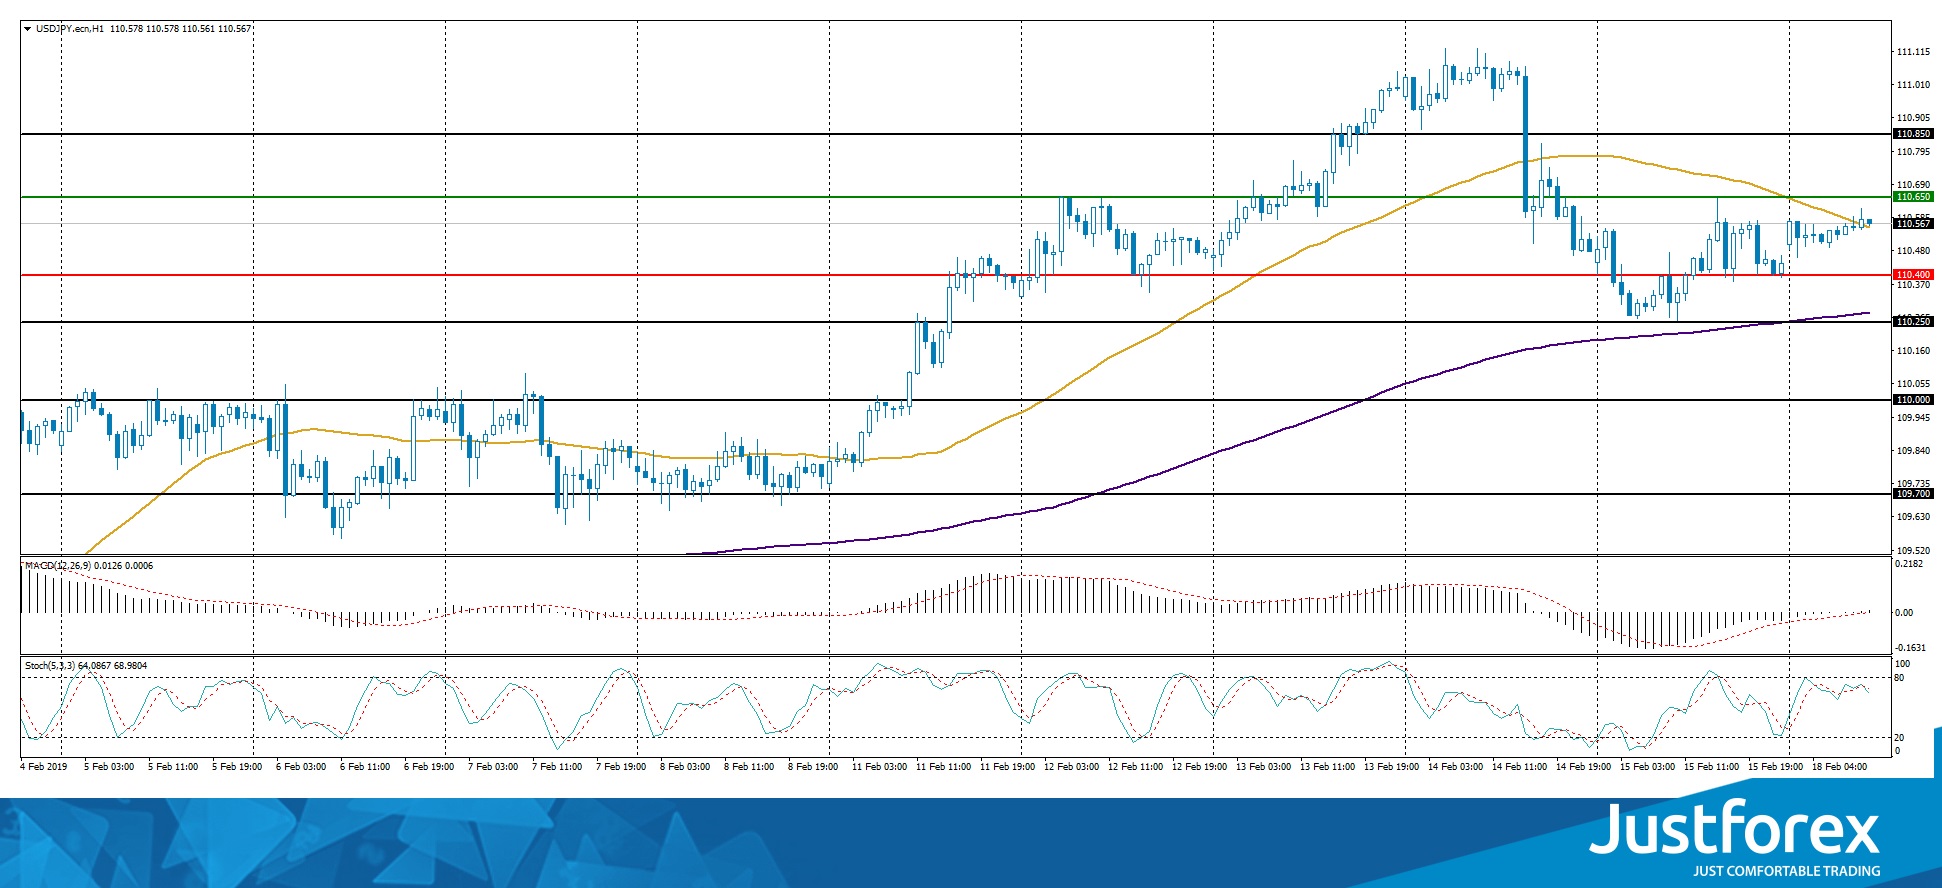
There are no precise signals, the price has crossed 50 MA.
The MACD histogram is close to 0.
The Stochastic Oscillator is in the neutral zone, the %K line is crossing the %D line. There are no signals at the moment.
Trading recommendations
Support levels: 110.400, 110.250, 110.000
Resistance levels: 110.650, 110.850, 111.000
If the price fixes below 110.400, expect the quotes to correct toward the round 110.000.
Alternatively, the quotes can grow toward 110.850-111.000.
The US Dollar Slightly Weaked
On Friday, the US dollar slightly weakened against a basket of major currencies. The US dollar index (#DX) closed in the negative zone (-0.07%). At the moment, investors are focused on trade relations between the US and China. The next round of negotiations between the delegations of the countries will be held in Washington. Last week, the US and China reported on progress in trade negotiations, but the US President, Donald Trump, said the negotiations were difficult and he could postpone the increase in duties on Chinese goods scheduled for March 1.
On Wednesday, the FOMC meeting minutes will also be published, which may provide additional information on US monetary policy. In addition, important US economic reports will be released, including data on the durable goods orders, as well as the real estate market. At the moment, the currency majors are consolidating.
The "black gold" prices are rising. At the moment, futures for the WTI crude oil are testing the mark of $56.50 per barrel. A decrease in oil production by OPEC+ countries supported oil quotes.
Market Indicators
On Friday, the bullish sentiment was observed in the US stock market: #SPY (+1.09%), #DIA (+1.37%), #QQQ (+0.42%).
The 10-year US government bonds yield is at 2.66-2.67%.
The news feed on 18.02.2019:
Today, the publication of important economic data is not expected. Financial markets of the US and Canada are closed. Family Day is celebrated in Canada, and Presidents’ Day is celebrated in the US.
Gold Records 3-Week High, Ichimoku Suggests Further Gains
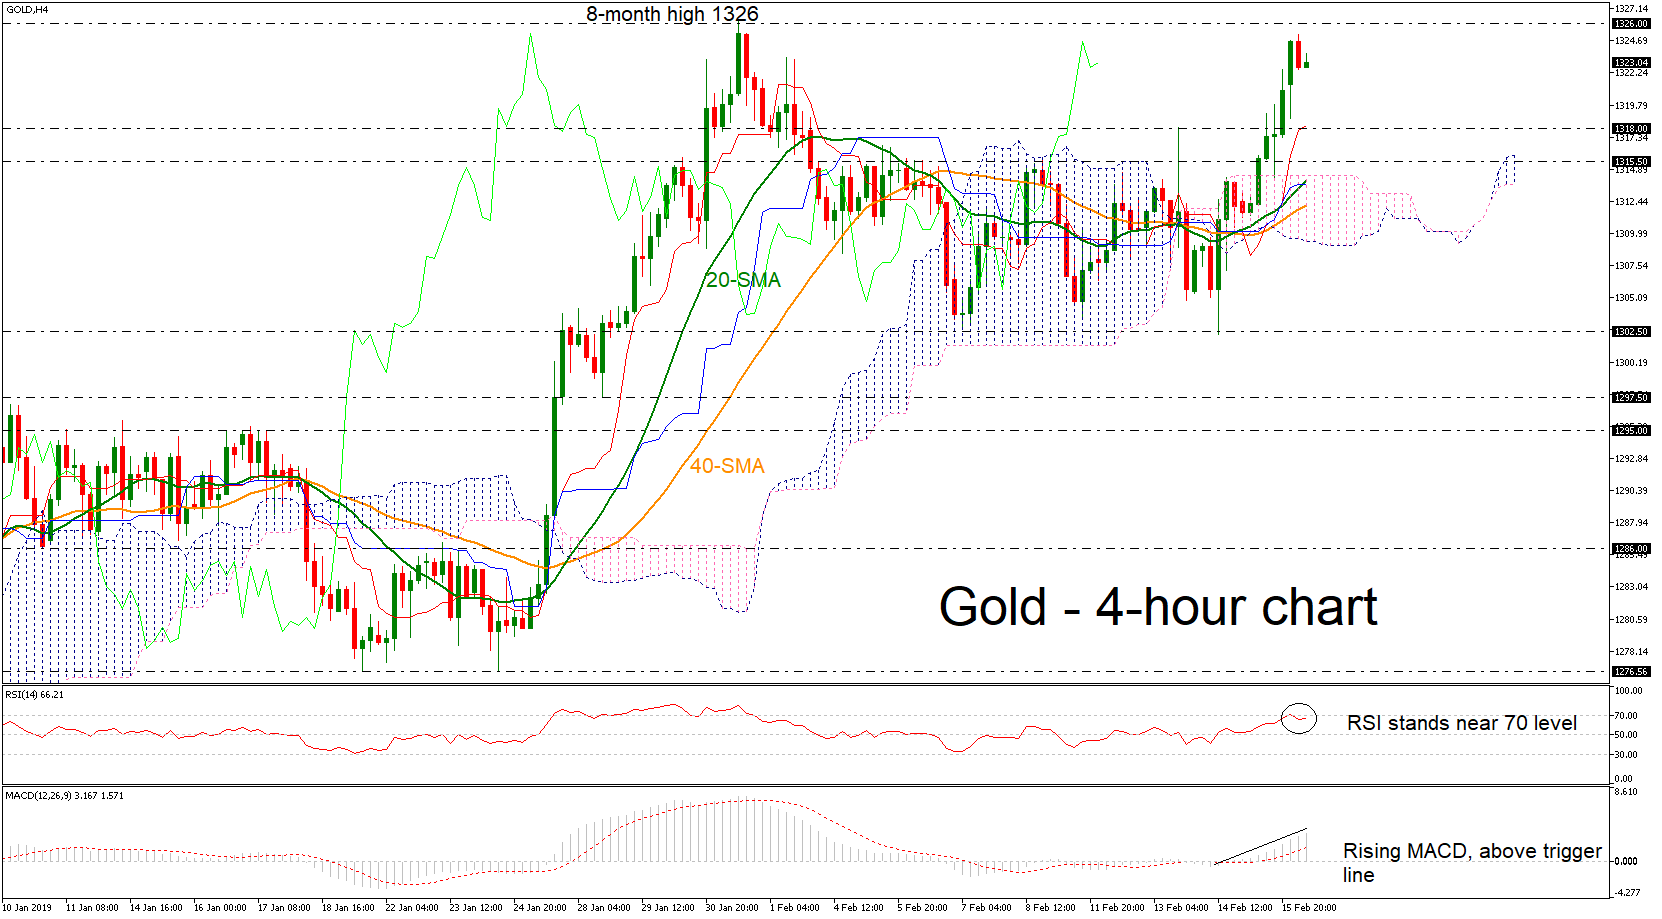
Gold prices edged sharply higher in the previous days, hitting a more than two-week high earlier today. Also, the metal is approaching the eight-month high of 1326 and a successful jump above this strong barrier would resume the bullish outlook.
The RSI indicator is holding around the overbought zone and the 70 level, while the MACD oscillator is strengthening its momentum above the trigger and zero lines in the 4-hour chart. Also, the price stands well above the Ichimoku cloud and the red Tenkan-sen line as well as above the simple moving averages, suggesting further gains.
In case of a pullback below the 1326 level, the yellow metal could create a consolidation area, within 1302.50 and 1326, while a jump above it would open the door for the next strong resistance of 1333, identified by the inside swing bottom of April 2018. Higher still, the price could meet the 1338 hurdle, registered on April 2018 as well.
In the alternative scenario, the market could fall until the 1315.50 – 1318 support zone before slipping below the Ichimoku cloud. The next support level is coming from the 1302.50 support, taken from the latest lows.
To sum up, in the medium-term picture, gold is strongly bullish given the higher highs and higher lows registered in the past three months.
WTI OIL Outlook: WTI Hits New 2019 High Today
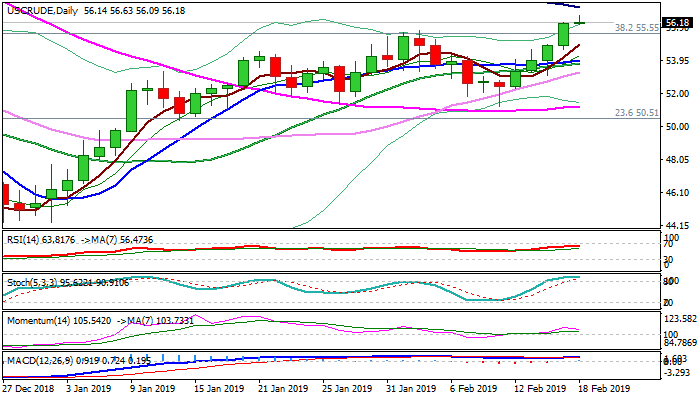
WTI oil price hit new 2019 high at $56.63 on Monday, in extension of last week's strong rally, when WTI contract advanced nearly 7%.
Renewed optimism over US/China trade talks, added to positive oil price sentiment on OPEC production cut and sanctions on Iran and Venezuela that tightened oil markets.
Weekly close above pivotal $55.55 barrier (Fibo 38.2% of $76.88/$42.36) was strong bullish signal.
Fresh extension higher approaches next target at $57.09 (100SMA) violation of which would spark further advance, however, bulls may show hesitation as stochastic is strongly overbought and momentum turned lower.
Consolidative action should ideally hold above broken pivots at $55.73/55 (previous high of 4 Feb/Fibo 38.2%), but deeper dips cannot be ruled out.
Rising 5SMA marks support at $54.89, with deeper pullback expected to find ground above lower pivots at $53.97/77 (converged rising 10/20SMA's).
Res: 56.63, 57.09, 58.14, 59.62
Sup: 56.09, 55.55, 54.89, 53.97
AUD/USD Outlook: Recovery Cracks Strong Resistance Zone But So Far Without Clear Break
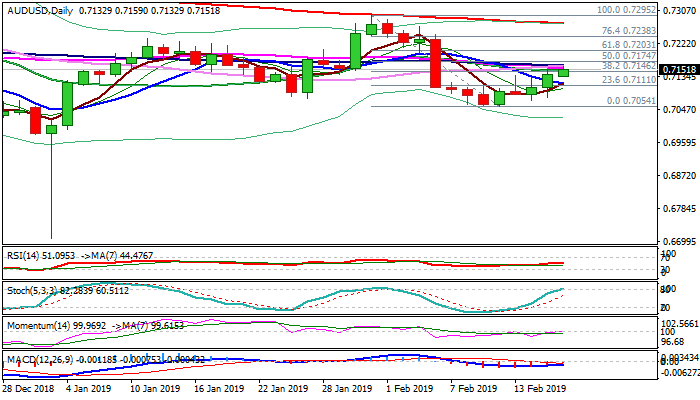
The Aussie extends recovery off 0.7054 base, boosted by fresh risk appetite on optimistic tone from trade talks.
Fresh extension higher cracked 0.7146 (Fibo 38.2% of 0.7295/0.7054) the lower boundary of strong resistance zone between 0.7146 and 0.7162 (consisting of Fibo barrier and converged 20/55/100SMA's).
Daily SMA reversed and attempts to form bull-cross with 10SMA, with the action also being underpinned by rising momentum which attempts into positive territory.
On the other side, overbought stochastic warns that recovery may run out of steam at pivotal resistance zone.
Bullish near-term sentiment keeps focus at the upside, with today's close above broken Fibo barrier (0.7146) needed to maintain positive bias. Sustained break above 0.7146/62 zone would signal recovery extension and expose next pivotal barrier at 0.7203 (Fibo 61.8% of 0.7295/0.7054). Deeper dips are expected to hold above converged 5/10SMA's (0.7115) to keep alive hopes of recovery extension. Return and close below 5/10SMA's would weaken near-term structure and increase risk of retesting 0.7054 base.
Res: 0.7162, 0.7174, 0.7203, 0.7245
Sup: 0.7132, 0.7115, 0.7079, 0.7054
USD/JPY Outlook: Directionless Mode After Limited Pullback Looks For Fresh Signals
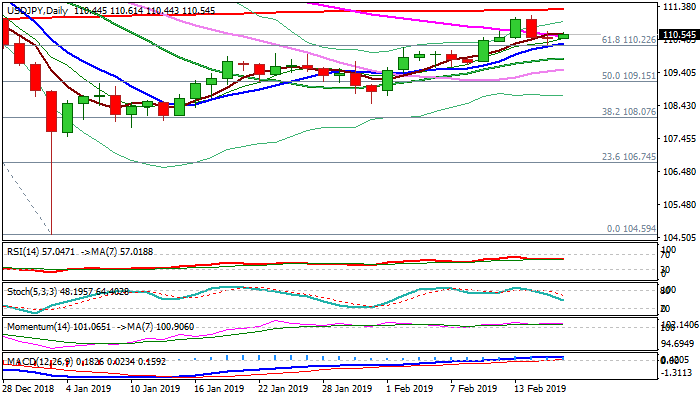
Narrow range in early Monday's trading after Friday's tight Doji signals directionless mode after pullback from last week's double-rejection at 111 zone was contained by 10SMA/broken Fibo 61.8% barrier.
Traders look for fresh direction signals, as daily techs are mixed (flat momentum, south-heading stochastic and MA's in mixed setup).
Solid bids at 110.22/00 zone keep the downside protected for now, with today's bullish close seen as minimum requirement to improve near-term tone and re-expose pivots at 111.12 (last week's high) and 111.28 (200SMA).
Return below 10SMA would generate initial bearish signal, while extension and close below 20SMA (109.83) would risk deeper pullback.
Res: 110.63, 110.93, 111.12, 111.28
Sup: 110.22, 110.00, 109.83, 109.50
EUR/AUD 4H Chart: Two Scenarios Likely
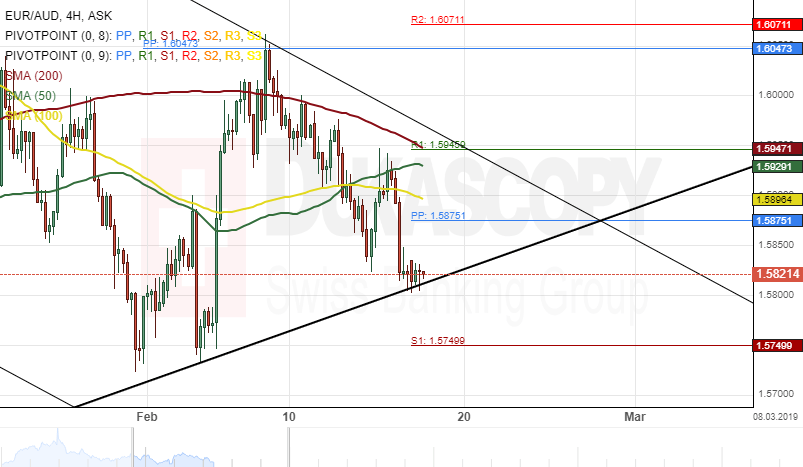
The common European currency has depreciated about 1.20% in values against the Australian Dollar since February 11. The currency pair tested the lower boundary of a dominant ascending channel at 1.5819 during Friday's trading session.
Given that the exchange rate is located near the bottom border of the dominant ascending channel, a breakout is likely to occur within this session.
If this breakout occurs, the next target for the currency exchange rate will be at a swing low of 1.5725.
On the other hand, if the support level formed by the dominant channel holds, a surge towards a resistance cluster at 1.5952 could be expected during this week's trading sessions.