

Sample Category Title
US-China trade talks to resume today, high level meeting starts Thursday
The White House confirmed in a statement that US-China trade negotiations will resume on Tuesday, today, in Washington. High-level talks will start on Thursday as led by US Trade Representative Robert Lighthizer. Treasury Secretary Steven Mnuchin, Commerce Secretary Wilbur Ross, economic adviser Larry Kudlow and trade adviser Peter Navarro would also take part in the talks. Chinese Vice Premier Liu He is expected to join the meeting on Thursday and Friday too.
White House said the talks are "aimed at "achieving needed structural changes in China that affect trade between the United States and China". And, "the two sides will also discuss China's pledge to purchase a substantial amount of goods and services from the United States."
A memorandum of understanding of some sort is expected at the conclusion of the meeting, acting as the framework for the trade agreements to be detailed. If the teams are able to deliver the MOU, it should then be known what kind of structural reforms China has agreed to take. For now, no detail is leaked on the core issues regarding IP theft, forced technology transfer, subsidies on State-Owned Enterprises, and enforcement of the agreement.
RBA Emphasises the Importance of House Prices
The RBA Board minutes confirmed the current neutral policy bias. Of most interest was the commentary on the importance of house prices for its forecasts.
The minutes of the Reserve Bank Board meeting for February have largely confirmed the themes which were set out in the February Statement on Monetary Policy.
Key to these themes is “the probabilities around these scenarios were now more evenly balanced than they had been over the preceding year when an eventual increase in the cash rate had appeared more likely”. Of course, the two scenarios relate to an eventual increase and an eventual decrease in the cash rate.
The policy outlook is firmly linked to progress in reducing the unemployment rate and moving the inflation rate back into the 2-3% policy band.
The risks around the outlook centre on the household sector and dwelling investment. The Bank remains generally comfortable with the outlook for business investment ; government spending and external conditions.
Clearly, developments in the housing market, particularly in Sydney and Melbourne, are attracting considerably more attention than we had seen in the minutes of meetings held in 2018. In particular, the Bank’s current position that the effect of recent price falls on overall economic activity was expected to be relatively small is noted. However, in a very significant warning around the policy outlook, the minutes state “if prices were to fall much further, consumption could be weaker than forecast, which would result in lower GDP growth, higher unemployment and lower inflation than forecast”. This statement directly links developments in house prices to the Bank’s key policy forecasts. The causal mechanism would be around a larger wealth effect than currently expected impacting consumer spending, and a sharper downturn in residential building activity than has been recognised, even in the Bank’s new much more subdued forecasts relative to the November Statement on Monetary Policy.
Note that for the record, the RBA’s GDP growth is forecast at 3 per cent in 2019 and 2.75 per cent in 2020. These forecasts are down from 3 ¼ per cent in 2019, and 3 per cent in 2020. The downward revisions are largely attributed to softer consumption growth and a sharper downturn in dwelling investment.
Westpac has long argued that the RBA’s previous growth forecasts were too high, and indeed, our current forecasts for 2019 and 2020 of 2.6% are still below the RBA’s numbers.
The RBA’s handle on the outlook for housing prices in Sydney and Melbourne appears tenuous. The minutes note that the recent falls “were relatively large by historical standards, and that it was unusual for housing prices to fall significantly in an environment of low mortgage interest rates and a declining unemployment rate”. Note that in previous periods of falling house prices, large interest rate cuts have followed, and were successful in stabilising the markets. The current period of low mortgage rates means that the usual policy response to stabilise markets with large rate cuts will not be possible, and it is therefore not unreasonable to expect that further falls in house prices may occur. Based on the comments in these minutes, such an outcome is likely to lead to further downward revisions in the RBA’s forecasts.
Conclusion
The minutes note that financial market pricing implied that the Australian cash rate was expected to remain unchanged for a considerable period with some expectation of a decrease by late 2019.
Over most of last year when markets; the RBA, and most economists were forecasting higher rates, Westpac’s view was consistently that rates would remain on hold in 2019 and 2020. That was largely because our growth, inflation and employment forecasts did not justify higher rates. As discussed, our current forecasts remain lower than those of the RBA and we therefore expect that, over time, the RBA will further revise down their forecasts.
However we do not think that those downward revisions will be sufficient to trigger a rate cut. As usual, our forecasts will continue to be reviewed.
GBP/USD Rebound Reaching Crucial Juncture
Key Highlights
- The British Pound corrected higher and broke the 1.2850 resistance against the US Dollar.
- There is a crucial bearish trend line formed with resistance at 1.2970 on the 4-hours chart of GBP/USD.
- UK’s Rightmove House Price Index for Feb 2019 increased 0.2% (MoM), less than the last +0.4%.
- The UK Claimant Count figure for Feb 2019 will be released today, which could change by 2.4K.
GBPUSD Technical Analysis
The British Pound found support near the 1.2770-1.2780 zone after a significant decline against the US Dollar. The GBP/USD pair started a decent rebound and corrected above 1.2850 and 1.2900.
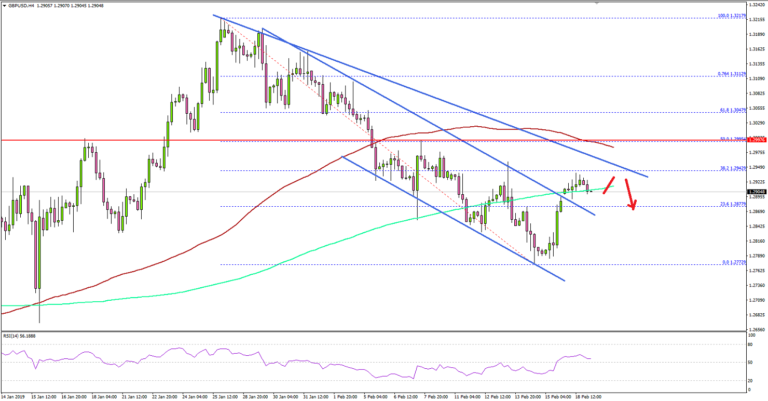
Looking at the 4-hours chart, the pair traded as low as 1.2772 and later recovered above the 23.6% Fib retracement level of the last decline from the 1.3217 high to 1.2772 low. The pair also broke a connecting bearish trend line at 1.2890 on the same chart.
The upward move was strong as the pair surpassed the 1.2900 resistance and the 200 (green) simple moving average (4-hours). However, there is a strong resistance formed near the 1.2970-1.2980 zone.
There is also a crucial bearish trend line formed with resistance at 1.2970. Above the trend line, the main resistance is 1.3000 and the 50% Fib retracement level of the last decline from the 1.3217 high to 1.2772 low.
Therefore, the GBP/USD pair is likely to face a strong resistance near the 1.2970 and 1.3000 levels. A successful close above 1.3000 could start a strong uptrend towards 1.3100 and 1.3150 in the near term. Alternatively, if buyers fail near 1.2970 or 1.3000, the pair could restart its decline back towards 1.2850 and 1.2800.
Looking at the other major pairs, EUR/USD succeeded in clearing the 1.1315 resistance, but it could struggle near 1.1350 and 1.1360. AUD/USD also rebounded recently and broke the 0.7120 resistance area.
Economic Releases to Watch Today
UK Claimant Count Change Feb 2019 – Forecast 2.4K, versus 20.8K previous.
UK ILO Unemployment Rate Dec 2018 (3M) – Forecast 4.0%, versus 4.0% previous.
German ZEW Business Economic Sentiment Index Feb 2019 – Forecast -13.4, versus -15.0 previous.
Daily Markets Broadcast
Wall Street edges higher on trade hopes
US indices traded marginally higher yesterday, with activity muted due to the President’s Day holiday. Oil prices extended recent gains on supply-side curbs.
US30USD Daily Chart
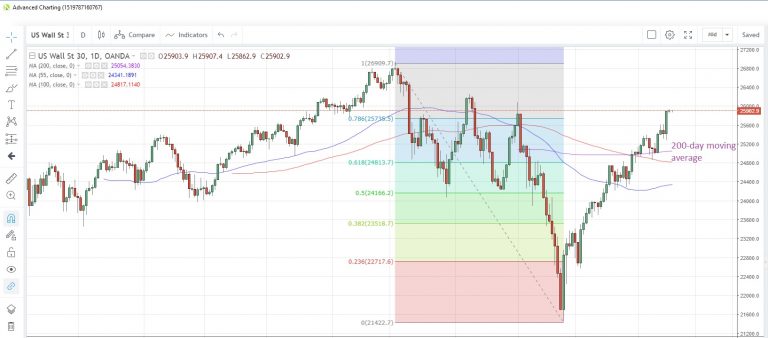
The US30 index extended recent gains to the highest since December 3, eking out small gains on the day
The next resistance point could be the December high of 26,085. The 200-day moving average at 25,054 may act as near-term support
US Commerce Dept sent report to White House on 25% automobile tariffs. President Trump now has 90 days to make a final decision. There are no tier-1 data releases scheduled for today.
DE30EUR Daily Chart
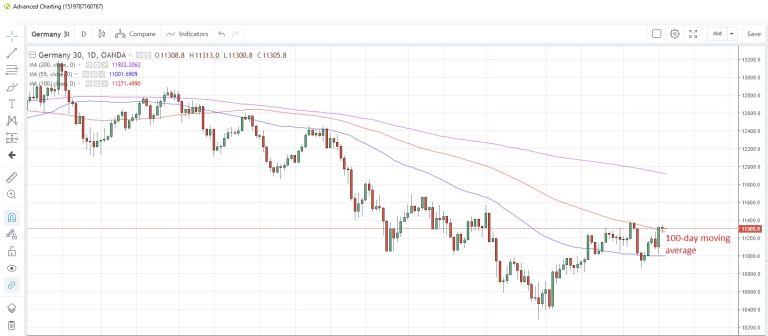
The Germany30 index posted minor gains yesterday, taking its cue from the Asian session. There were no economic data releases to drive direction and it was quiet on the Brexit front
The index consolidated its move above the 100-day moving average at 11,271, closing above it for the second day in a row. The next resistance level could be the high from earlier this month at 11,392
German ZEW surveys for February are due today. The current situation index is seen falling to 20.0 from 27.6 while the more forward-looking economic sentiment index is expected to improve marginally to -13.4 from -15.0.
WTICOUSD Daily Chart
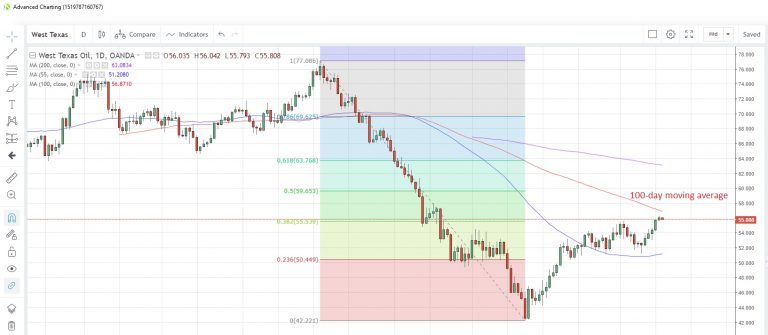
Crude oil prices advanced for a fifth straight day yesterday, bolstered by OPEC+ supply cuts and supply-limiting sanctions on Venezuela
Prices are eyeing the 100-day moving average at $56.87. This average has capped prices since October 22
The American Petroleum Institute issues its weekly oil stocks data as at February 15 later today. Last week showed the first drawdown of inventories in four weeks.
Trade Talks: Optimism Or Cataclysm?
Trade talks: optimism or cataclysm?
The Asian and European stock markets rose yesterday with China a stand-out, climbing over 3% as markets set multi-month highs. Oil also rose in Asia before giving back most of its gains, following on from a strong performance from Wall Street on Friday. And the source of all this optimism? The anticipation of substantial progress in the US-China trade talks.
The rallies were impressive given the talks ended last week without any concrete results and have yet to even recommence in Washington this week due to the US public holiday. Without sounding like a damp squib, there is now a vast amount of “optimism” baked into currency, stock and energy market prices globally and precisely zero concrete detail. The unwind, should no deal be struck, could be very ugly.
US trading fizzled out after the European close, which implies a quiet start for the regional markets today. The data calendar is very light with only the Philippines Balance of Payments and the German ZEW Survey to set traders’ pulses racing. The second half of the week sees the pace quicken with short-term moves today likely dictated by headlines rather than data.
FX
The US dollar gave up more of its recent gains in listless quiet trading driven by position lightening on a US holiday rather than a sentiment change. That theme will likely continue in the regional markets today given the lack of drivers from Wall Street.
One standout has been the Thai baht, which rallied strongly yesterday following a stellar 4.10% GDP print. The THB has been on a flyer against the dollar over the last two weeks and now sits at 31.235 this morning, just above strong technical support at 31.170. A break of this level implies more strength ahead for the THB.
Equities
With Wall Street closed, we anticipate a tranquil day in Asia with the positive underlying tone to continue. And with a lack of direction, headlines could cause short-term volatility as we await the main events of the second half of the week.
Oil
As with equities, we expect the bullish tone to continue when it comes to oil, but with the US away, trading will be subdued.
Gold
Gold climbed USD6 overnight to nine-month highs at USD1,326 an ounce. This is likely a dollar story as gold benefited from the lightening of long dollar positioning globally. That said, gold is now testing resistance in these price regions, and the technical picture remains extremely constructive for higher prices going forward.
Eco Data 2/19/19
[php_everywhere instance="1"]
British Pound Edges Higher, Investors Eye UK Wage Growth
GBP/USD has lost ground in the Monday session. In North American trade, the pair is trading at 1.2928, up 0.30% on the day. On the release front, British Rightmove HPI improved in February, with a gain of 0.7%. There are no U.K. or U.S. events on Monday, and U.S. banks are closed for a holiday. On Tuesday, the U.K. releases wage growth and unemployment claims.
The pound is under pressure, as the currency posted its third successive weekly loss. The slide would have been even worse, if not for an unexpectedly strong retail sales report on Friday. The January reading rebounded with a strong gain of 1.9%, after a decline of 0.7% in December. However, other key indicators disappointed, raising concerns about the U.K. economy. British CPI slowed to 1.8% in January, falling below the 2.0% level for the first time since January 2017. Inflation has now dropped for three successive months. This was underscored by soft GDP data earlier in the week. GDP for Q4 slowed to 0.2%, and the monthly GDP reading for December has raised alarm bells, with a decline of 0.4%. The British pound is down 1.4% in February, as nervous investors shake their heads over the turmoil surrounding Brexit. Prime Minister May and her European counterparts have all said they don’t want to see Britain crash out of the EU without a deal, but that seems to be the extent of any consensus between London and Brussels.
Is the U.S. economy slowing down? There are concerns about the strength of the economy, after soft consumer data in January. Retail sales and core retail sales showed sharp contraction, and these numbers came on the heels of soft inflation indicators. Inflation remains low, despite a strong labor market. CPI showed no change in January and has failed to post a gain since November. Core CPI has recorded weak gains of 0.2% for four successive months. On an annualized basis, CPI gained 1.6% in January, the weakest year-over-year gain since mid-2017. The soft inflation numbers were a result of low energy prices, which fell 3.1% in January as oil prices remain under pressure.
Gold resume upside, but should top below 1380 on bearish divergence
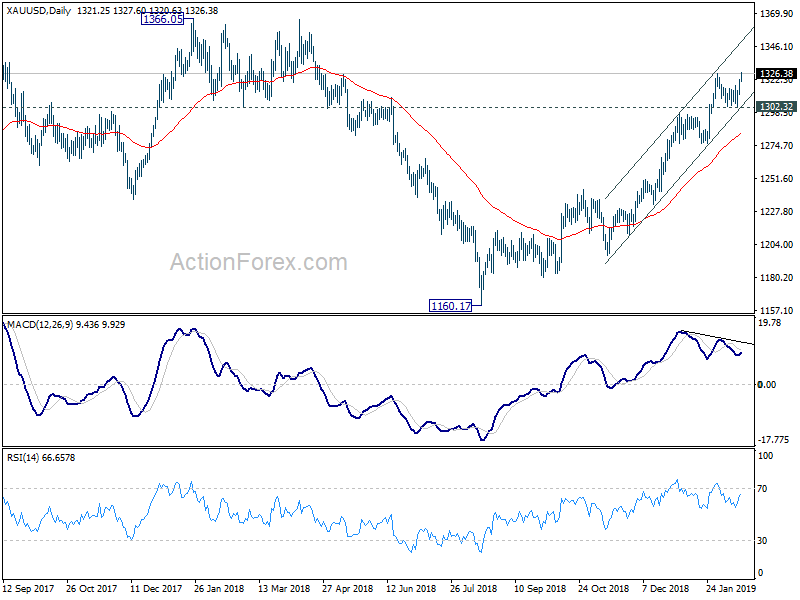
Gold's recent up trend from 1160.17 (2018 low) resumed today by breaking 1326.25 and reaches as high as 1327.60 so far. Near term outlook will now remain bullish as long as 1302.32 support holds. And current rally would target next resistance at 1366.05 (2018 high).
The question now is, whether gold is strong enough to resume the rebound from 1046.37 long term bottom (2015 low). That would imply a solid break of key fibonacci level of 38.2% retracement of 192.070 to 1046.37 at 1380.36. It tried this resistance twice since 2016 but failed.
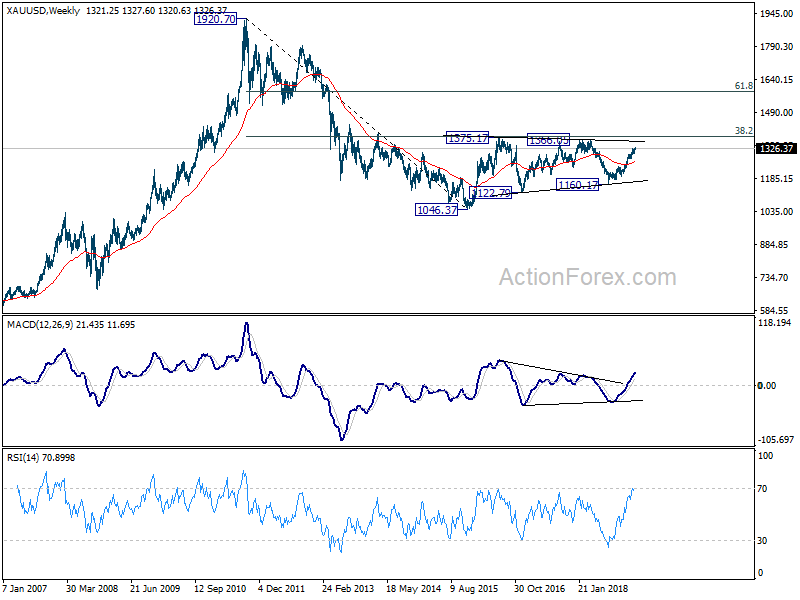
As daily MACD now displays bearish divergence condition, we'd expect another failure this time. And, even if gold is to break 1380 eventually, a near term fall back, possibly back to 55 week EMA (now at 1265.20) would likely be seen first.
That is, while current rise might extend further, we'd expect upside to be limited below 1380 handle to bring near term reversal.
WTI oil extends medium term rebound, 60 to cap upside
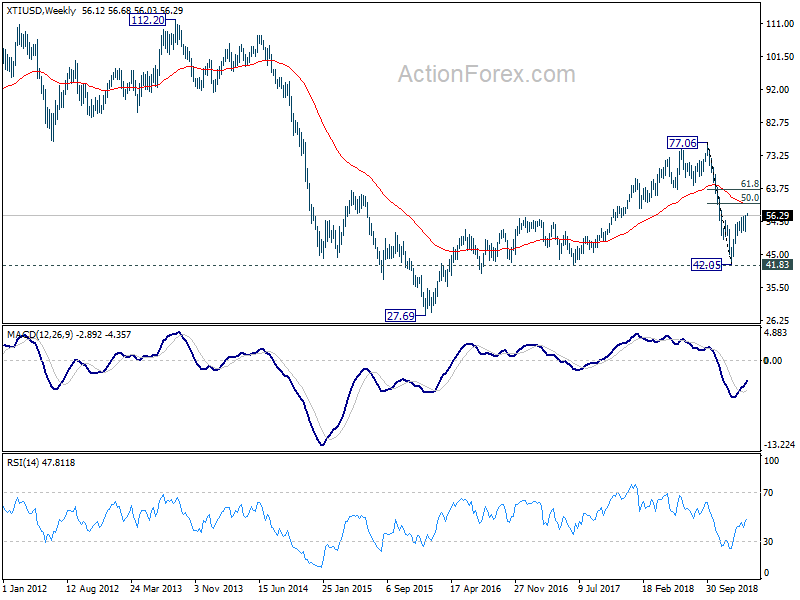
WTI crude oil's break of 55.85 resistance last week confirmed resumption of whole rebound from 42.05. Further rise is now expected as long as 54.58 support holds. Nevertheless, for now, we're viewing rebound from 42.05 as a corrective move. Hence, strong resistance will likely be seen around 61.8% projection of 42.05 to 55.85 from 51.49 at 60.01 to limit upside.
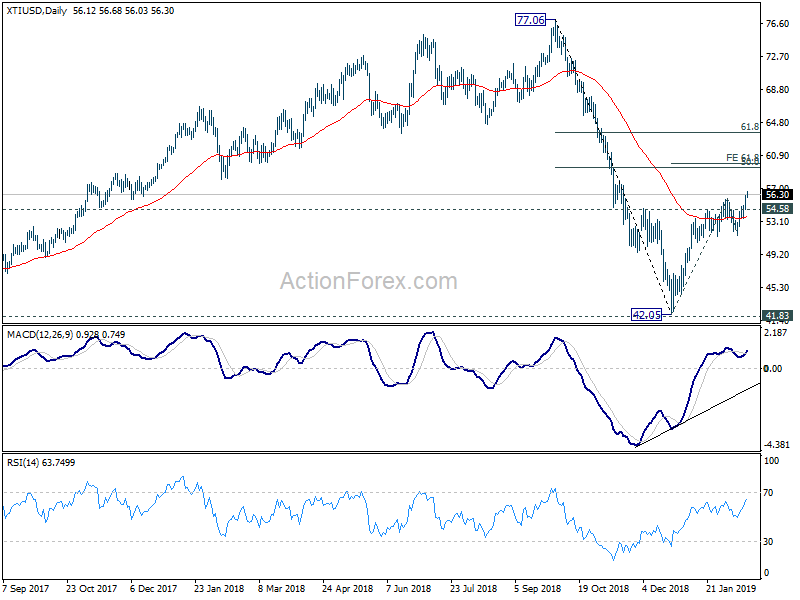
This level is actually close to 50% retracement of 77.06 to 42.05 at 59.55. 55 week EMA (now at 59.48) is also in proximity.
Japanese Yen Steady as Markets Calm at Start of Week
USD/JPY is showing limited movement in the Monday session. In the North American session, the pair is trading at 110.58, up 0.11% on the day. On the release front, Japanese Core Machinery Orders declined 0.1% in December, above the estimate of -1.1%. In December, the indicator was flat at 0.0%. In the U.S., banks are closed for a holiday and there are no U.S. events.
The Japanese manufacturing sector continues to struggle. Core Machinery Orders declined in December, following a flat 0.0% performance in November. The slowdown of China’s economy is chiefly to blame for a drop in Japan’s exports and manufacturing activity. Japanese exports of car parts and electronics to China are particularly vulnerable to the slowdown in China. There was positive news last week, as Japan’s economy grew 0.3% in the fourth quarter, after a decline of 0.6% in the third quarter. Business and consumer spending improved, helping the economy expand. Exports rose 0.9% in Q4, the strongest growth in a year. However, if the global trade war continues, Japanese growth could dramatically fall.
There are concerns about the strength of the U.S. economy, after soft consumer data in January. Retail sales and core retail sales showed sharp contraction, and these numbers came on the heels of soft inflation indicators. Inflation remains low, despite a strong labor market. CPI showed no change in January and has failed to post a gain since November. Core CPI has recorded weak gains of 0.2% for four successive months. On an annualized basis, CPI gained 1.6% in January, the weakest year-over-year gain since mid-2017. The soft inflation numbers were a result of low energy prices, which fell 3.1% in January as oil prices remain under pressure.