Sample Category Title
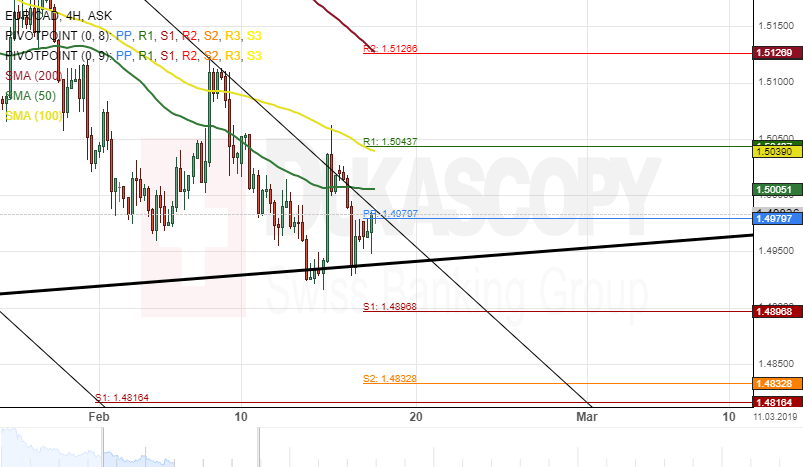
EUR/CAD 4H Chart: Decline Continues
During the last week, the single European currency has depreciated about 0.92% against the Canadian Dollar. This decline was stopped by the bottom border of a dominant ascending channel at 1.4916.
Everything being equal, it is likely that the currency exchange rate continues its decline in a junior descending channel pattern during the following trading sessions. The potential downside target will be near a support cluster formed by the weekly and the monthly PPs at 1.4832.
However, it is important to note that the weekly S1 at 1.4896 could provide support for the EUR/CAD pair in the short-term.
EUR/USD – Euro Yawns As Markets Start Week With US Holiday
EUR/USD has ticked higher in the Monday session. Currently, the pair is trading at 1.1308, up 0.12% on the day. It’s a quiet day on the release front. There are no data events out of the eurozone. In the U.S., banks are closed for a holiday, so there are no U.S. indicators until Tuesday. Traders can expect a quiet session on Monday. On Tuesday, German ZEW economic sentiment, which has been in deep freeze for months, is expected to improve to -14.1 points.
Economic activity in the eurozone remains weak, which has weighing on the euro. EUR/USD dipped to 1.1249 on Thursday, its lowest level since mid-November. On Thursday, Germany and the eurozone released fourth-quarter GDP data, and the numbers were a disappointment. German Preliminary GDP was flat at 0.0%, after a decline of 0.2% in the third quarter. The eurozone’s largest economy managed to avoid a technical recession, which is two consecutive declines in quarterly growth. Germany’s manufacturing industry is limping, with factory orders and industry production posting declines in December. Eurozone Flash GDP remained stuck at 0.2%, shy of the forecast of 0.3%. On an annualized basis, fourth quarter growth was 0.9% in Germany and 1.2% in eurozone, both weaker than the third quarter numbers. If eurozone and German data continues to sag, traders can expect the euro to lose ground in the near term.
Is the U.S. economy slowing down? There are concerns about the strength of the economy, after soft consumer data in January. Retail sales and core retail sales showed sharp contraction, and these numbers came on the heels of soft inflation indicators. Inflation remains low, despite a strong labor market. CPI showed no change in January and has failed to post a gain since November. Core CPI has recorded weak gains of 0.2% for four successive months. On an annualized basis, CPI gained 1.6% in January, the weakest year-over-year gain since mid-2017. The soft inflation numbers were a result of low energy prices, which fell 3.1% in January as oil prices remain under pressure.
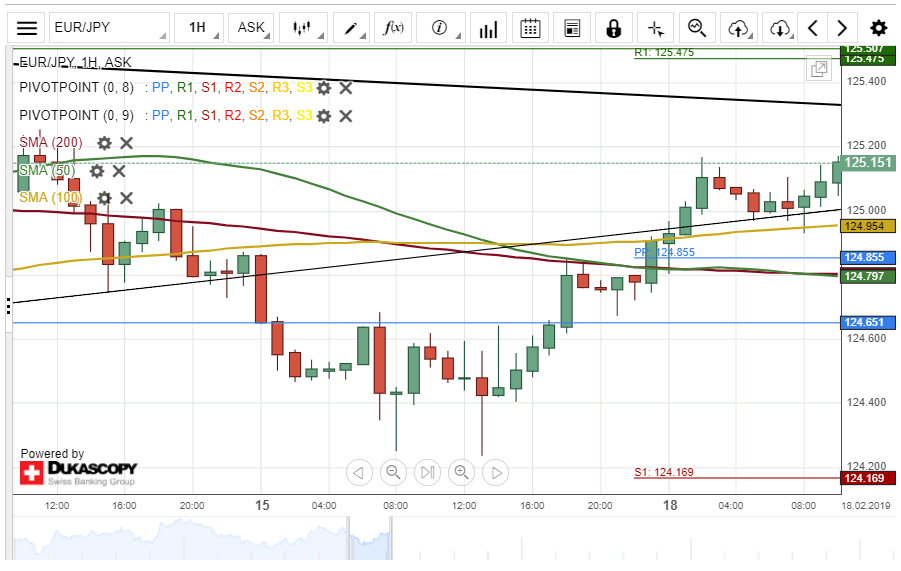
EUR/JPY Testing 100-Hour SMA
The single European currency has appreciated about 92 base points against the Japanese Yen since January 15. The currency pair breached both the 50-, 100– and 200-hour SMAs during Friday's trading session.
The exchange rate is currently testing a support level formed by the 100-hour simple moving average at 124.94.
If this support level holds, bullish traders will try to target a swing high of 125.47 within this session.
On the other hand, if the currency exchange rate passes the 100-hour SMA, a decline towards the 124.40 mark could be expected.
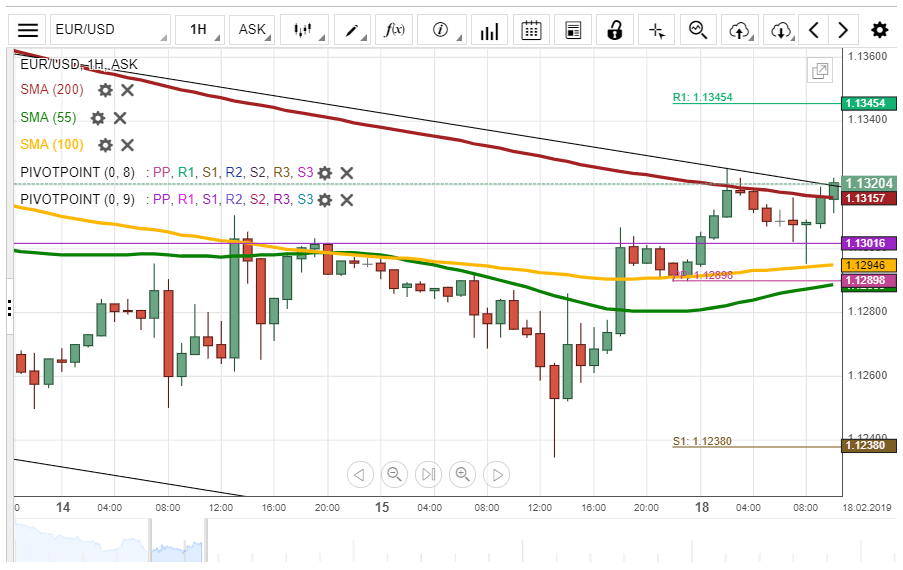
EUR/USD Trades Above Monthly S1 At 1.1301
During Friday's trading session, the European Single Currency was resisted by the 55-hour simple moving average to pass the support level of the weekly S1 at 1.1238. On Monday morning, the rate was trading between the 200-hour SMA and the monthly S1 at the 1.1305 mark.
It is expected that the currency exchange rate will trade sideways between the 55-hour and the 200-hour simple moving averages to stay at the 1.2800 level.
On the other hand, the resistance of the 200-hour SMA could push the rate to pass through most of the technical indicators to the 1.1260 level.
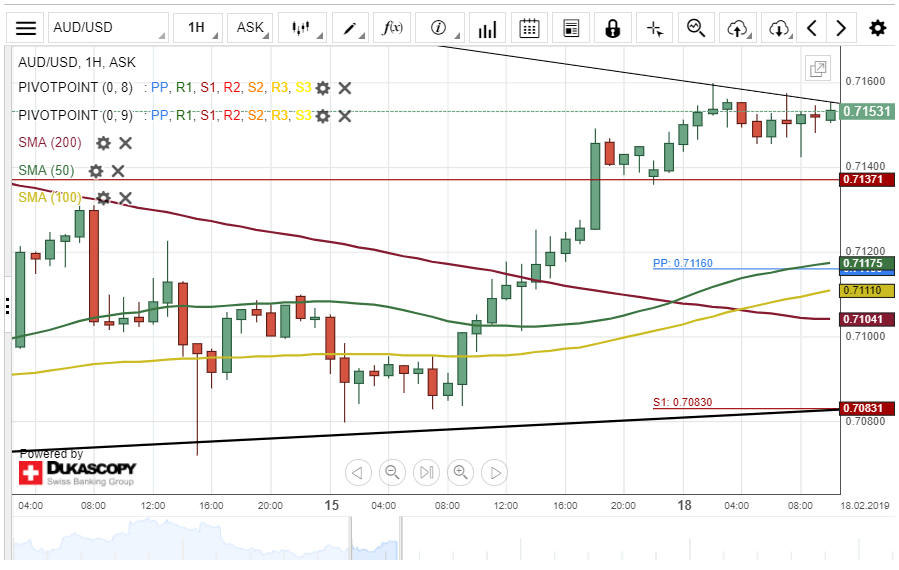
AUD/USD Likely To Edge Lower Today
The Australian Dollar appreciated about 66 base points against the US Dollar on Friday. The currency pair reached a three-week high level at 0.7160 during the morning hours of today's session.
As for the near future, it is likely that the AUD/USD exchange rate edges lower toward a support cluster formed by the monthly pivot point and the combination of the 100– and 200-hour SMAs at 0.7109.
If this support cluster as mentioned above holds, the currency exchange rate will continue its gradual upside movement during the following trading sessions.
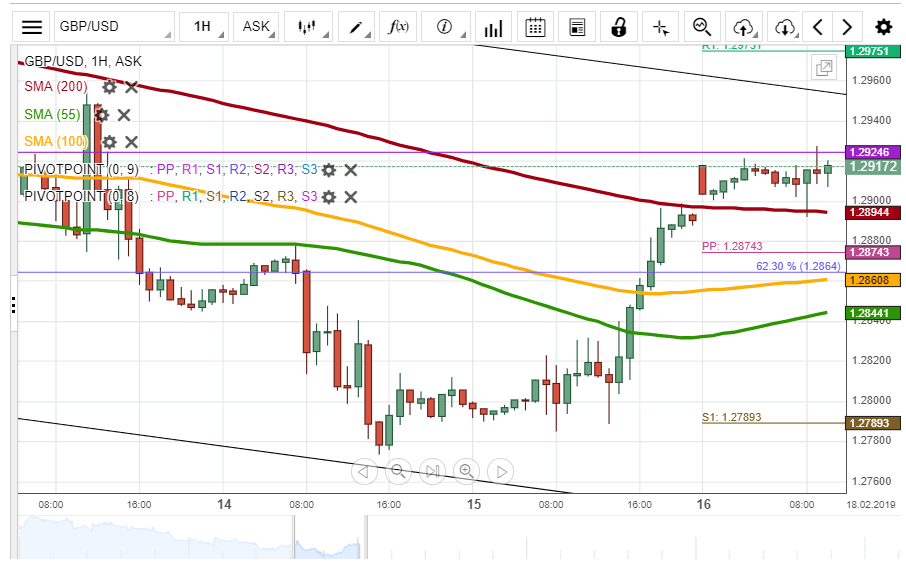
GBP/USD Is Supported By 200-Hour SMA
During the previous trading session, the British Pound has appreciated against the US Dollar to break through most of the technical indicators to end the trading session at 1.2901. On Monday morning, the rate was located between the monthly PP and the 200-hour SMA at the 1.2910 mark.
Most likely, the support level of the 200-hour simple moving average will support the currency exchange rate to push it to break the resistance of the monthly PP at 1.2924. In this case, the rate will be trading at the 1.2900 level.
On the other hand, the resistance of the monthly PP at 1.2924 could resist the rate to pass through the support level of the 200-hour SMA to trade near the weekly PP at the 1.2874 mark.
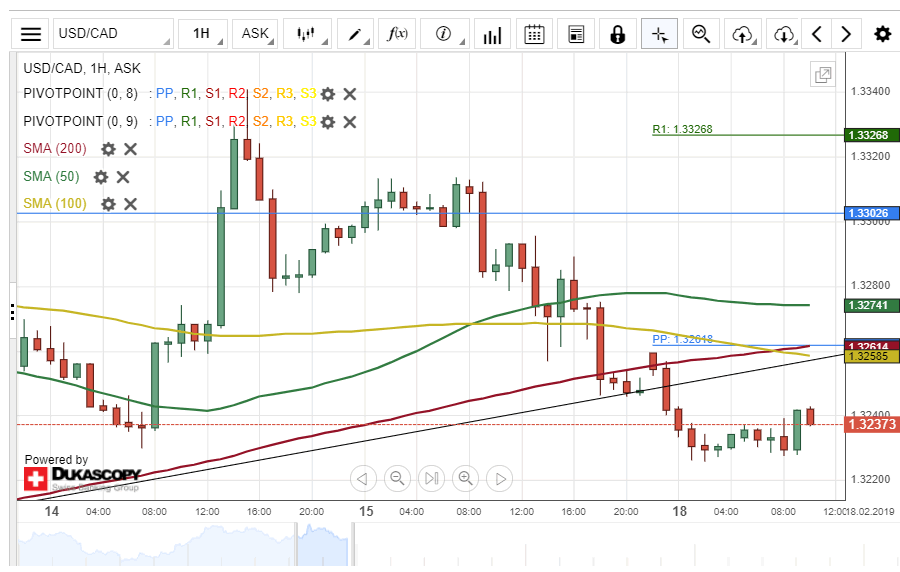
USD/CAD Breakout Occurs
During the past 24 hours of trading, the US Dollar has lost about 0.64% in values against the Canadian Dollar. The currency pair breached the lower boundary of an ascending channel pattern during the Asian session on Monday.
Given that a breakout had occurred, it is likely that the exchange rate continues its decline within this session. Bears could push the USD/CAD currency pair towards the 1.3200 mark.
Although, the currency exchange rate could reserve from the current price level and aim for a re-tests of the lower boundary of the channel pattern at 1.3251 within this session.
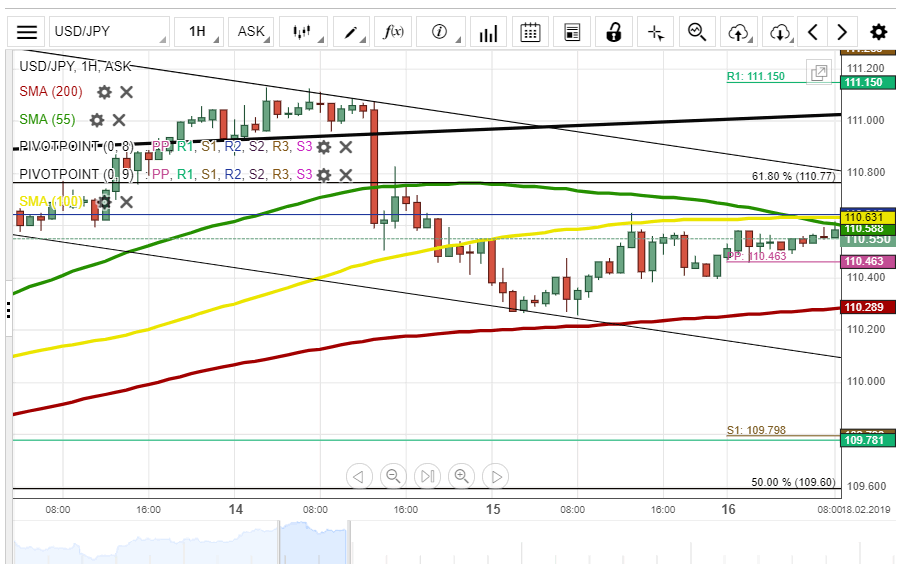
USD/JPY Could Surge To 61.80% Fibo
During the previous trading session, the currency exchange rate was trading sideways at the 110.00 level as it was predicted. On Monday morning, the rate was resisted by the 55-hour SMA at the 110.59 mark.
In regards to the near-term future, it is expected that the 55-hour simple moving average will support the rate to help it to break the resistance level of the 100-hour SMA. In this case, the rate will surge to the 61.80% Fibo at 110.77.
On the other hand, the resistance levels of the 55-hour and the 100-hour SMAs could resist the rate to the weekly pivot point at 110.46.
NZD/USD Set For Breakout
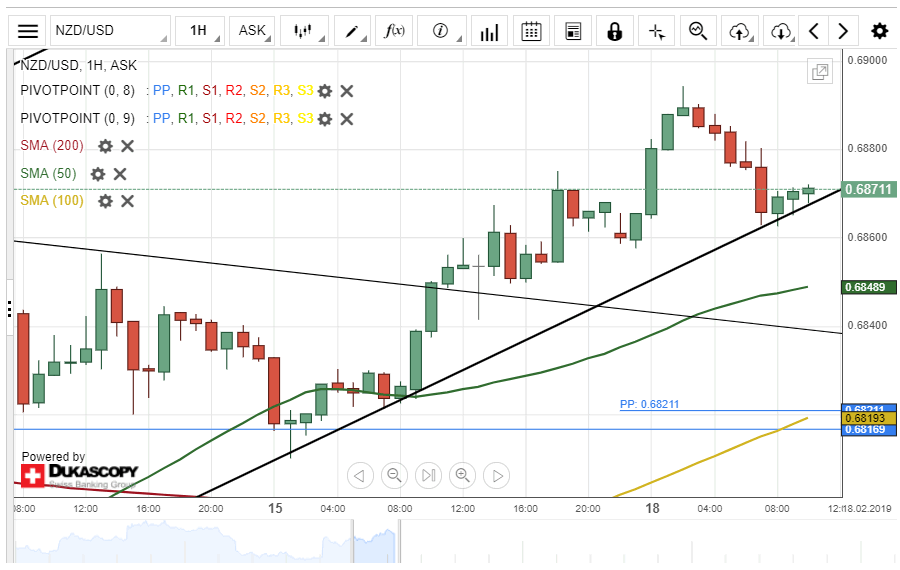
The New Zealand Dollar appreciated about 62 base points against the US Dollar on Friday. The 50– hour simple moving average provided support for the currency pair at 0.6821 during Friday's session.
Everything being equal, it is likely that the NZD/USD exchange rate decline towards a support cluster formed by the combination of the weekly, the monthly PPs and the 100-hour SMA at 0.6816.
However, technical indicators suggest otherwise. Technical sentiment demonstrates that the currency exchange rate will continue to trade in a junior ascending channel within this session.
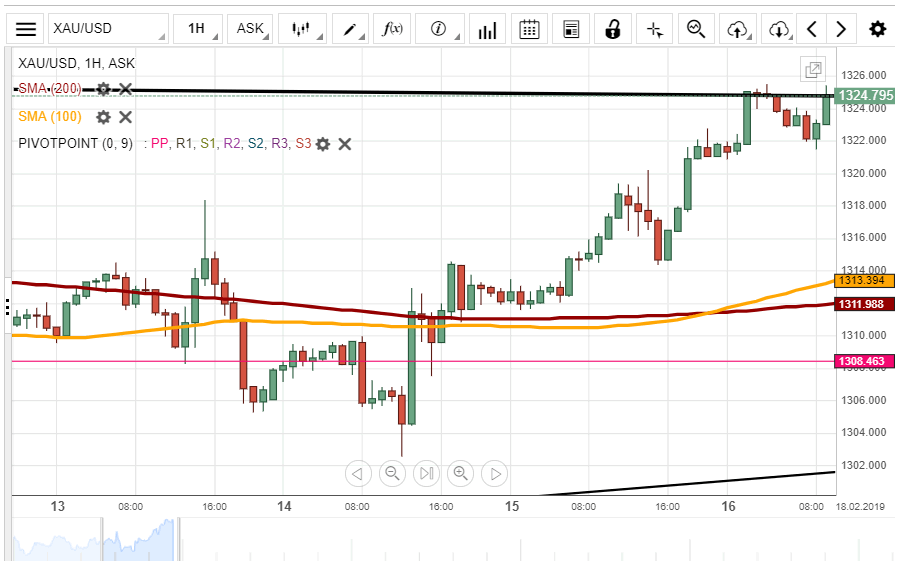
XAU/USD Surges To Dominant Pattern At 1,326.22
During Friday's trading session, the yellow metal has been appreciating against the US Dollar to end the trading day at 1,321.12. On Monday morning, the gold was located at the 1,323.56 mark.
In regards to the near-term future, most likely, the yellow metal will continue appreciating against the US Dollar to break the dominant pattern line at 1,326.22.
On the other hand, the dominant pattern line could resist the rate to trade at the 1,310.00 level.