Sample Category Title
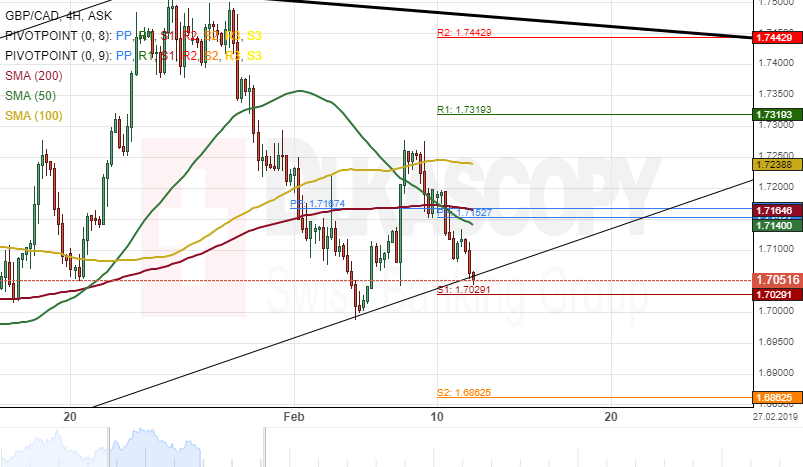
GBP/CAD 4H Chart: Set For Breakout
The British Pound has appreciated over 1.60% in values against the Canadian Dollar since February 5. The exchange rate reversed from a swing high of 1.7275 during last week's Friday trading session.
As apparent on the 4(H) chart, the currency pair is currently moving towards the lower boundary of a junior ascending channel at 1.7029.
If the GBP/CAD currency exchange rate passes a support level formed by the bottom border of the channel, the general direction is expected to remain downward.
However, if the support level as mentioned earlier holds, the next upside target for the pair will be near the weekly R1 at 1.7319.
Brexit Coming In Hot
Brexit is going down to the wire. We are hurtling towards 29 March with scant evidence the EU-UK are closer to resolution. Political brinkmanship has damaged GBP (although Euro has not performed well either), with traders selling upticks and buying low volatility.
Today UK Prime Minister Theresa May will brief the House of Commons on the progress of Brexit negotiations. We are doubtful of any breakthrough. May is expected to announce a meaningful vote for 27 February, but that is unlikely to appease anyone. Remainers need a new trick, since the last vote – a huge loss for May – failed to upset the political order. European Union Brexit negotiator Michel Barnier suggested that May endorse a permanent customs union, also supported the UK opposition Labour Party.
The UK economy is clearly weakening. Sharp declines in investment are victims of Brexit uncertainty. This is just common sense. UK Q4 GDP declined 0.2%, down from +0.6% in the Q3. For 2018, GDP growth slipped to its lowest since 2012, at 1.4%, slowing from 1.8% in 2017. Given a similar slowdown in Europe, it is hard to say how the UK would have performed without the spectre of Brexit. Italian growth forecasts have been reduced from 1.2% to a paltry 0.2%.
Sino-US tariffs postponed?
Trade talks resumed on Monday and appear to be on a good track. Mid-level officials have opened discussions while high-ranked officials should take the lead on Thursday and Friday, including US Trade Representative Robert Lighthizer, US Treasury Secretary Steven Mnuchin and Chinese Vice Premier Liu He. We suspect progress could trigger a Trump–Xi meeting by mid-March with US tariffs being postponed. USD/CNY is currently trading at 6.7798, approaching 6.7745 short-term.
Consumption in China is at its lowest in 15 years and trade data shows clear signs of weakness. January imports fell 10%, the biggest drop since July 2016. China’s economy could be slowing more sharply than initially thought, although Lunar New Year holidays probably hit January and February activity. The Sino-American trade conflict might be weakening manufacturing and trade figures, but the drop in domestic demand plays a bigger role, forcing authorities to boost domestic demand by reducing import tariffs and providing liquidity stimulus.
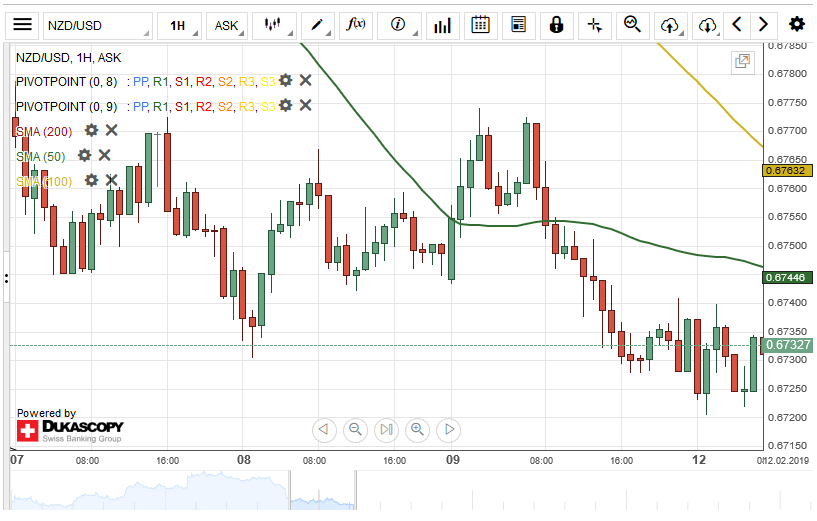
NZD/USD Likely To Decline
The New Zealand Dollar depreciated about 50 base points against the US Dollar on Monday. The currency pair breached the 50-hour simple moving average during yesterday's trading session.
As for the near future, it is likely that the currency exchange rate will continue its movement in a medium-term descending channel pattern. Technical indicators suggest that the pair could target a support cluster formed by the weekly and the monthly PPs at 0.6683.
However, it is expected that the NZD/USD currency pair aim for the 50-hour simple moving average at 0.6745 in a short while.
EUR/JPY Bearish Signals Today
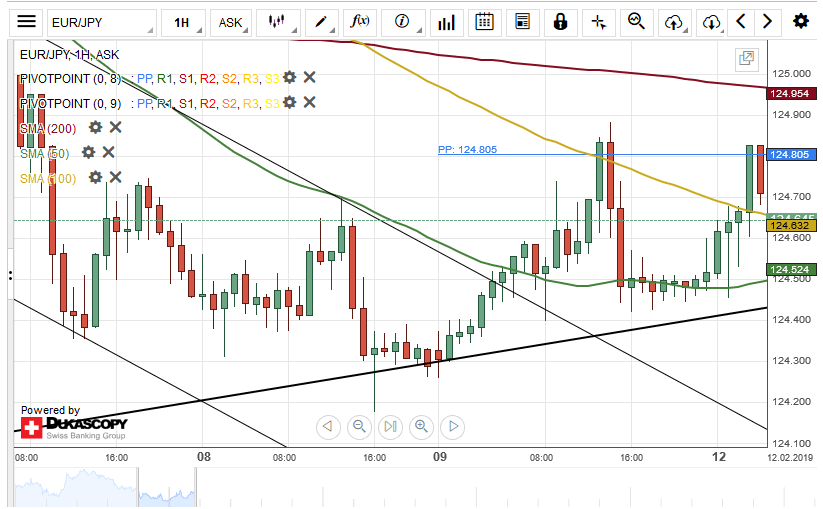
A breakout occurred through the upper boundary of a junior descending channel pattern on Monday. The single European currency gained about 0.40% in values against the Japanese Yen.
The currency pair is currently moving towards the lower boundary of an ascending trendline and could be set for a second breakout.
If the EUR/JPY currency exchange rate passes the support level formed by the lower boundary of the uptrend line at 124.40, the next level will be at a swing low of 124.18.
However, if the support level holds, the pair could aim for a test of the 200-hour SMA at 124.96 within this session.
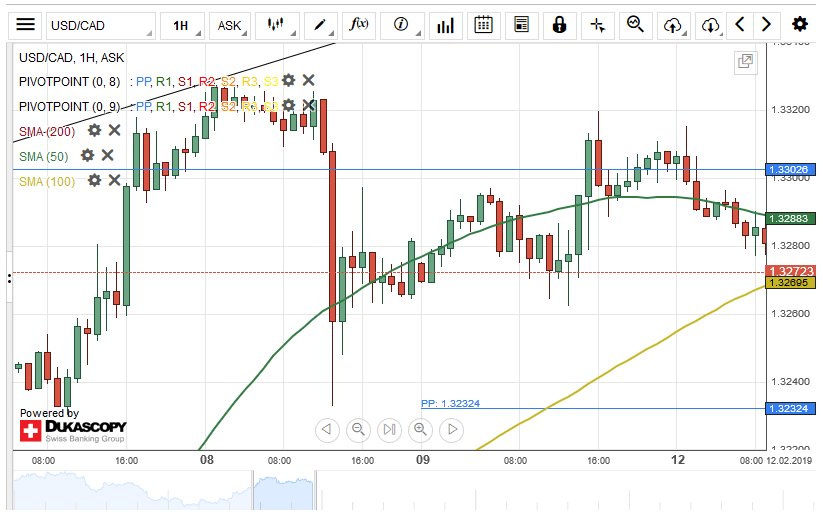
USD/CAD Stranded Between SMAs
A resistance level set by a traditional monthly pivot point near the 1.3302 area hindered the US Dollar from gaining further strength against the Canadian Dollar on Monday.
The currency pair is presently stranded between SMAs. The 50-hour simple moving average is providing resistance for the rate at 1.3289, while the 100-hour moving average is providing support at 1.3267.
Technical indicators demonstrate that the currency exchange rate will continue moving in a junior ascending channel within this session.
Most likely, the USD/CAD pair could surpass the 50-hour SMA during the following trading hours.
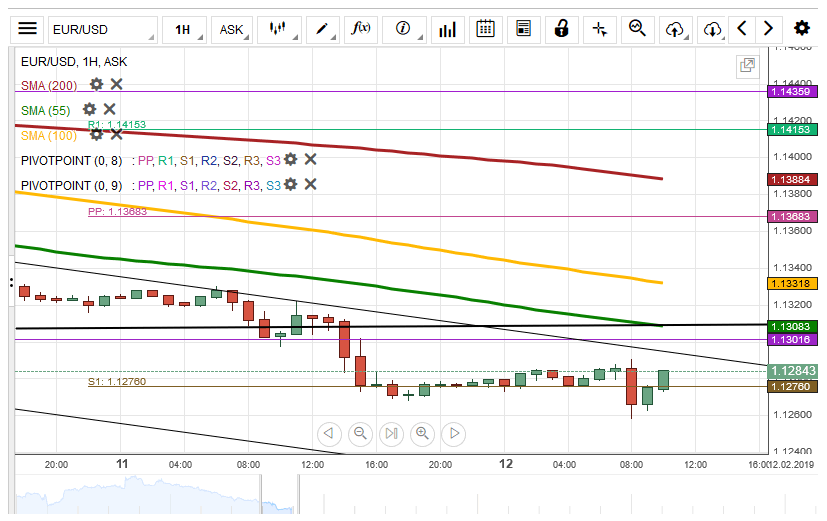
EUR/USD Passes Dominant To 1.1240
The European Single Currency passed through the support level of the dominant pattern line at 1.3106. Moreover, the rate passed through the other two technical indicators to trade at the the1.2600 mark.
In regards to the near-term future, most likely, the European Single Currency will continue depreciating against the US Dollar to the weekly S2 at 1.1229.
Meanwhile, the 55-hour and the 100-hour simple moving averages will try to catch up the rate during the day.
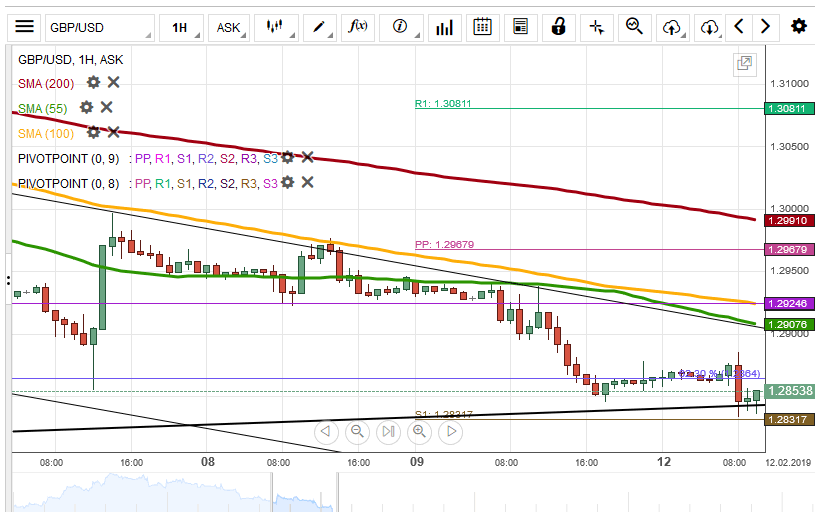
GBP/USD Aims To Pass Medium Pattern
The British Pound passed through the support of the 62.30% Fibonacci retracement level to depreciate against the US Dollar to the 1.2848 mark.
It is expected that the currency exchange rate will break the support of the medium pattern line at the 1.2845 mark to decline towards the weekly S2 at 1.2718. Besides, the 55-hour simple moving average is trying to catch up the rate to give additional resistance to the rate.
On the other hand, the weekly S1 at 1.2831 could push the rate back to the pattern to trade sideways between the 62.30% Fibo and the bottom boundary of the medium pattern line.
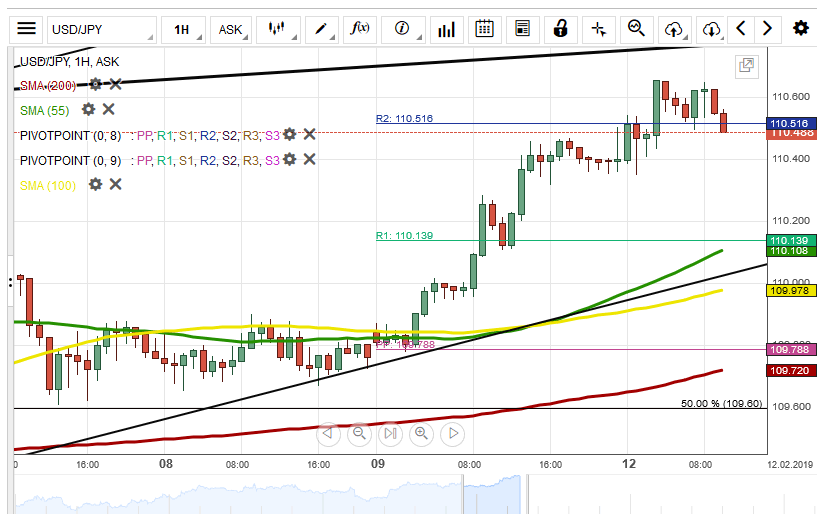
USD/JPY Jumps To 110.60
The currency exchange rate broke the resistance levels of the weekly R1 at 110.13 and the weekly R2 at 110.51 to trade at the 110.40 level.
In regards to the near-term future, most likely, the 61.80% Fibonacci retracement level at 110.77 will resist the rate to let it trade sideways at the 110.40 level for the rest of the day.
On the other hand, the USD/JPY could break the resistance of the 61.80% Fibo to trade sideways near the upper boundary of the dominant pattern line at 110.80.
XAU/USD Trades Sideways At 1,310.00
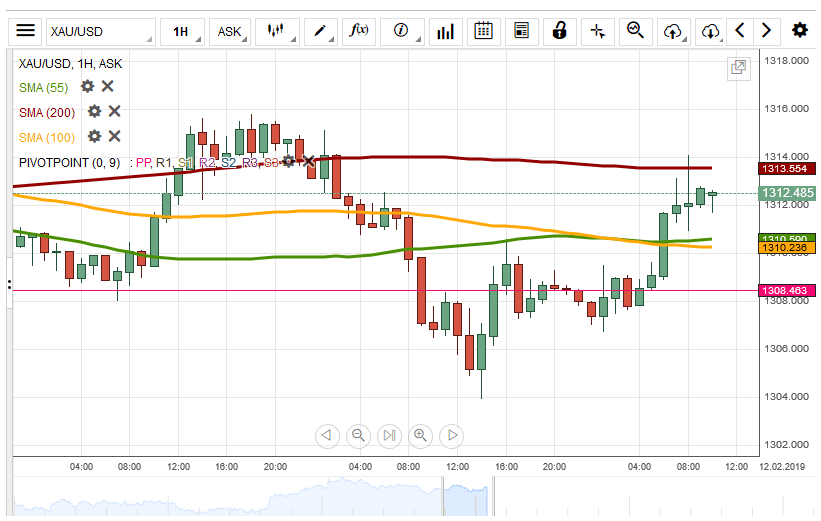
During the previous trading session, the yellow metal passed through the support level of the monthly pivot point at 1,308.46. On Tuesday morning, the gold took the support of the monthly PP to break the resistances of the 55-hour and the 100-hour simple moving averages to trade at the 1,312.80 mark.
In regards to the near-term future, most likely, the yellow metal will trade sideways between the simple moving averages at the 1,310.00 level.
On the other hand, the 200-hour simple moving average could resist the gold to push the rate to the 1,305.00 level.
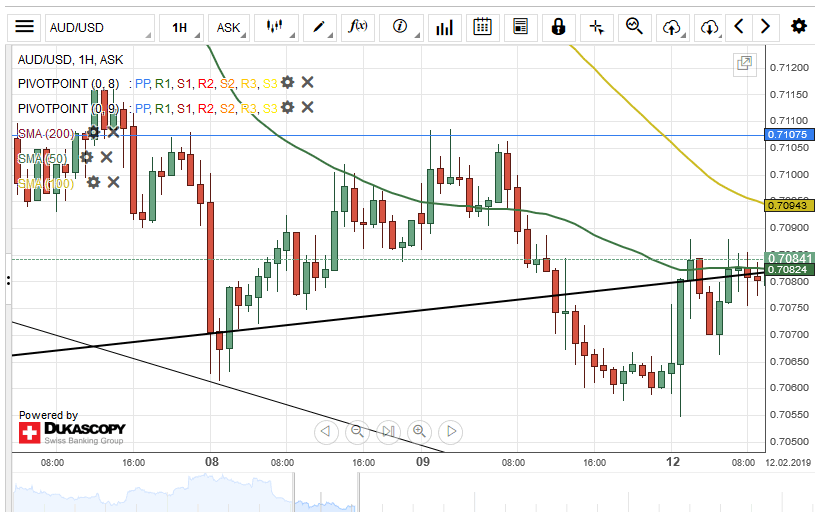
AUD/USD Two Scenarios Likely
Bearish sentiment dominated the Australian Dollar against the US Dollar on Monday. As a result, the currency pair breached the lower boundary of a medium-term ascending channel at 0.7082.
The 50-hour simple moving average was providing resistance for the exchange rate during the first half of today's trading session.
If the currency exchange rate passes the 50-hour SMA, the next upside target will be at near the weekly pivot point at 0.7139.
Although, if the resistance level as mentioned above holds, bearish traders could push the AUD/USD exchange rate towards the 0.7000 mark.