Sample Category Title
USD/JPY Expects Small Pullback In Bullish Momentum
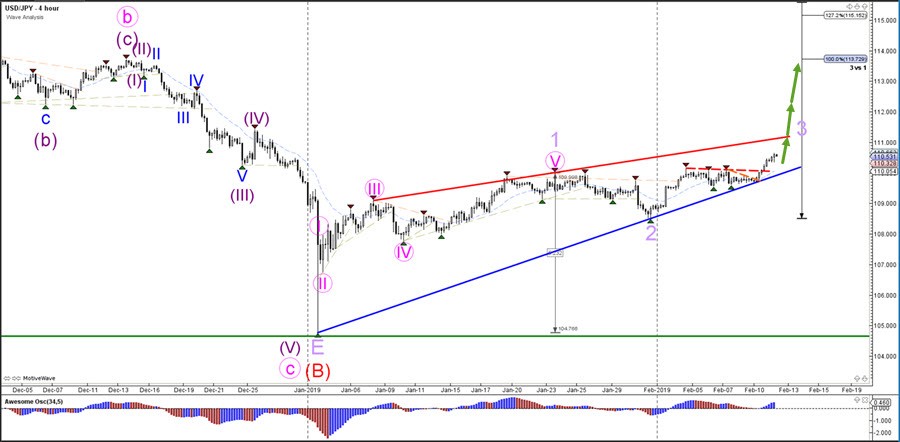
The USD/JPY bearish break below the support trend line (blue) invalidates the current wave pattern and could indicate a completion of the larger wave 1 (light purple) at the recent high.
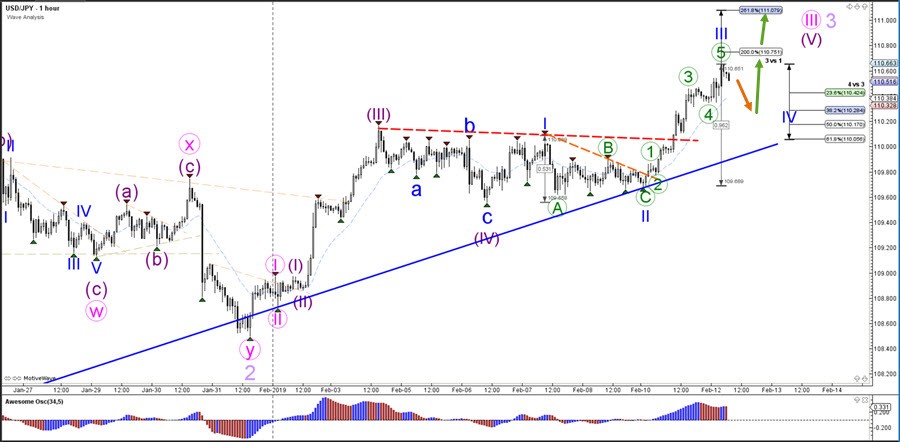
The USD/JPY is building an impulsuve breakout above the resistance trend lines (dotted) which could indicate a wave 3 (blue) pattern. An immediate bullish continuation could see price move towards the 261.8% Fibonacci target of wave 3 vs 1 whereas a retracement could see price test the Fibonacci levels of wave 4 vs 3 (blue). A bullish bounce could see price move up as part of a wave 5 (purple) in wave 3 (pink).
AUD/USD Outlook: Bears Face Headwinds From Daily Cloud And May Hold In Extended Consolidation
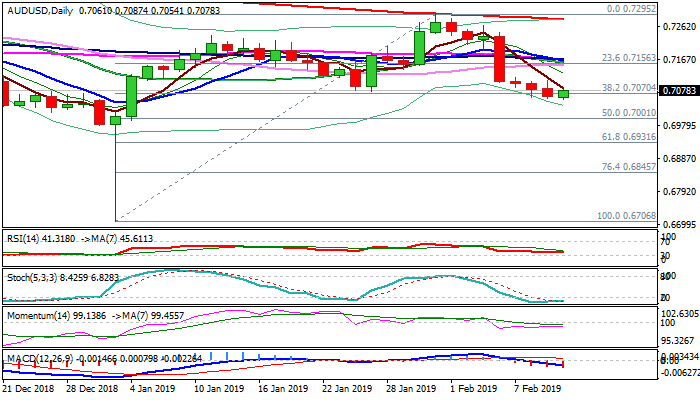
The Aussie dollar ticks higher from new over five-week low at 0.7054 and daily cloud top (0.7050) but maintains bearish bias on weak daily techs and negative signal on Monday's close below pivotal Fibo support at 0.7070 (38.2% of 0.6706/0.7295).
However, bears face headwinds from thick daily cloud and oversold daily stochastic and may hold in extended consolidation.
Falling 5SMA caps today's action, but stronger recovery and close above Monday's high (0.7107) would generate initial positive signal on formation of bullish engulfing that would keep bears on hold for stronger correction.
Cluster of daily MA's at 0.7151/67 zone marks strong barrier which should cap stronger upticks and keep bears in play.
Only sustained break here would neutralize bears and shift near-term focus higher.
Res: 0.7087, 0.7107, 0.7151, 0.7167
Sup: 0.7050, 0.7000, 0.6931, 0.6900
The Analytical Overview Of The Main Currency Pairs
The EUR/USD currency pair
Technical indicators of the currency pair:
Prev Open: 1.13191
Open: 1.12742
% chg. over the last day: -0.40
Day's range: 1.12723 – 1.12877
52 wk range: 1.1214 – 1.2557
EUR keeps showing a strong descending trend. Yesterday the quotes fell by more than 50 points. The trading instrument set the new yearly minimums and is now consolidating around 1.12700-1.13000. The currency pair has prospects for further descend. The financial market participants should keep an eye on the US/China negotiations and open positions from the key levels.
At 17:00 (GMT+2:00) the US will publish the JOLTS report. Also, check out the statements by the head of the Federal Reserve.
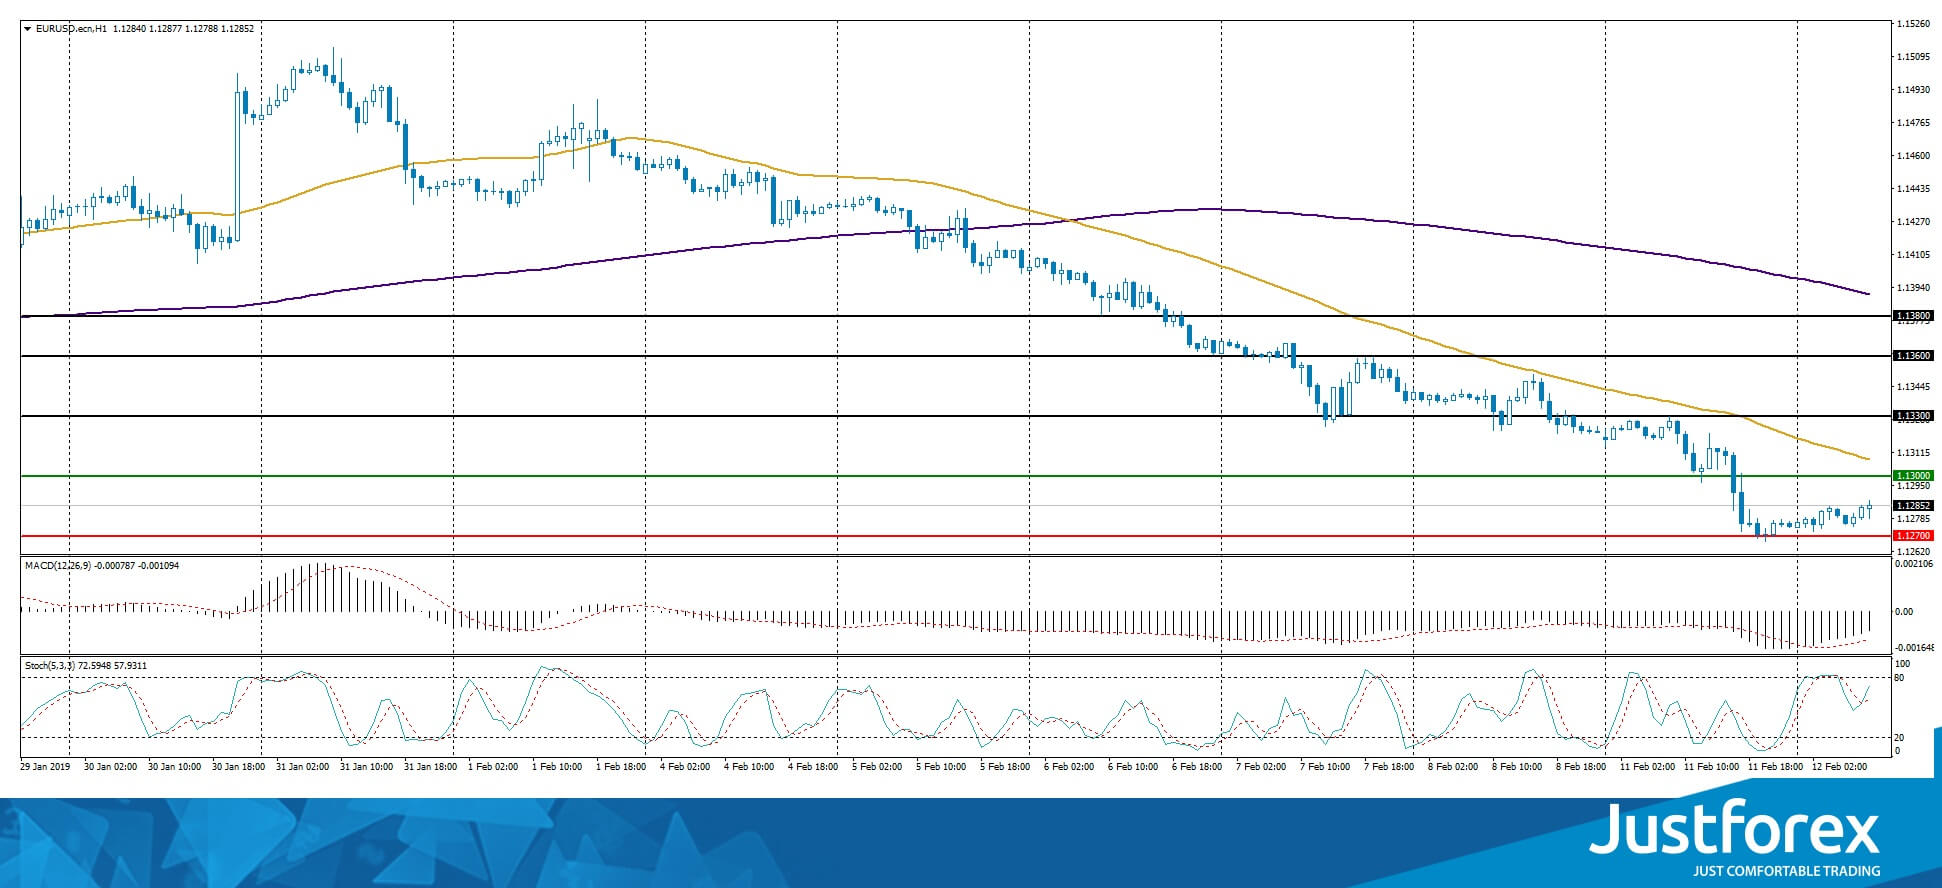
The price fixed below 50 MA and 200 MA which points to the power of the sellers.
The MACD histogram is in the negative zone but above the signal line which gives a weak signal to sell EUR/USD.
The Stochastic Oscillator is in the neutral zone, the %K line is above the %D line which points to the correction of EUR/USD.
Trading recommendations
Support levels: 1.12700, 1.12300, 1.12000
Resistance levels: 1.13000, 1.13300, 1.13600
If the price fixes below 1.12700, expect the quotes to fall further toward 1.12300-1.12000.
Alternatively, EUR/USD can correct toward 1.13300-1.13500.
The GBP/USD currency pair
Technical indicators of the currency pair:
Prev Open: 1.29289
Open: 1.28535
% chg. over the last day: -0.56
Day's range: 1.28493 – 1.28848
52 wk range: 1.2438 – 1.4378
Yesterday GBP/USD saw some aggressive sell-offs due to the weak GDP report. In the fourth quarter of 2018 the economic growth of the country fell from 0.6% (quarter-to-quarter) to 0.2%. The quotes fell by 75 points and updated the monthly minimums. An additional pressure is caused by the Brexit conundrum. Right now the quotes are consolidating around 1.28500-1.28900. You should open positions from these levels.
The Economic News Feed for 12.02.2019 is calm. You should keep an eye on the statements by the Head of the Bank of England.
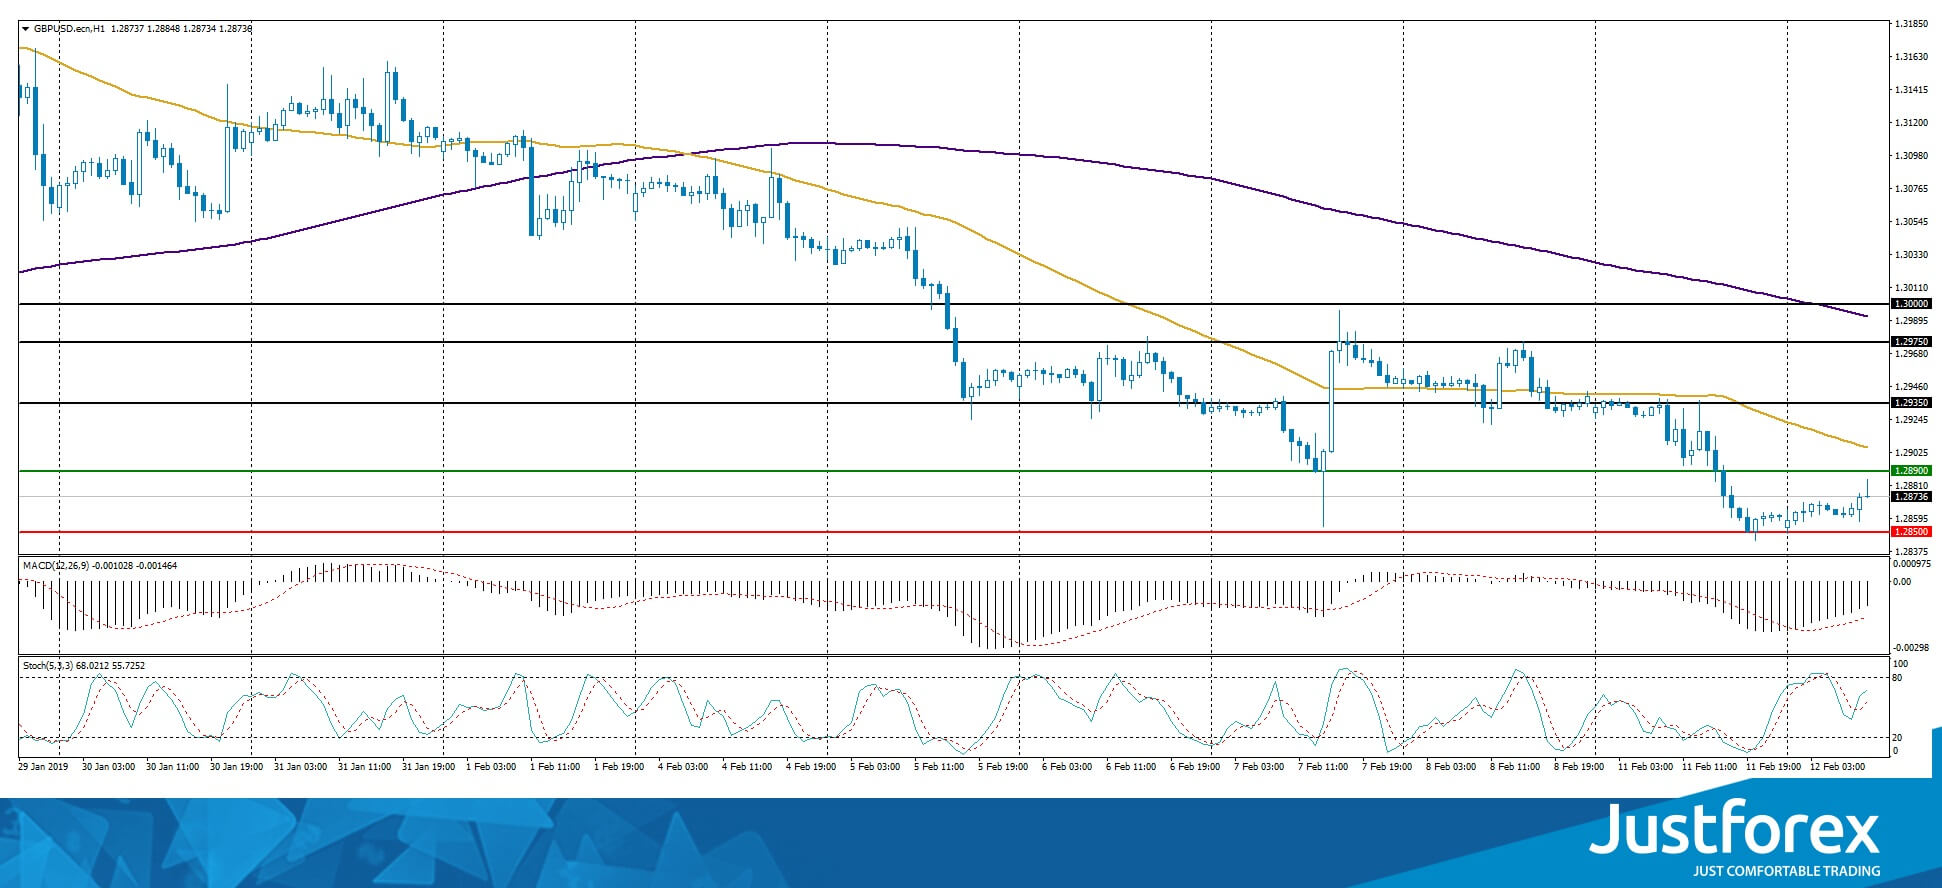
The price fixed below 50 MA and 200 MA which points to the power of the buyers.
The MACD histogram is in the negative zone but above the signal line which gives a weak signal to sell GBP/USD.
The Stochastic Oscillator is in the neutral zone, the %K line is above the %D line which points to a bullish mood.
Trading recommendations
Support levels: 1.28500, 1.28000
Resistance levels: 1.28900, 1.29350, 1.29750
If the price fixes below 1.28500, expect the quotes to fall toward 1.28200-1.28000.
Alternatively, the quotes can recover toward 1.29300-1.29500.
The USD/CAD currency pair
Technical indicators of the currency pair:
Prev Open: 1.32630
Open: 1.32941
% chg. over the last day: +0.13
Day's range: 1.32768 – 1.33145
52 wk range: 1.2248 – 1.3664
USD/CAD has an ambiguous technical picture. The quotes are in a flat with the key range being 1.32650-1.32950. The trading instruments has prospects for further correction after a long rally. Keep an eye on the oil quotes dynamics and open positions from these levels.
The Economic News Feed for 12.02.2019 is calm.
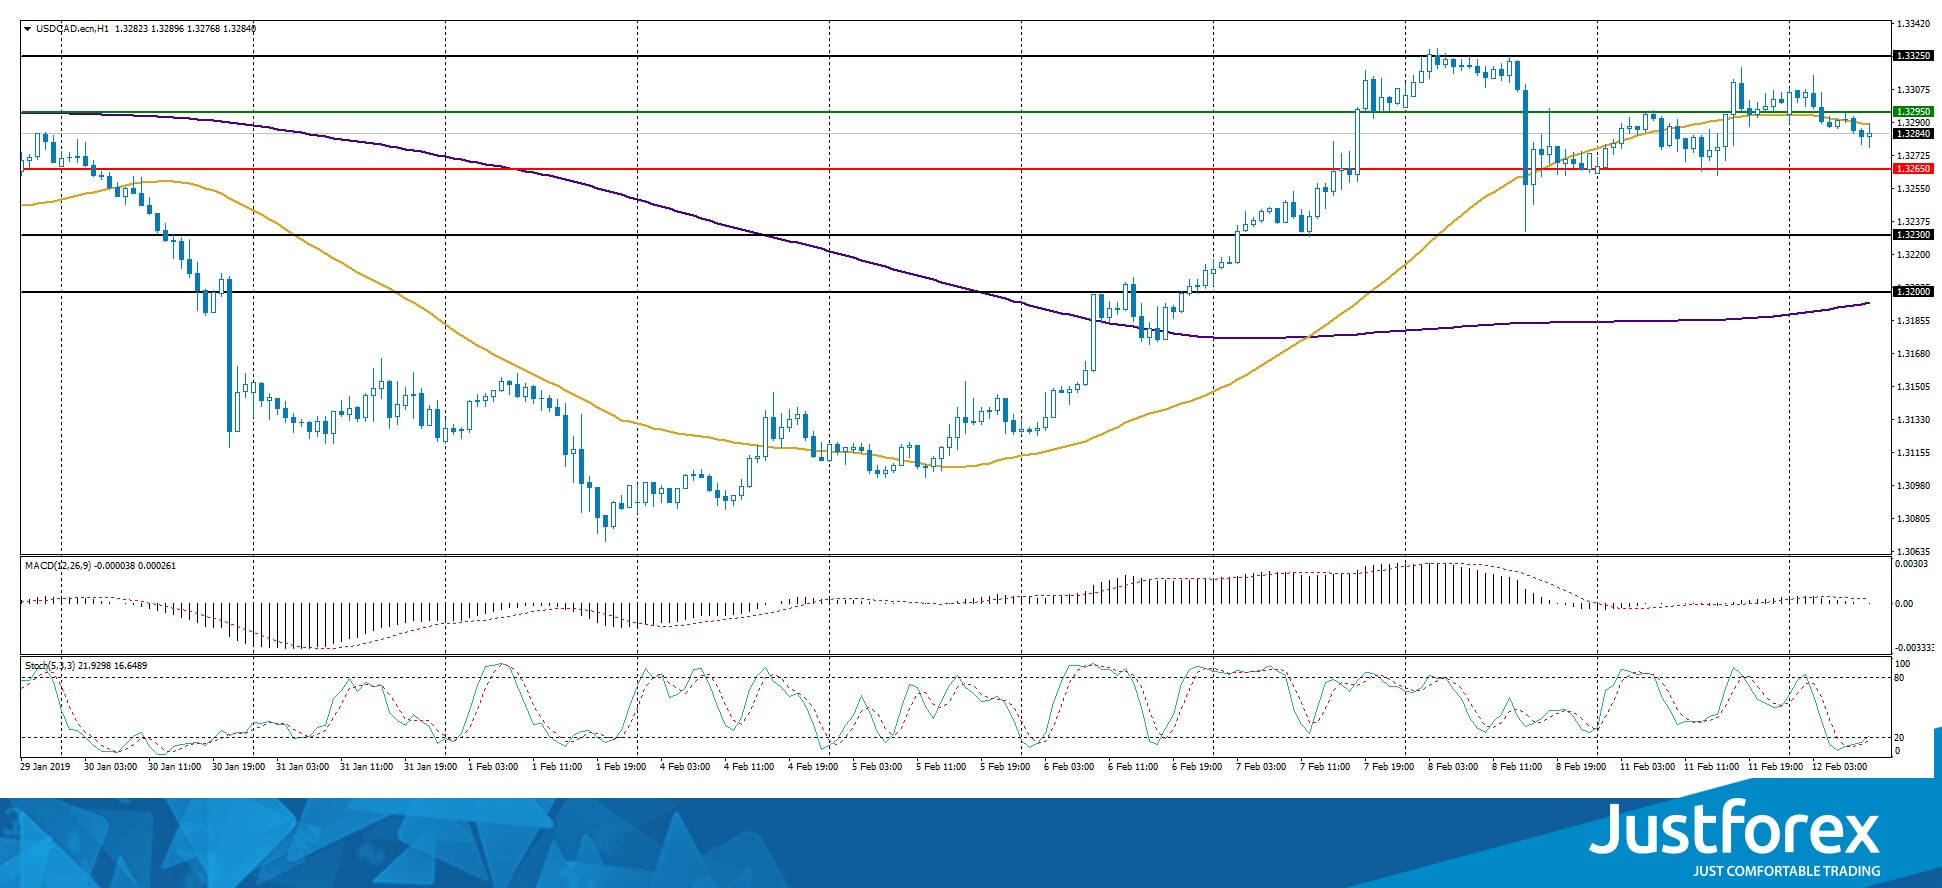
The indicators do not provide precise signals, the price has crossed 50 MA.
The MACD histogram is close to 0.
The Stochastic Oscillator is in the oversold zone, the %K line is crossing the %D line. There are no signals at the moment.
Trading recommendations
Support levels: 1.32650, 1.32300, 1.32000
Resistance levels: 1.32950, 1.33250
If the price fixes below 1.32650, expect the quotes to correct toward 1.32300-1.32000
Alternatively, the quotes can grow toward 1.33250-1.33500.
The USD/JPY currency pair
Technical indicators of the currency pair:
Prev Open: 109.736
Open: 110.333
% chg. over the last day: +0.53
Day's range: 110.333 – 110.651
52 wk range: 104.56 – 114.56
USD/JPY started to grow. During the last two days, the yen got weakened against the USD by more than 85 points. The trading instrument updated the key maximums. Right now the quotes are testing the resistance of 110.650 with 110.350 being the local support. The currency pair has prospects for further growth. Open the postions from the key levels.
During the Asian trading session, Japan published weak reports regarding the business activity in the service industry.
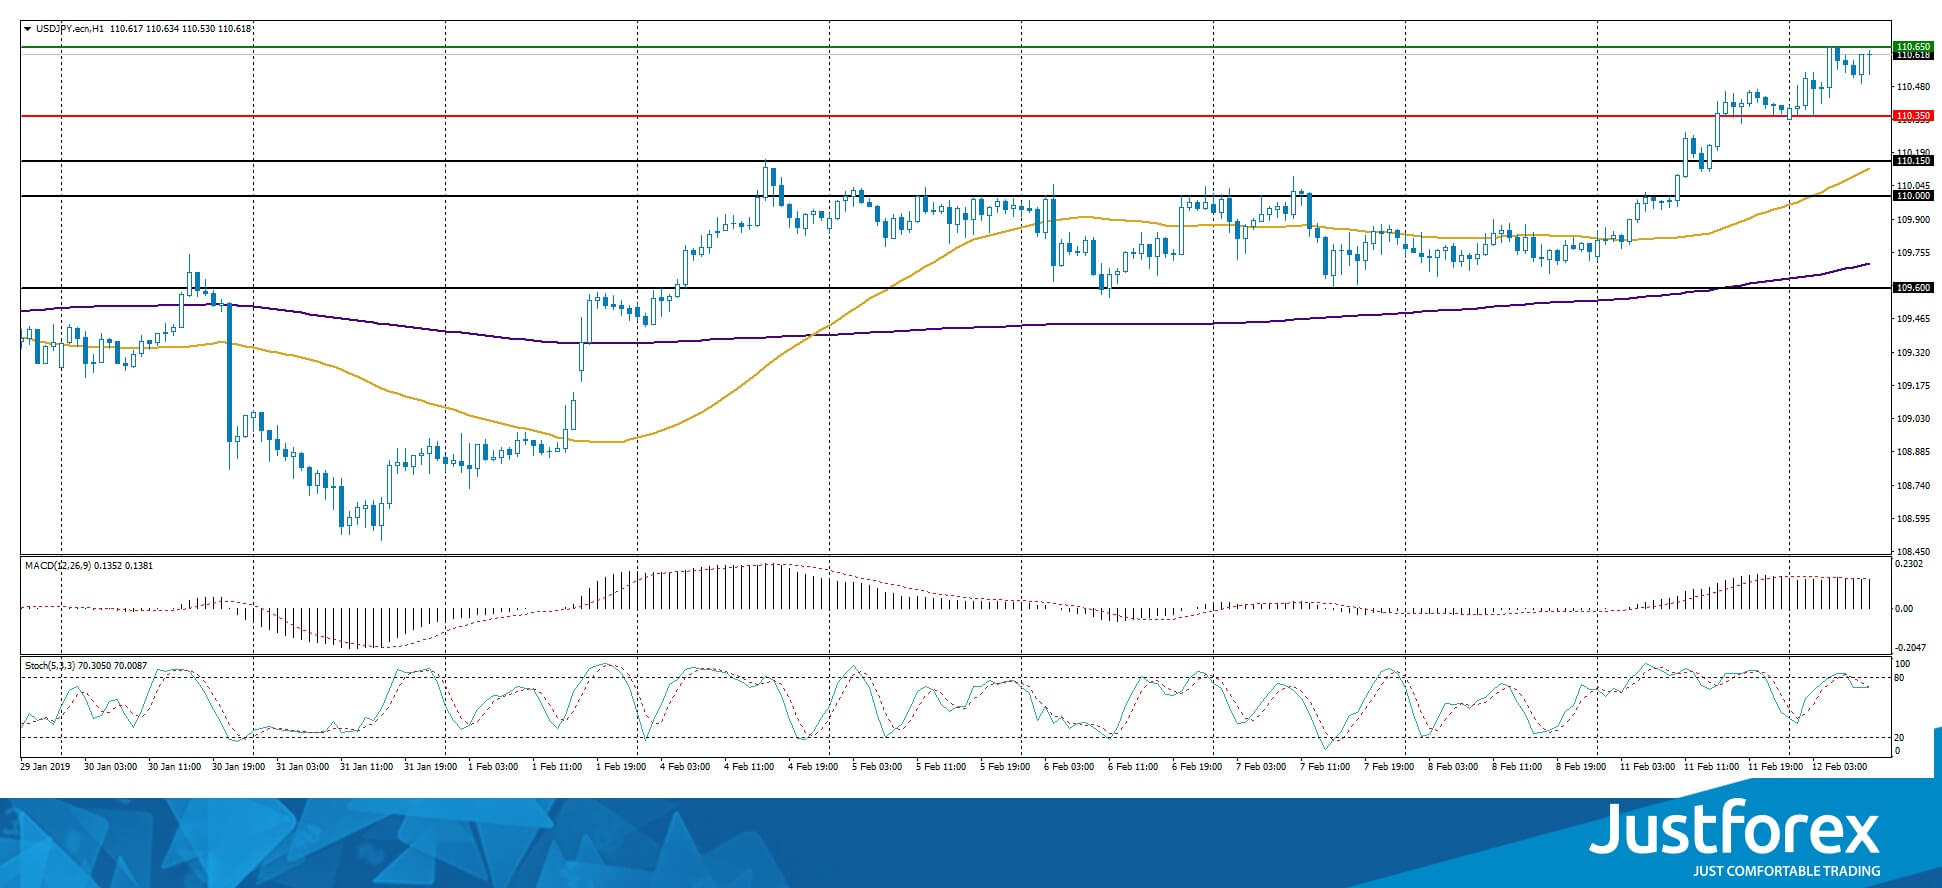
The price fixed above 50 MA and 200 MA which points to the power of the buyers.
The MACD histogram is in the positive zone and keeps rising which points to the further growth of USD/JPY.
The Stochastic Oscillator is in the neutral zone, the %K line is crossing the %D line. There are no signals at the moment.
Trading recommendations
Support levels: 110.350, 110.000, 109.600
Resistance levels: 110.650, 111.000
If the price fixes above 110.650, expect the quotes to grow toward 111.000.
Alternatively, the quotes can correct toward 110.000-109.800.
The US Dollar Index Has Updated Monthly Highs
The US dollar strengthened again relative to a basket of currency majors. Yesterday, the dollar index (#DX) updated monthly highs and closed in the positive zone (+0.46%). Democrats and Republicans in Congress reached an agreement on the construction of a wall on the border with Mexico, which should prevent another shutdown of the US government next weekend. The agreement would provide $1.38 billion for the construction of 55 miles of the wall along the Mexico border. Now the agreement should be approved by both houses of Congress, and then signed by the US President Donald Trump.
The British pound weakened significantly after the publication of weak economic reports. Thus, GDP (q/q) slowed down in the fourth quarter of 2018 to 0.2% from 0.6%, GDP growth (y/y) counted to 1.3%, while experts forecasted 1.4%. The manufacturing production fell by 0.7%, although investors expected a growth rate of 0.2%. Such weak economic statistics are associated with uncertainty concerning Brexit. Only 7 weeks are left until the Brexit, and Prime Minister, Theresa May, hasn’t been able to agree and approve the deal on the conditions for the country's exit from the block.
The "black gold" prices have been recovering. At the moment, futures for the WTI crude oil are testing $52.75 per barrel. At 23:30 (GMT+2:00), a report on the API weekly crude oil stock will be published.
Market Indicators
Yesterday, there was a variety of trends in the US stock market: #SPY (+0.06%), #DIA (-0.15%), #QQQ (-0.09%).
The 10-year US government bonds yield fell slightly. Currently, the indicator is at the level of 2.66-2.67%.
The news feed on 12.02.2019:
JOLTS job openings in the US at 17:00 (GMT+2:00).
We also recommend paying attention to the speeches by the heads of the Bank of England and the Fed.
WTI Crude Oil Futures Point Slightly Higher In The Near Term
West Texas Intermediate (WTI) crude oil futures are edging slightly higher, surpassing the Kijun sen line and the 20-simple moving average (SMA) in the 4-hour chart, indicating a possible upside retracement. However, the price remains below the Ichimoku cloud and the technical indicators are still standing in the negative zone. The RSI is approaching the 50 level, while the MACD jumped above the trigger line in the near term.
Moving higher immediate resistance could come from the 40-SMA currently at 53.90, before heading towards the 55.20 level, registered on February 5. A stronger barrier though could be found at the 38.2% Fibonacci retracement level of the downleg from 76.90 to 42.50, near 55.64.
Should the market extend losses, support could be met at the 51.30 support level, which is acting as strong obstacle as the price has failed to drop below it over the last month. A significant leg below this area could send prices towards the 23.6% Fibonacci of 50.65, while more losses could challenge the 49.80 hurdle.
Turning to the medium-term, the outlook seems to be neutral and only a decisive close above the 61.8% Fibonacci could create a bullish picture. On the other hand, a close below the December’s low of 42.50 could shift the outlook back to bearish.
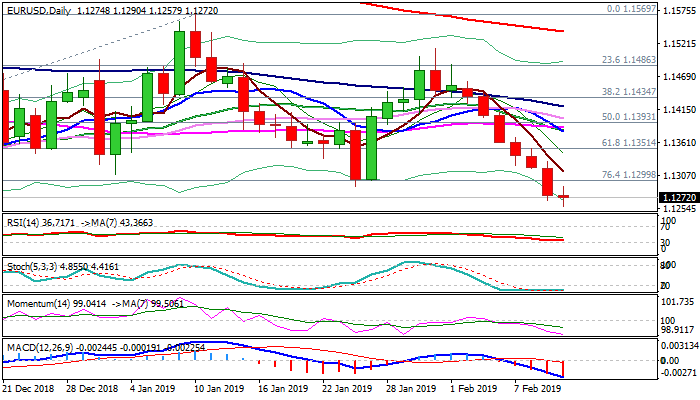
EUR/USD Outlook: Eventual Break Below 200WMA Opens Way For Further Weakness
The Euro holds in red for the seventh straight day and hit lowest levels since mid-Nov after eventual clear break below 200WMA on Monday (the pair holds firmly below 200WMA for the first time since Nov 2017) generated strong bearish signal.
Break below former lows at 1.1289 (24 Jan), 1.1270 (14 Dec) and 1.1267 (28 Nov) opens way towards key med-term support at 1.1215 (12/13 Nov double-bottom), violation of which would generate another bearish signal on completion of asymmetric H&S pattern on weekly chart.
Meanwhile, bears may take a breather before final push towards 1.1215 target as deeply oversold daily stochastic signals adjustment.
Upticks are expected to provide better selling opportunities and should be ideally capped by 200WMA (1.1334).
Res: 1.1290, 1.1334, 1.1357, 1.1386
Sup: 1.1257, 1.1215, 1.1186, 1.1118
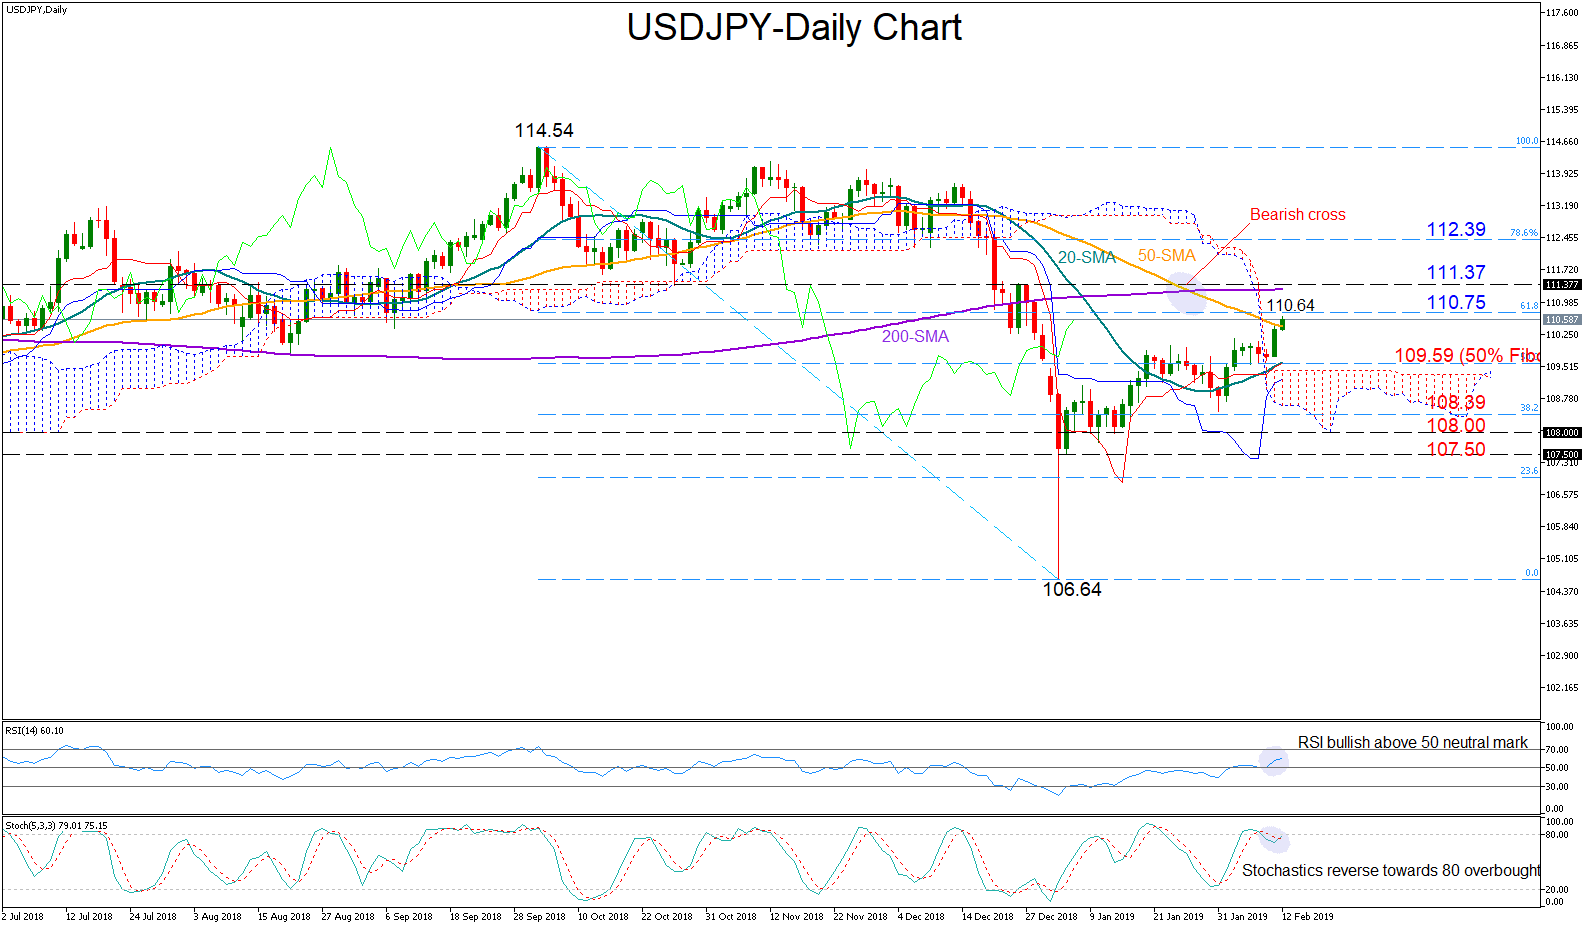
USDJPY Breaks Above 110, Looks Bullish In Short-Term
USDJPY cleared the 110 level on Monday and broke slightly above the 50-day moving average (MA) on Tuesday to reach a six-week high of 110.64.
The pair is also trading comfortably above the 20-day MA and the Ichimoku cloud, giving positive trend signals for the short-term. Momentum indicators are also in bullish territory, with the red Tenkan-sen line improving above the blue Kijun-sen line and the RSI increasing steam after the rebound on the 50 neutral threshold. The fast Stochastics, though, are still close to the 80 overbought mark, warning that the bears might be around the corner.
Should bullish pressure violate the 61.8% Fibonacci of 110.75 of the downleg from 114.54 to 104.64, important resistance could appear around the 200-day MA which currently stands at 111.37. A decisive close above that line could trigger steeper increases, shifting the focus towards the 112.50 restrictive area where the 78.6% Fibonacci is also located.
In the alternative scenario, the price could weaken towards the 50% Fibonacci of 109.59, while lower support could be found near the 38.2% Fibonacci of 108.39. if the latter fails to halt downside movements, the pair could subsequently retest support between 108 and 107.50.
In the medium-term picture, the outlook remains negative as long as the market holds below 111.37. The bearish cross between the 50- and the 200-day MA, signals that things could turn worse before getting better in the medium term.
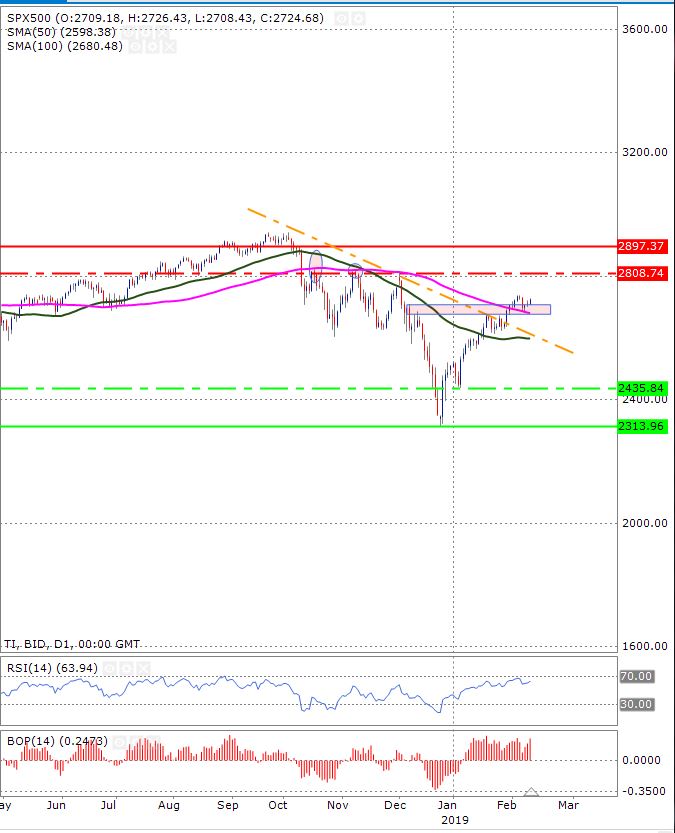
S&P500 Index Shows Bulls Strength
The S&P500 index has broken its downward trend line on a daily time frame. This confirms the fact that the downtrend is no longer in play. The fact that the price is also trading above the 100-day and 50-day moving averages (shown in pink and green respectively) further confirms the above argument. The 100-day moving average has recently acted as a support, shown by the red arrow, and as long as the price stays above this, the upward momentum is likely to remain strong. A break of 100-day moving average may push the price to the 50-day moving average.
The RSI is trading near the oversold region and this suggests that the price may actually break below the 100-day moving average. The balance of power shows that the bulls are still in full control of the price.
The minor support zone is shown by the dotted green horizontal line and the major support zone is shown by the solid line.
The minor resistance zone is shown by the dotted red horizontal line and the major resistance zone is shown by the solid resistance line.
May To Address Parliament | Gold Defends Its 1300 Mark
The possibility of another US government at the end of this week is keeping many risk lover investors at the bay. No one wants to see another government shutdown, especially after a historic one which wasn’t too long ago. These government shutdowns adversely impact the economic health of the country. Although there are some reports that perhaps some sort of deal is actually shaping up behind the closed doors.
Resolving trade war issues can really improve the sentiment in the markets. It is in the US's best interest to put an end to this sadness so that the economic growth can blossom again. We trust solving this matter can push the dollar index higher which already has touched its best level in six weeks. In addition to this, it will also aid the general sentiment among equity traders.
The equity markets over in the states are still robust. The S&P 500 is up 8.10% year-to-date, the NASDAQ index is up 10.14% YTD and the Dow Jones is up 7.40% YTD. The 10-day volatility for the S&P500 is less than the 30-day volatility and the theme is the same for the Nasdaq and Dow Jones indices as well and this indicates there isn’t much panic in the markets. But the fact that the Dow Jones index had 15 stocks closing on the upside yesterday and 15 stocks closing to the downside, this indicates that the current momentum isn’t strong.
Back in the U.K., after the most sub-standard manufacturing and GDP reading yesterday, the investor focus is more on today’s parliamentary address by Theresa May to MPs. This was supposed to be tomorrow but the prime minister brought it forward given the time sensitivity issue the country is facing. In her speech today, she is going to ask the MPs to give her more time so that she can bring a better deal by February 27th back to them. Although many MPs aren’t going to be very delighted with the situation, but they have limited options in front of them.
In the commodity space, the gold price has defended its support level of 1300 and it appears that the bears do not have any permission to drive the price lower. The fact that central banks are increasing their foreign reserves of gold is also helping the price. Malaysia foreign reserves increased to $422.3 billion, and as long as these numbers keep on rising, it shows that the gold demand is robust and it is only going to get better with time.
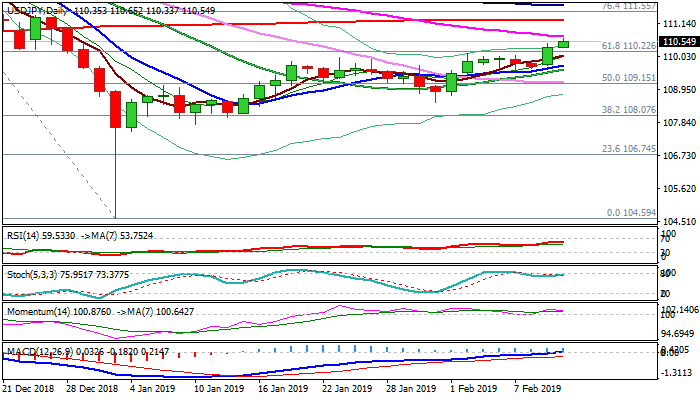
USD/JPY Outlook: Extension Above Key 110.00/22 Barriers Pressures Targets At 110.71/78
The pair hit new ten-week high at 110.65 in early Tuesday's trading, in extension of Monday's rally that eventually closed above pivotal 110.00/22 barriers and generated bullish signal. The dollar benefited on increased safe-haven demand over uncertainty on US/China trade talks, though, some optimistic tones were heard on Monday, boosting hopes that two countries would find a deal before 1 Mar deadline. Bulls were additionally supported by weaker than expected Japanese data, released overnight) and pressure barriers at 110.71/78 (55DMA/100WMA) break of which would generate fresh bullish signal and may trigger extension towards 111.26 (200SMA). On the other side, flat momentum and stochastic heading into overbought territory on daily chart, warn that bulls may run out of steam. Broken pivotal barriers at 110.26/00 zone now mark solid support and expected to keep the downside protected. Only return and close below converged ascending 10/20SMA's (109.76/60) would sideline bulls. Traders will be looking for further signals from the speech of Fed chief Powell, due later today.
Res: 110.71, 111.26, 111.55, 111.74
Sup: 110.22, 110.00, 109.76, 109.60