Sample Category Title
EUR/USD Analysis: Aims To S1 At 1.1394
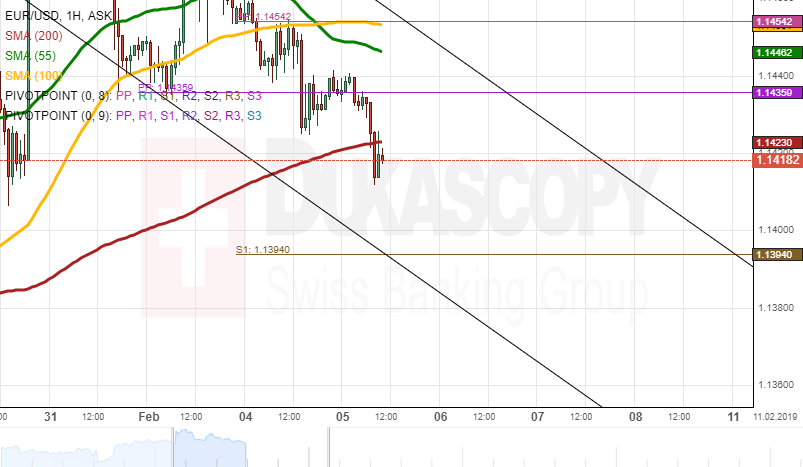
During Monday's trading session, the rate passed through the support level of the monthly PP at 1.1435. On Tuesday morning, the European Single Currency was located at the 1.1413 mark.
Most likely, the rate will trade sideways to stay between the weekly S1 at 1.1394 and the 200-hour simple moving average at 1.1422. In addition, most likely, the 200-hour SMA will resist the rate during the day.
On the other hand, the resistance of the 200-hour SMA could push the European Single Currency to pass through the support level of the weekly S1 to the 1.3800 level.
GBP/USD Analysis: Will Trade To 1.2980 Level
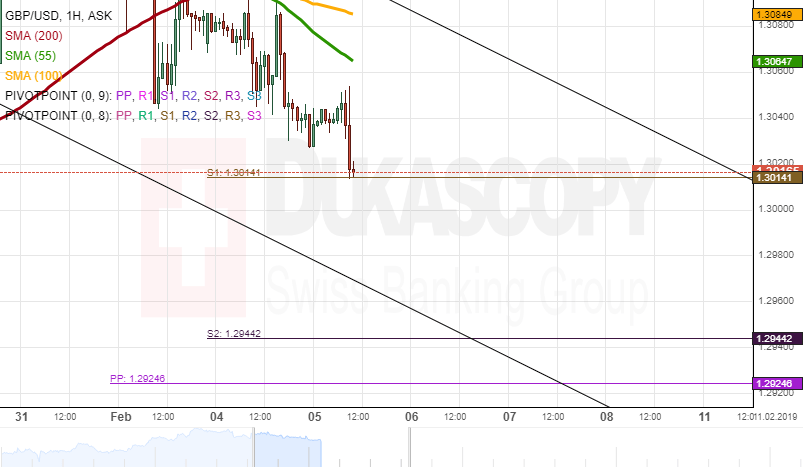
During Monday's trading session, the currency exchange rate was resisted by the 55-hour simple moving average to push the rate to trade downside. On Tuesday morning, the British Pound was located at the 1.3041 mark.
It is expected that the rate will keep moving downwards to pass the support level of the weekly S1 at 1.3014 to end the trading session at the 1.2980 level. However, the weekly S1 at 1.3014 could support the British Pound to appreciate against the US Dollar to push the rate to trade sideways during the day.
Note, the chart was fully reviewed to make some changes to the patterns!
USD/JPY Analysis: Breaks Medium Pattern
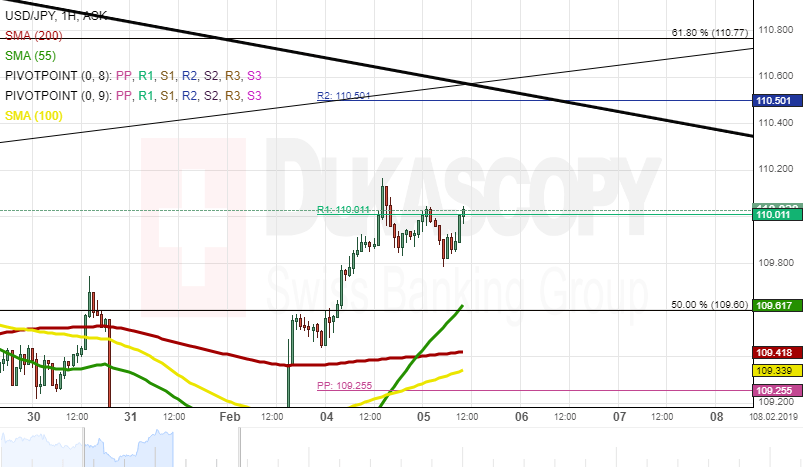
During Monday's trading session, the US Dollar broke the medium pattern line and the resistance level of the weekly R1 at 110.01. On Tuesday morning, the rate was located below the weekly R1 at the 109.98 mark.
In regards to the near-term future, it is expected, that the continue the surge towards the 111.00 level. Most likely, the rate will end the trading session near the resistance level of the weekly R2 at 110.50.
Meanwhile, the simple moving averages will try to catch up the rate to give an additional push for the rate to surge.
XAU/USD Analysis: Will Stay At 1,310.00
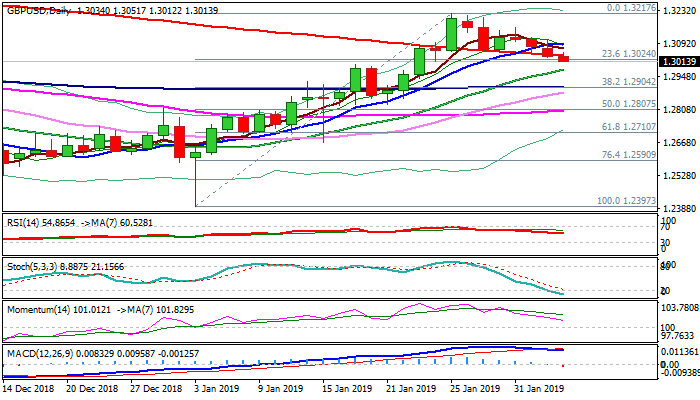
During the previous trading session, the yellow metal was resisted by the 100-hour simple moving average to trade between the 100-hour SMA and the monthly pivot point at 1,308.46. On Tuesday morning, the gold was located at the 1,311.36 mark.
In regards to the near-term future, most likely, the yellow metal will continue the trade between the monthly PP and the simple moving averages to stay at the 1,310.00 level for the rest of the day.
Meanwhile, the 200-hour simple moving average will catch up the monthly pivot point at 1,308.45 to give additional support for the gold!
GBP/USD Outlook: Break Below 200SMA Risks Extension Below Psychological 1.30 Support
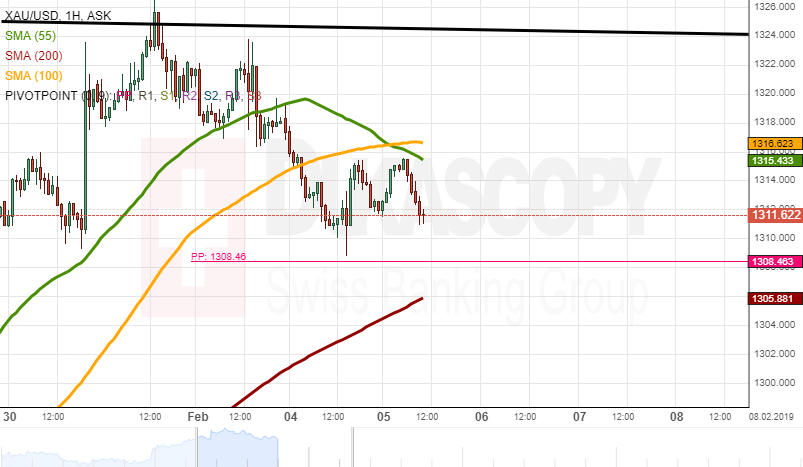
Cable holds in red for the fourth straight day and pressures psychological 1.30 support after bearish signal was generated on eventual break and close below key 200SMA support (1.3041) on Monday, as well as completion of failure swing pattern on daily chart.
UK Services PMI miss on Tuesday (Jan 50.1 vs 51.1 f/c) added to negative tone, as the pair is losing bullish momentum and daily RSI / MACD / are heading south.
Bears may face strong headwind at 1.30 support zone (psychological / rising 20SMA) as slow stochastic is strongly oversold, but negative outlook would remain while broken 200SMA caps.
Eventual break below 1.3000 / 1.2979 (20SMA) would signal further weakness and threaten larger bulls, with violation of 1.2904 pivot (Fibo 38.2% of 1.2397/1.3217 / 100SMA) needed to confirm reversal and signal stronger retracement of 1.2397/1.3217 ascend.
Res: 1.3041, 1.3090, 1.3114, 1.3160
Sup: 1.3000, 1.2979, 1.2904, 1.2881
Futures Higher Ahead Of State Of The Union Address
Trade talks and border wall comments eyed
US futures are back in the green on Tuesday following a strong start to the week, as investors turn their attention to Trump’s State of the Union Address.
The speech is going to be closely monitored by investors, keen to get an update on trade talks with China and border security, or more specifically the wall, which led to the longest ever government shutdown last month and could trigger another in just over a week. There have been plenty of reports that Trump is considering using emergency powers to deliver on his promise of border wall funding and this could be the platform for it, or at least a strong hint of an intention to do so.
European stock markets have had a good morning, with the FTSE the rare outperformer as sterling continued to edge lower and BP earnings lifted the oil sector. Higher oil prices and output contributed to the stunning profit growth, which bodes well for the rest of the sector, especially with prices appearing to have bottomed and showing potential for another burst higher.
Oil continues to test key resistance
WTI and Brent are pushing hard against technical resistance right now. There are a number of supporting factors for oil prices at the minute, be it the OPEC+ production cut agreement, falling US oil rigs, the less pessimistic growth outlook or an overall improvement in market risk appetite. Resistance remains around the $65 and $55 levels, which are holding for now but may weaken the longer it persists. A break through here could be a very bullish signal and the catalyst for another pop higher.
Both API and EIA have reported rising inventories over the last couple of weeks which may cast some doubts over the success of the output cut that was put in place late last year. Of course, this takes time to have a significant impact but if there’s any question that compliance is lacking, it could easily threaten the recovery in oil prices. Again though, US output is also key here and it may be at record highs now but the rig count has been declining since mid-November which may be an interesting leading indicator for future production.
Gold soft on resurging dollar but may prove temporary
Gold continues to pare late-January gains, with the burst that took it through $1,300 having lost its spark. I’m not concerned at this stage and as long as it remains above $1,300, I think it continues to look bullish. It will be interesting to see whether it finds strong support if the level is tested from above, with a rebound off here providing bullish confirmation of the initial breakout and providing some level of comfort to gold bulls.
We may have more days of softness in the interim though, with a similar rebound in the dollar being primarily responsible for gold’s reversal of fortune. The greenback has been experiencing a bit of a bounce over the last few sessions, aided by the jobs report on Friday which offered further comfort on the state of the US economy. Still, I’m not confident the gains can be sustained against the backdrop of a more dovish Fed and positive trade talks with China.
Crude Oil Gains Traction
Crude oil gains traction
Despite a rise in inventories, crude prices continue to gain ground. All three crude oil futures – Brent, WTI and Shanghai – have bounced from their lows of December 2018, up 16.13%, 20.17% and 15.03% year-to-date. OPEC’s group of 14 finally has the last word, as expectations of tighter supply is supporting prices. Recent sanctions made by the US against Venezuela’s oil giant PDVSA in order to cut President Nicolàs Maduro’s government’s main source of revenue remains a major disruption for US refiners, which count Venezuela as their third-largest supplier. Since American refineries require the use of both heavy (Venezuelan) and light (shale) barrels to produce gasoline and diesel efficiently, their output dropped by 930’000 barrels/day in January. A prolonged shortage of heavy crude would inflate oil prices, since refiners would have to either slow production or pay a premium for heavy crudes.
So we expect a rise in crude prices in the coming months. The real impact of supply shortages should not be felt on US oil inventories until spring, when production ramps up for the summer driving season. A trade truce between the US and China could have the opposite effect on oil prices, as Chinese consumption could take off, but not benefit of OPEC members. China’s engagement to increase US imports could also include crude oil purchases. Currently trading at 54.95, WTI is heading along 55.20 short-term.
Market confusion
US equity markets have recovered sharply since, however, headwinds remain. US stocks moved quickly from over-bought to over-sold, as investors’ worries over US recession, trade tensions and Fed tighter monetary policy faded. Federal Reserve Chairman Powell’s pivot from tightening to neutral/dovish has pushed stocks to regain 50% of losses. Still, we retain our neutral slightly defensive position: there are key uncertainties. Volatility has declined but remains well above 2017 levels. Investors should be prepared for normal volatility.
Corporate earnings provided little clarity. A renewed focus on results is likely to develop into realistic valuations. December data said 50% of CFOs believe the US economy would be in a recession by end 2019. Consumer confidence has fallen sharply. The average US consumer sees chaos in domestic politics. Unemployment remains near historically low levels and job growth remains strong. A strong bounce in mortgage applications suggests improvements in housing. These are mixed messages, so investors should remain vigilant.
Forex Technical Analysis: EUR/USD, USD/JPY, GBP/USD
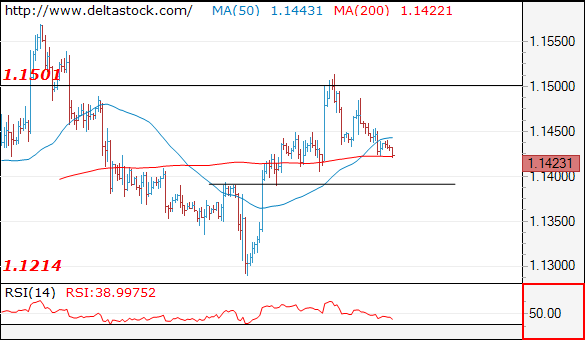
EUR/USD
Current level - 1.1423
The bias is bearish, for a break through 1.1390, en route to 1.1330.
| Resistance | Support | ||
| intraday | intraweek | intraday | intraweek |
| 1.1480 | 1.1630 | 1.1390 | 1.1214 |
| 1.1630 | 1.1820 | 1.1330 | 1.1100 |
USD/JPY
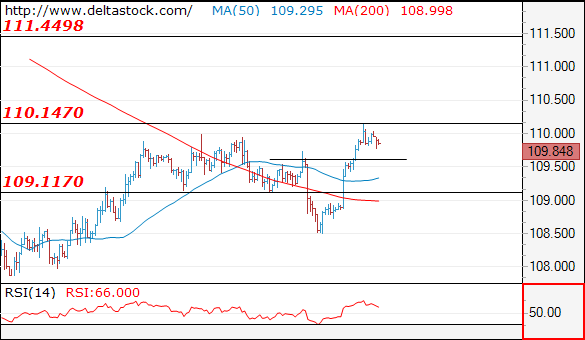
Current level - 109.84
The failure at 110.20 resistance should allow a brief consolidation pattern above 109.60 static support, before advancing higher, to 111.45 zone.
| Resistance | Support | ||
| intraday | intraweek | intraday | intraweek |
| 110.20 | 111.45 | 109.60 | 106.70 |
| 111.45 | 112.20 | 109.10 | 104.60 |
GBP/USD
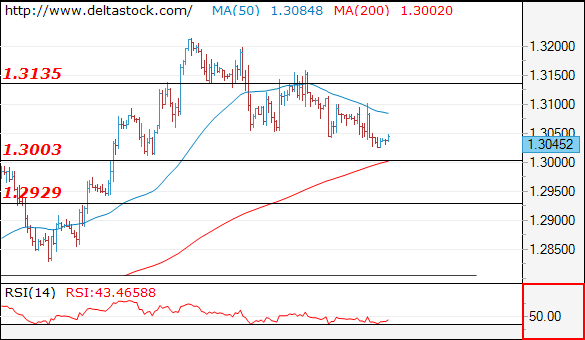
Current level - 1.3045
I favor a break through 1.3000 area, for a dip to 1.2930 zone. Crucial on the upside is 1.3150 high.
| Resistance | Support | ||
| intraday | intraweek | intraday | intraweek |
| 1.3150 | 1.3290 | 1.3000 | 1.3000 |
| 1.3290 | 1.3480 | 1.2930 | 1.2800 |
Bearish Development On USD/CAD
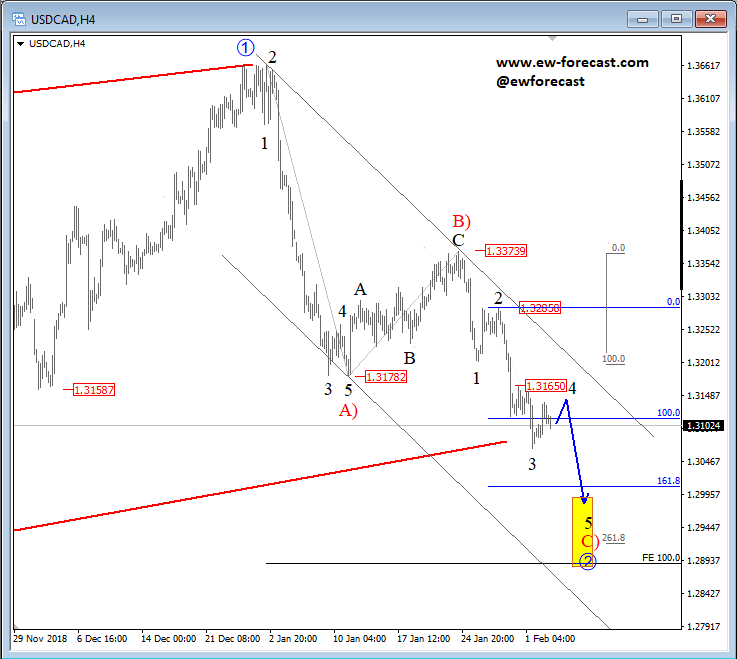
USDCAD is trading in a bigger, three-wave reversal labelled as blue wave 2 from December highs. We are specifically tracking sub-wave 4 of C), which can look for resistance near the 1.3165 level, level of a previous swing high, and there reverse lower. The whole impulsive wave C) can in sessions ahead look for support and a bounce near the 1.2930/1.2900 region.
USDCAD, 4h
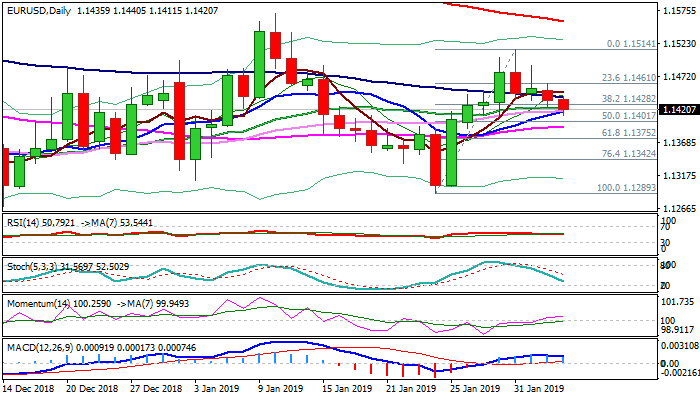
EUR/USD Outlook: Bears Extend Into Second Day As Cloud Twist Attracts
The Euro accelerated lower in early European trading after quiet mode in holiday impacted Asia, keeping in red for the second day.
Mixed results from EU members Services PMI in Jan made little impact on the pair’s performance.
Break below Fibo support at 1.1428 (38.2% of 1.1289/1.1514) and probe through MA supports at 1.1421/17 zone (10/20/30SMA) was negative signal, with twist of daily cloud (1.1397) being magnetic for bears.
Bearishly aligned daily techs add to negative near-term outlook, with violation of daily cloud and nearby 55SMA (1.1392) needed to signal further weakness and expose Fibo supports at 1.1375/42 (Fibo 61.8% & 76.4% of 1.1289/1.1514 respectively).
Alternative scenario requires return and close above 10SMA (1.1439) to sideline downside threats.
Res: 1.1428, 1.1439, 1.1461, 1.1488
Sup: 1.1397, 1.1375, 1.1342, 1.1300