Sample Category Title
The Analytical Overview Of The Main Currency Pairs
The EUR/USD currency pair
Technical indicators of the currency pair:
Prev Open: 1.14511
Open: 1.14355
% chg. over the last day: -0.17
Day's range: 1.14121 – 1.14405
52 wk range: 1.1214 – 1.2557
EUR/USD is in a bearish mood. The USD is supported by the positive bond yield dynamics. The quotes are testing 1.14100 local support with 1.14400 acting as a mirror resistance. The trading instrument has prospects for further growth. Investors are waiting for an array of reports. You should open positions from the key levels.
The Economic News Feed for 05.02.2019:
Business Activity Report (EU) – 11:00 (GMT+2:00);
Non-Industrial PMI by ISM (US) – 17:00 (GMT+2:00);
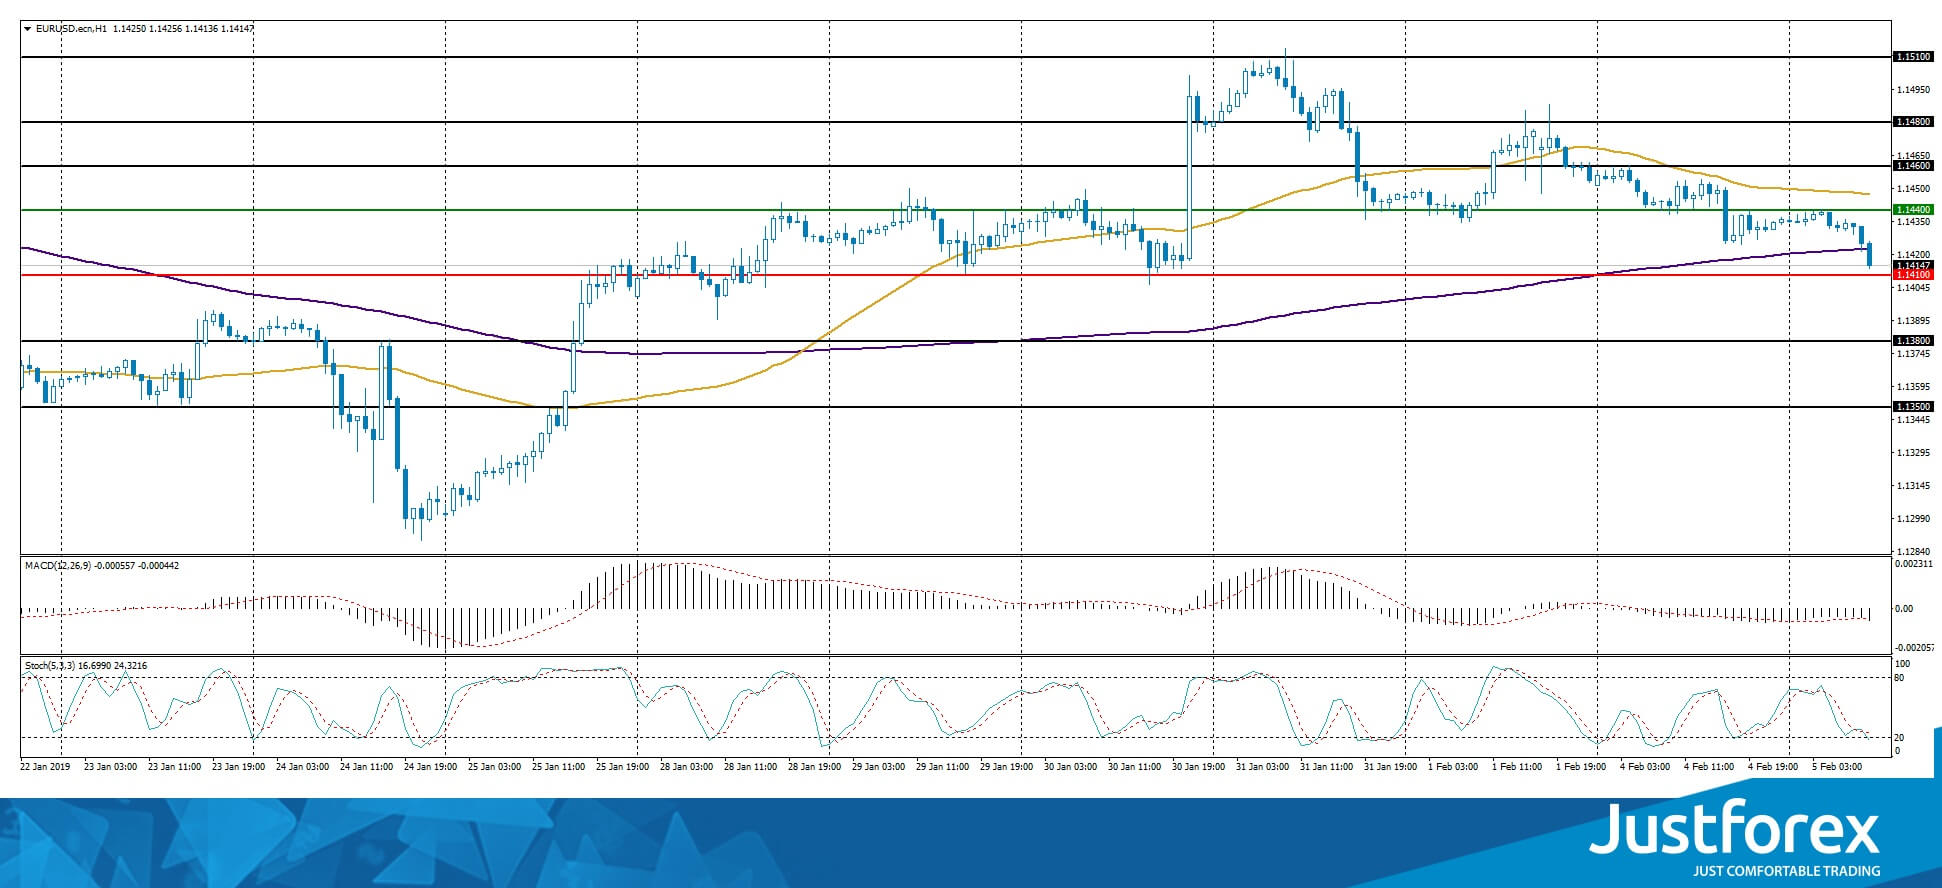
Indicators do not provide precise signals, the price has crossed 50 MA
The MACD histogram is in the negative zone and keeps descending, sending a strong signal yo sell EUR/USD.
The Stochastic Oscillator is near the oversold zone, the %K line is crossing the %D line. There are no signals at the moment.
Trading recommendations
Support levels: 1.14100, 1.13800, 1.13500
Resistance levels: 1.14400, 1.14600, 1.14800
If the price fixes below 1.14100 expect the EUR/USD quotes to descend further toward 1.13800-1.13500.
Alternatively, the quotes can grow toward 1.14600-1.14800.
The GBP/USD currency pair
Technical indicators of the currency pair:
Prev Open: 1.30612
Open: 1.30360
% chg. over the last day: -0.38
Day's range: 1.30266 – 1.30511
52 wk range: 1.2438 – 1.4378
GBP/USD remains in a long flat. The GBP is under pressure due to weak reports on business activity in the UK. GBP/USD is consolidating around 1.30150-1.30550 with further descent prospects. Keep an eye on Brexit and open positons from the key levels.
At 11:30(GMT+2:00) the UK will publish a service industry PMI.
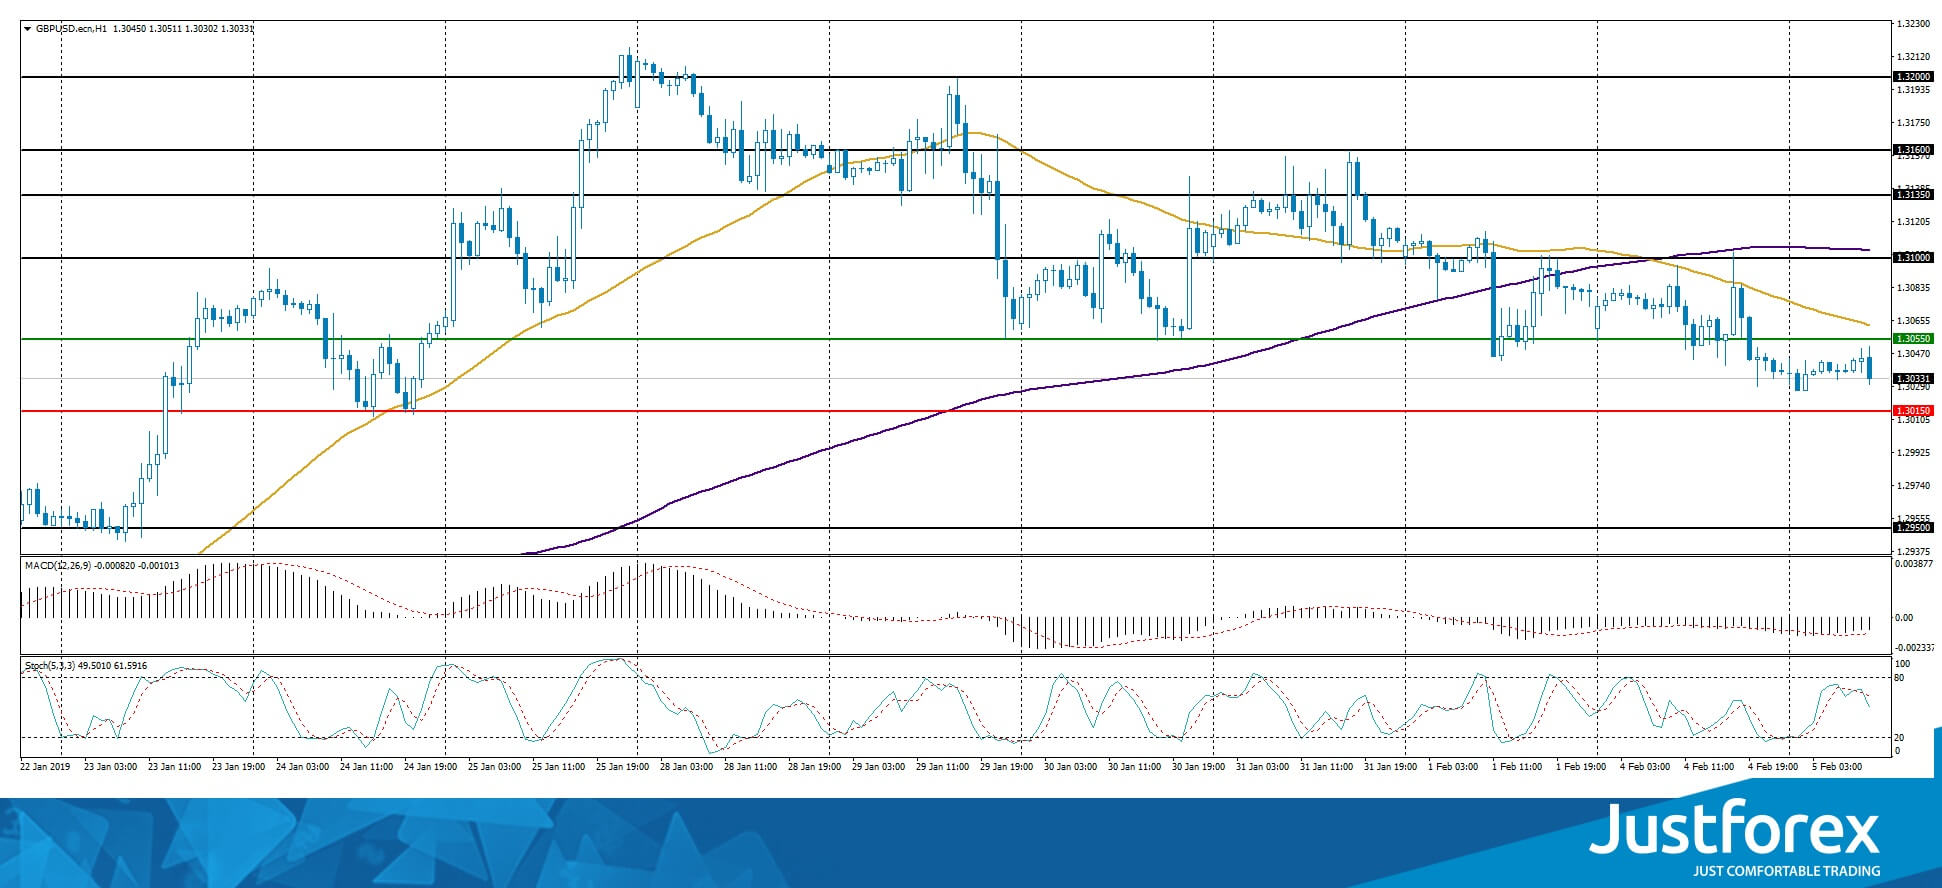
The price fixed below 50 MA and 200 MA which points to the power of the sellers.
The MACD histogram is in the negative zone but above the signal line, which gives a weak signal to sell GBP/USD.
The Stochastic Oscillator is in the neutral zone, the %K line is crossing the %D line. There are no signals at the moment.
Trading recommendations
Support levels: 1.30150, 1.29500
Resistance levels: 1.30550, 1.31000, 1.31350
If the price fixes below the local support of 1.30150 expect the quotes to fall toward 1.29750-1.29500.
Alternatively the quotes can grow toward the round 1.31000.
The USD/CAD currency pair
Technical indicators of the currency pair:
Prev Open: 1.30891
Open: 1.31112
% chg. over the last day: +0.08
Day's range: 1.31022 – 1.31211
52 wk range: 1.2248 – 1.3664
The CAD stabilized. USD/CAD are moving in a flat. The key support and resistance levels are 1.31000 and 1.31350. A technical correction is possible after a long fall. Keep an eye on the US news feed and open positions from the key levels.
The Economic News Feed for 05.02.2019:
Trading Balance Report (CAD) – 15:30 (GMT+2:00).
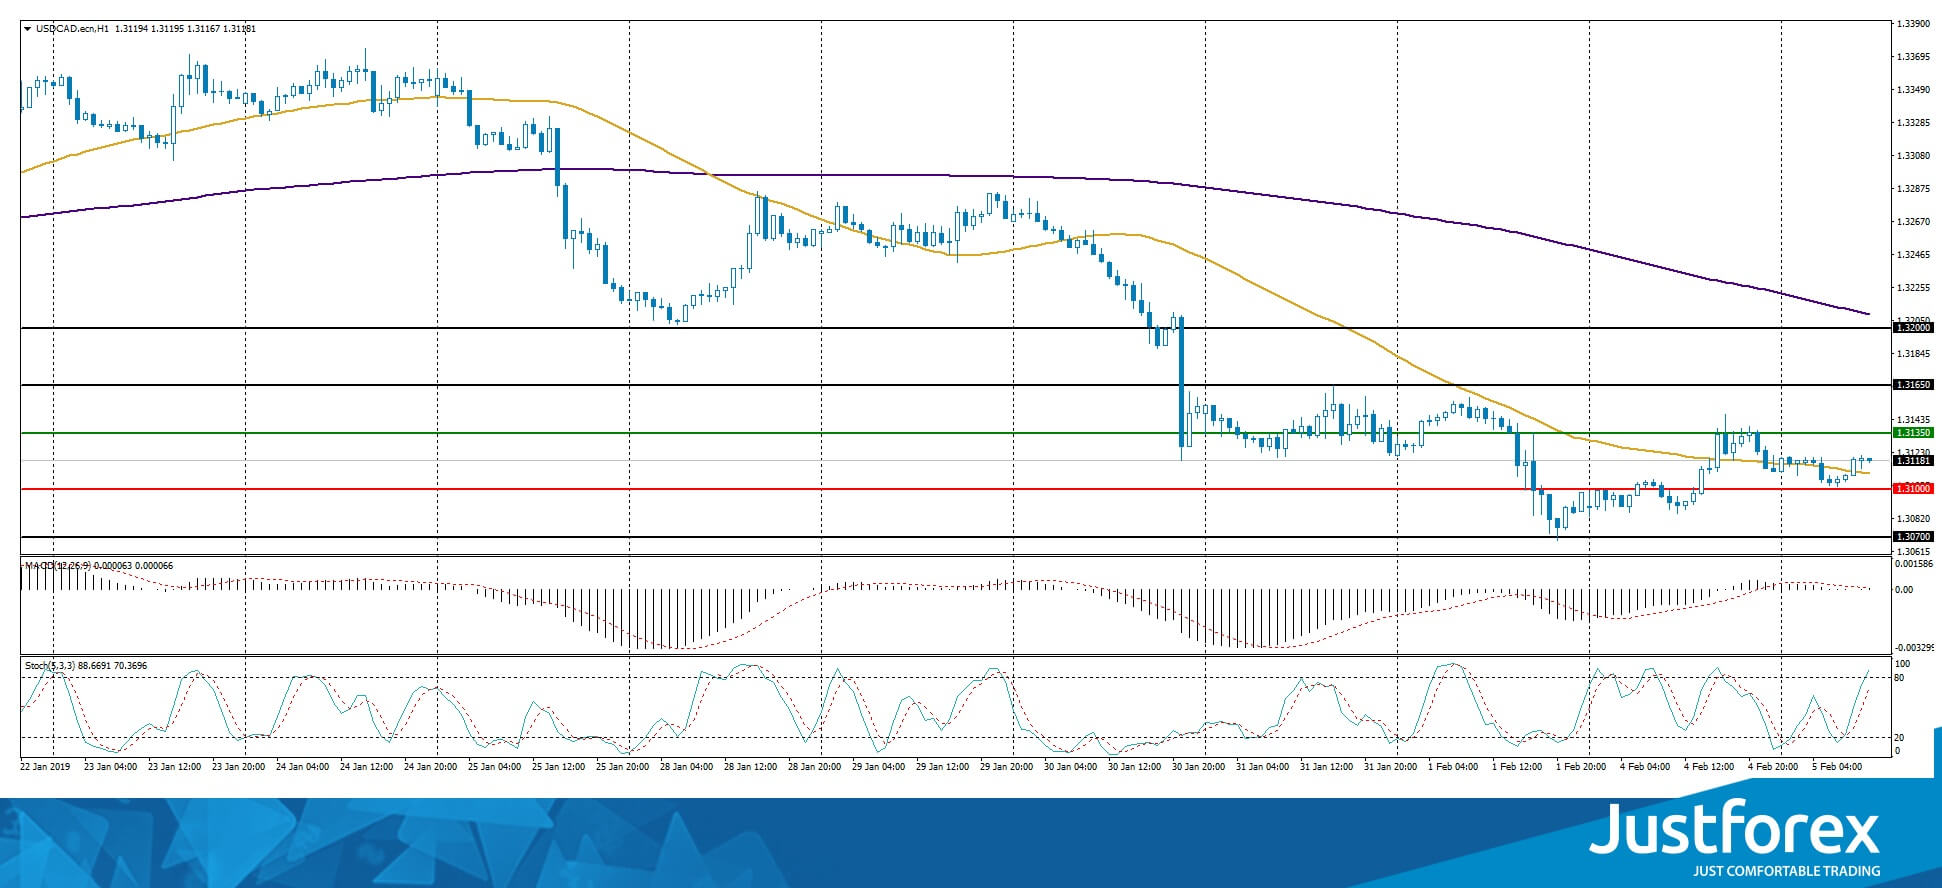
The indicators do not provide precise signals, the price has crossed 50 MA.
The MACD histogram is close to 0.
The Stochastic Oscillator is in the neutral zone, the %K line is above the %D line, which points towards a correction of USD/CAD.
Trading recommendations
Support levels: 1.31000, 1.30700
Resistance levels: 1.31350, 1.31650, 1.32000
If the price fixes above 1.31350 expect the USD/CAD quotes to correct toward 1.31650-1.32000.
Alternatively the quotes can fall toward 1.30700-1.30500.
The USD/JPY currency pair
Technical indicators of the currency pair:
Prev Open: 109.513
Open: 109.858
% chg. over the last day: +0.48
Day's range: 109.779 – 110.040
52 wk range: 104.56 – 114.56
USD/JPY is consolicating after a significant rally at the beginning of the month. The key levels are 109.800 and 110.100. The USD is supported by the positive Treasury bonds yield dynamic. The quotes have a potential to grow further. Keep an eye on the US economic reports.
The Economic News Feed for 05.02.2019 is calm.
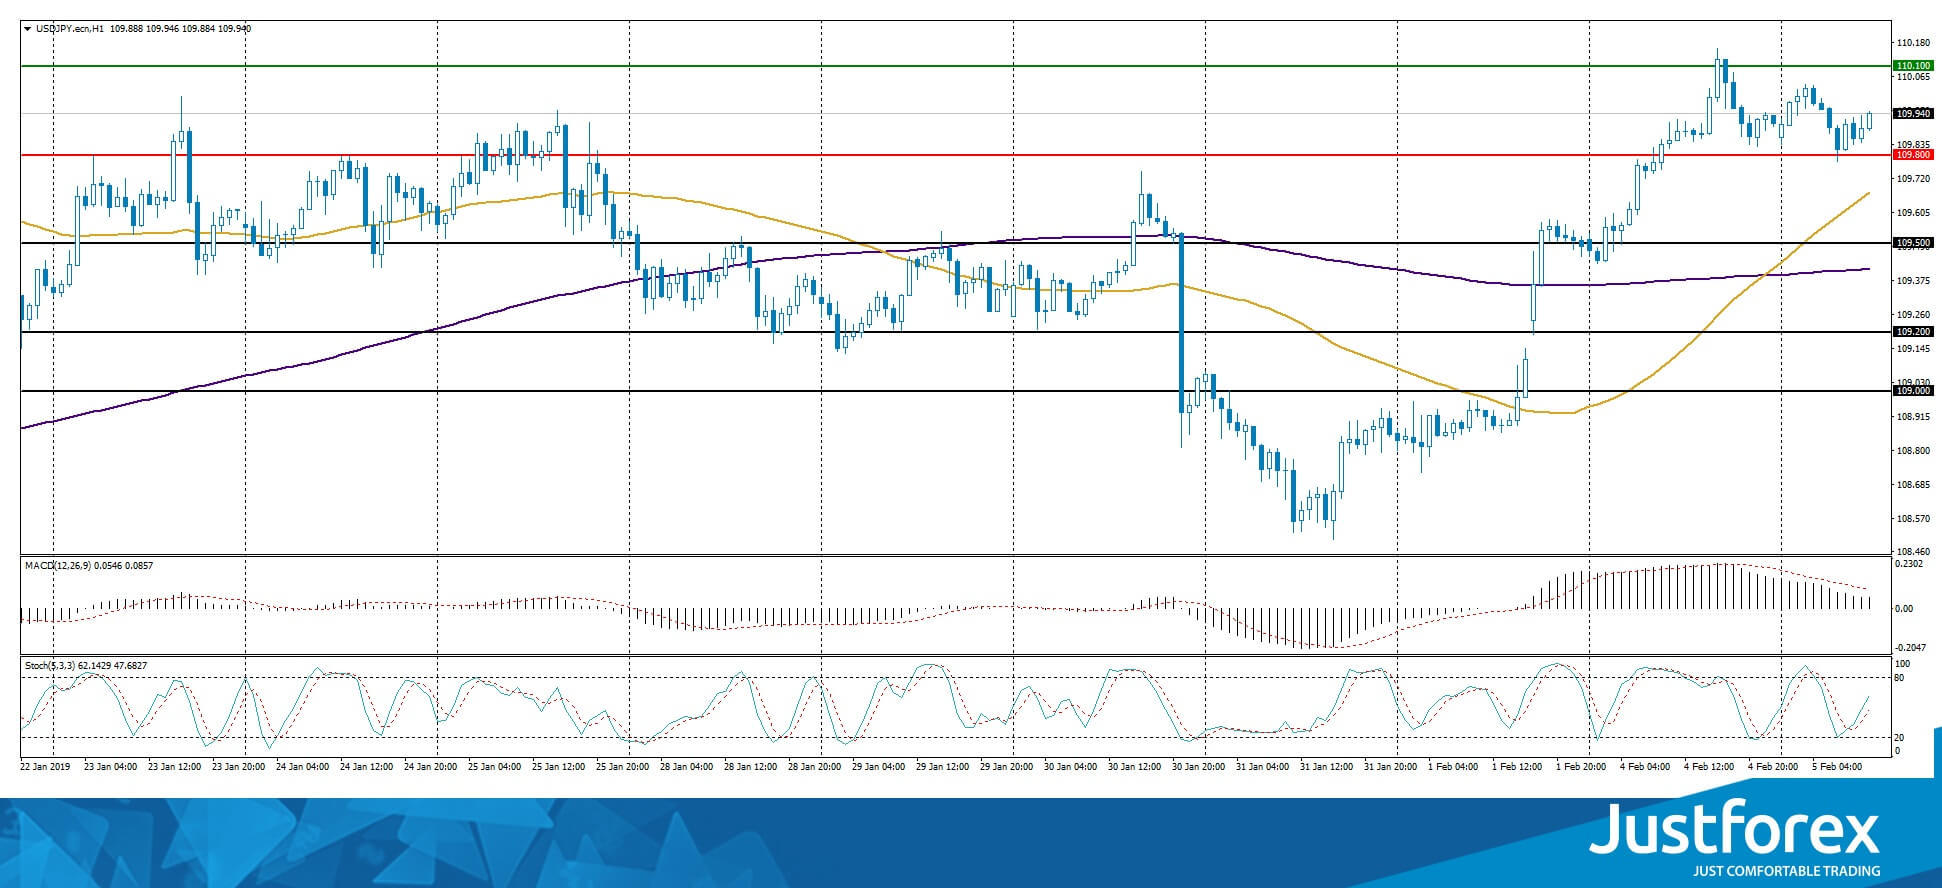
The price fixed above 50 MA and 200 MA which points to the power of the buyers.
The MACD histogram is in the positive zone but below the signal line, which gives a weak signal to sell USD/JPY.
The Stochastic Oscillator is in the neutral zone, the %K line is above the %D line which points to a bullish mood.
Trading recommendations
Support levels: 109.800, 109.500, 109.200
Resistance levels: 110.100, 110.500
If the price fixe above 110.100 expect the quotes to grow toward 110.500-110.700.
Alternatively the quotes can descend toward 109.600-109.400.
EURUSD 1.1410 Support In Focus
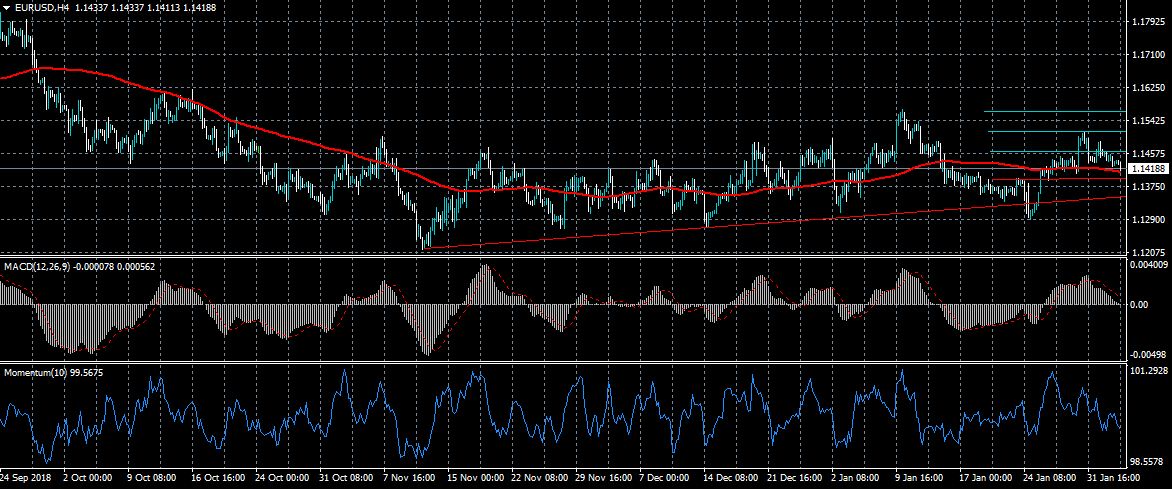
The euro currency has continued to drift lower against the US dollar during the European trading session, with the pair moving towards the pivotal 1.1410 support level. A sustained move below the 1.1410 level could prompt further technical selling towards the 1.1360 level. The MACD and Momentum indicators on the four-hour time frame continue to signal further downside ahead.
The EURUSD pair is bearish while trading below the 1.1410 level, key technical support is found at the 1.1390 and 1.1360 levels.
If the EURUSD pair trades above the 1.1430 level, buyers may test towards the 1.1460 and 1.1500 resistance levels.
USDJPY Attempting Bullish Breakout
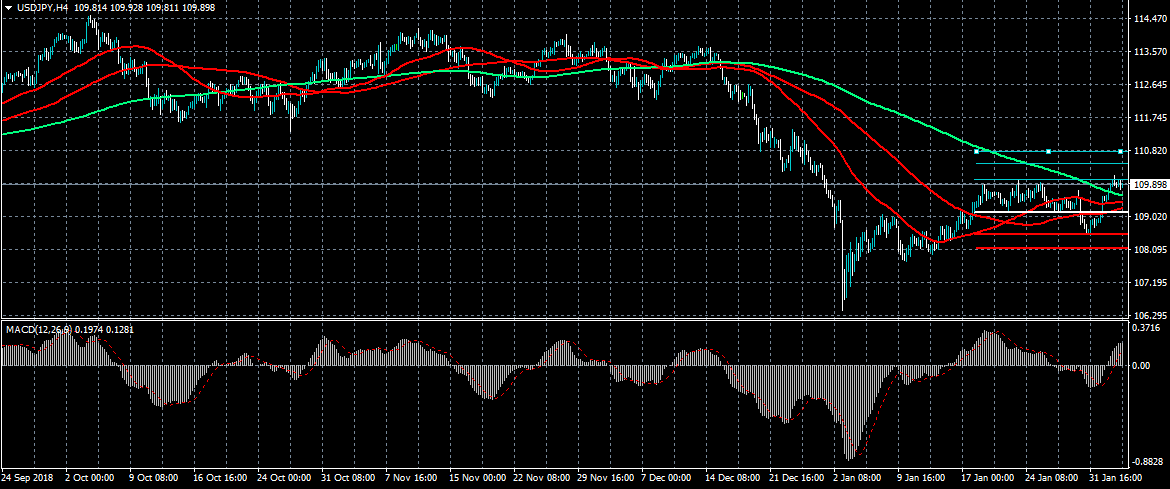
The US dollar is continuing to press higher against the Japanese yen currency on Tuesday, with buyers now testing the important 110.00 resistance level. If bulls can break above the 110.00 level, technical buying towards the 110.40 area seems possible. Technical indicators still remain bullish despite the strong one-hundred and fifty point move higher in the USDJPY pair.
The USDJPY pair is strongly bullish while trading above the 109.60 level, key technical resistance is found at the 110.40 and 110.80 levels.
If the USDJPY pair moves below the 109.60 level, sellers may test towards the 109.30 and 109.14 support levels.
The US Dollar Index Is In Plus
The US dollar strengthened against a basket of major currencies during yesterday's trading session. The dollar index (#DX) closed in the positive zone (+0.28%). In general, trading activity was low in the financial markets due to the Chinese New Year. Financial market participants expect additional drivers. Today, important economic data from the UK and the US will be published.
During the Asian trading session, ambiguous economic data from Australia have been published. Thus, the volume of retail sales fell by 0.4% in December, while investors did not expect the figure to change. At the same time, the Reserve Bank of Australia left the interest rate unchanged at 1.50%, as experts forecasted. The regulator plans to adhere to the current monetary policy.
The "black gold" prices are consolidating. At the moment, futures for the WTI crude oil are testing the mark of $54.70 per barrel. At 23:30 (GMT+2:00), the API weekly crude oil stock will be published.
Market Indicators
- Yesterday, the bullish sentiment prevailed in the US stock market: #SPY (+0.70%), #DIA (+0.73%), #QQQ (+1.24%).
- The 10-year US government bonds yield continues to rise. Currently, the figure is at the level of 2.71-2.72%.
Economic Data on 05.02.2019:
- Statistics on economic activity in the Eurozone at 11:30 (GMT+2:00);
- Services PMI in the UK at 11:30 (GMT+2:00);
- ISM non-manufacturing PMI in the US at 17:00 (GMT+2:00).
AUD/USD Analysis: Moving Towards Target
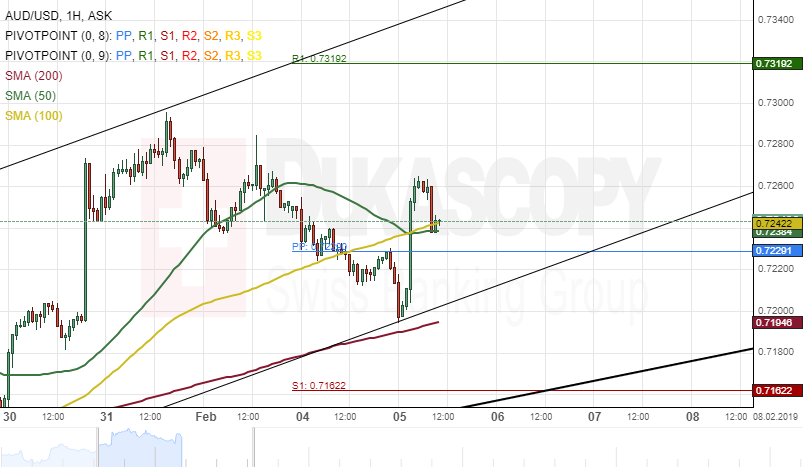
The Australian Dollar depreciated about 56 base points against the US Dollar on Monday. The currency pair tested the lower boundary of an ascending channel pattern at 0.7200 during Monday's trading session.
However, today's session began with bullish sentiment, and by the middle of the European trading session, the AUD/USD exchange rate had gained over 0.94% of its values.
Technical indicators suggest that the currency exchange rate will continue its bullish momentum within this session.
Although, it is expected that the pair makes a brief decline towards the weekly pivot point at 0.7229 today.
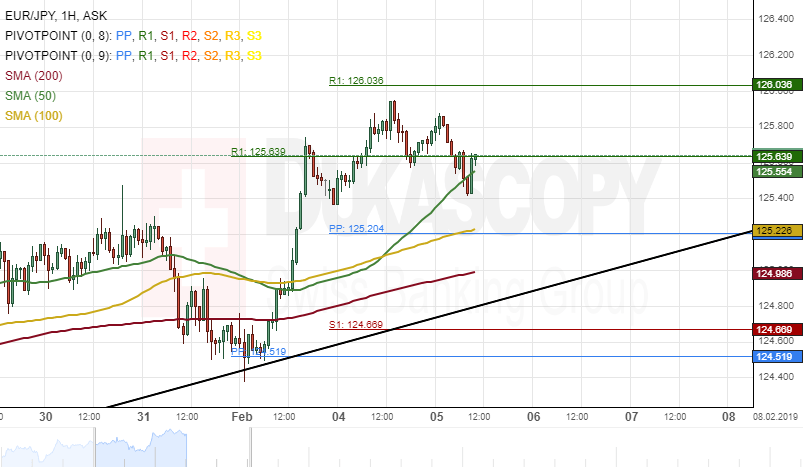
EUR/JPY Analysis: Potential Decline
The common European currency appreciated about 59 base points against the Japanese Yen on Monday. The currency pair reached near a traditional weekly resistance level at 126.03 during yesterday's trading session.
The exchange rate breached the 50-hour simple moving average at 125.51 during the first part of today's trading session.
Everything being equal, it is likely that the currency exchange rate could decline towards a support level formed by the 200-hour SMA at 124.97 today.
Although, a support cluster set by the combination of the weekly pivot point and the 100-hour SMA at 125.20 could hinder such movement south.
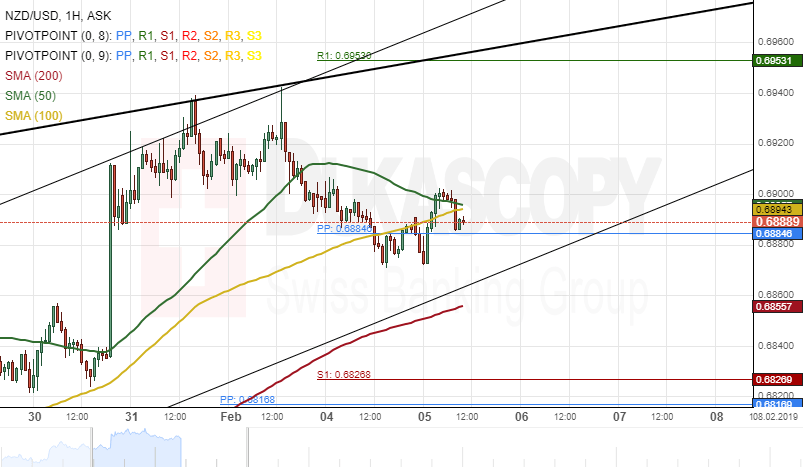
NZD/USD Analysis: Buy Signals Today
The New Zealand Dollar traded with low volatility against the US Dollar on Monday. The currency pair made a 33 pips movement during Monday's trading session.
As for the near future, it is likely that the currency exchange rate continue to trade in a junior ascending channel.
Technical indicators on the daily time-frame demonstrate that bulls are could dominate today's trading session.
The possible short-term target for the NZD/USD currency pair will be near a swing high of 0.6940.
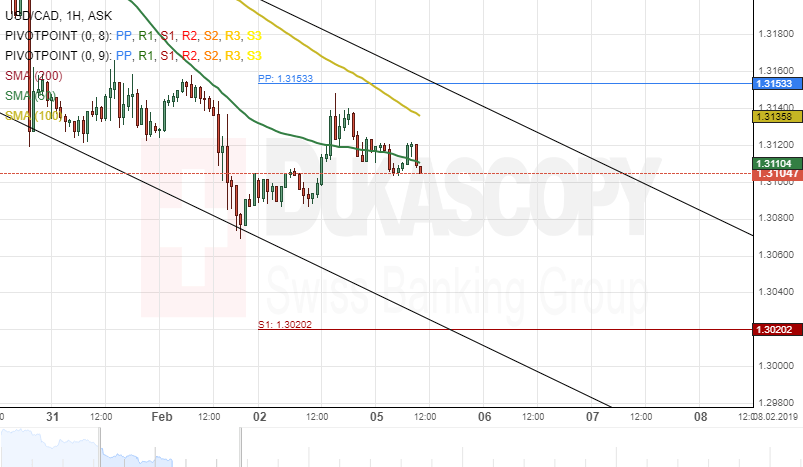
USD/CAD Analysis: Moving Along 50-Hour SMA
USD/CAD moving along 50-hour SMA The US Dollar maintained a junior descending channel pattern against the Canadian Dollar on Monday. The currency pair gained about 59 base points during yesterday's trading session.
The exchange rate was trading along the 50-hour simple moving average during the first half of Tuesday's trading session.
The short-term target for the currency exchange rate will be near a resistance cluster formed by the weekly pivot point and the upper boundary of the junior descending channel pattern at 1.3153.
The pair could make a pull-back from the resistance cluster as mentioned above.
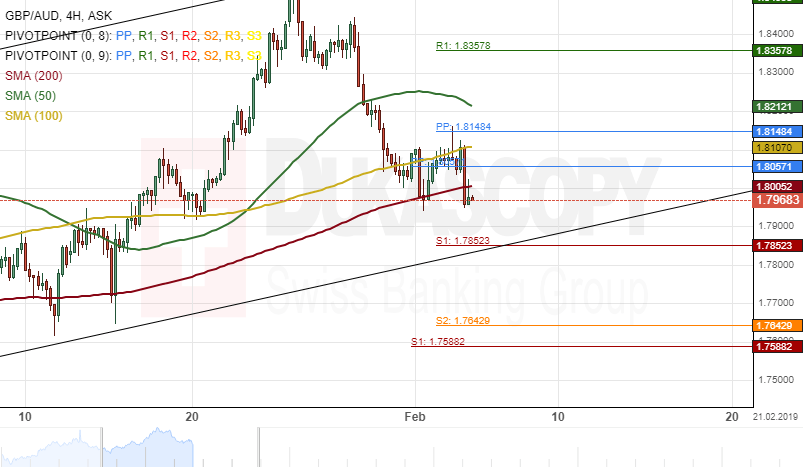
GBP/AUD 4H Chart: Bearish Sentiment Likely To Continue
The Pound Sterling has continued its decline against the Australian Dollar. The GBP/AUD exchange rate has lost over 500 base points of its values during the last week.
The currency pair breached both the 100– and 200-hour simple moving averages during the Asian session on Tuesday.
By and large, it is likely that the currency exchange rate continues its movement down until the pair reaches a support cluster at 1.7852.
A potential upside reversal could occur from the support cluster as mentioned earlier.
GBP/CAD 4H Chart: Sets For Breakout
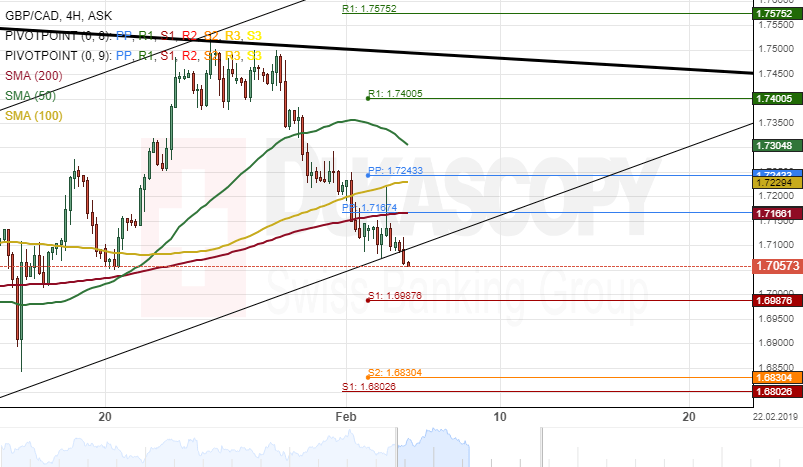
The British Pound has depreciated about 2.37% of its values against the Canadian Dollar during the last week. The decline began after the exchange rate tested the upper boundary of a dominant descending channel pattern at 1.7500 on January 29.
The currency pair is currently trading near the bottom border of an ascending channel at 1.7093 and could be set for a breakout.
If this breakout occurs, the currency exchange rate will target a swing low of 1.6830 during the following trading sessions.
However, if the bottom border of the channel pattern holds, the pair could aim for the 50-hour SMA at 1.7319 within this session.