

Sample Category Title
The Analytical Overview Of The Main Currency Pairs
The EUR/USD currency pair
Technical indicators of the currency pair:
Prev Open: 1.14461
Open: 1.14511
% chg. over the last day: +0.12
Day's range: 1.14380 – 1.14598
52 wk range: 1.1214 – 1.2557
On Friday the financial markets participants evaluated the labour reports from the US. In January the number of employees in the non-agricultural sector of the country reached 304 000 which was way above the predicted 165 000. At the same time, the other key indicators had a negative effect: the growth of the hourly wage slowed down from 0.4% (m/m) to 0.1% (m/m), while the unemployment level grew to 4%. The industrial PMI by ISM grew by 4.2% in January, up to 56.6. The attention will be focused on the statements by Donald Trump and the Federal Reserve representatives. Right now the currency pair is consolidating around 1.14350-1.14600. You should open positions from these levels.
At 17:00 (GMT+2:00) the US will publish the report on the industrial orders' volume.
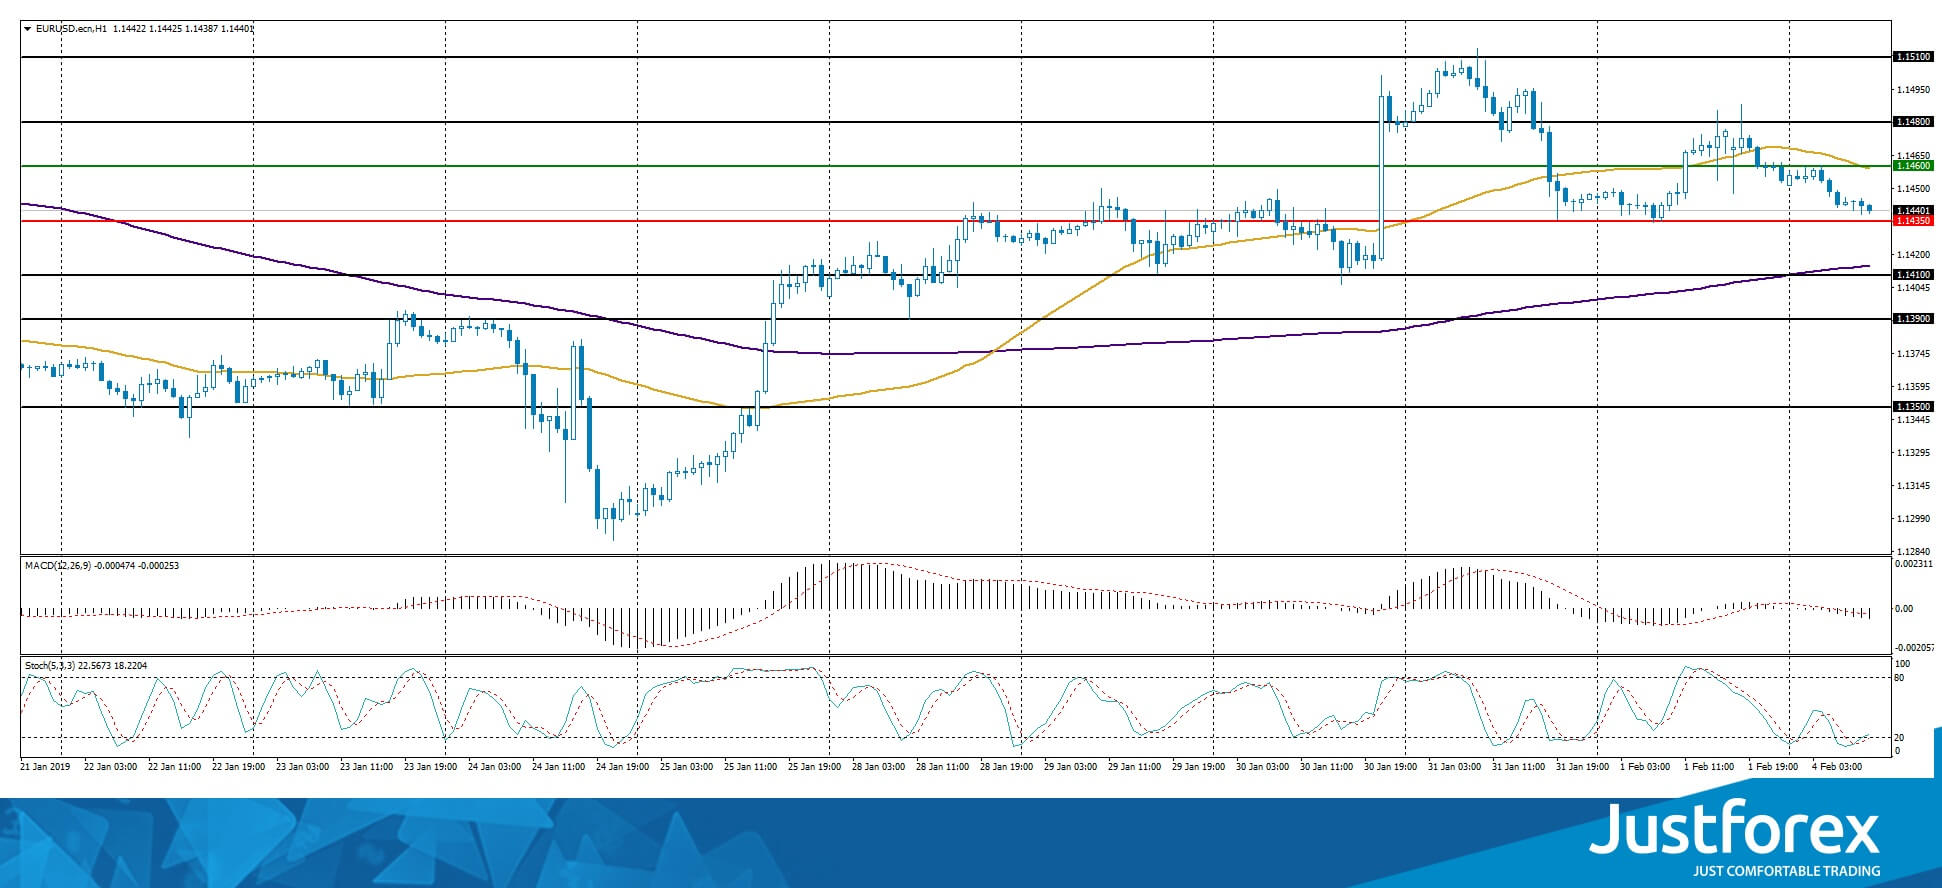
The indicators don't provide precise signals, the price fixed between 50 MA and 200 MA.
The MACD histogram is in the negative zone and below the signal line, which gives a strong signal to sell EUR/USD..
The Stochastic Oscillator is around the oversold zone, the %K line is crossing the %D line. There are no signals at the moment.
Trading recommendations
Support levels: 1.14350, 1.14100, 1.13900
Resistance levels: 1.14600, 1.14800, 1.15100
If the price fixes below the 1.14350 mark, expect the quotes to descend toward 1.14000-1.13800.
Alternatively, the quotes can recover toward the round 1.15000.
The GBP/USD currency pair
Technical indicators of the currency pair:
Prev Open: 1.31010
Open: 1.30612
% chg. over the last day: -0.12
Day's range: 1.30552 – 1.30960
52 wk range: 1.2438 – 1.4378
GBP/USD remains ambiguous, keeps trading in a flat. The financial market participants are waiting for new information on Brexit. Keep an eye on the UK economic reports and open positions from the key levels of 1.30500 and 1.31000.
The Economic News Feed for 04.02.2019:
Construction PMI (UK) – 11:30 (GMT+2:00);
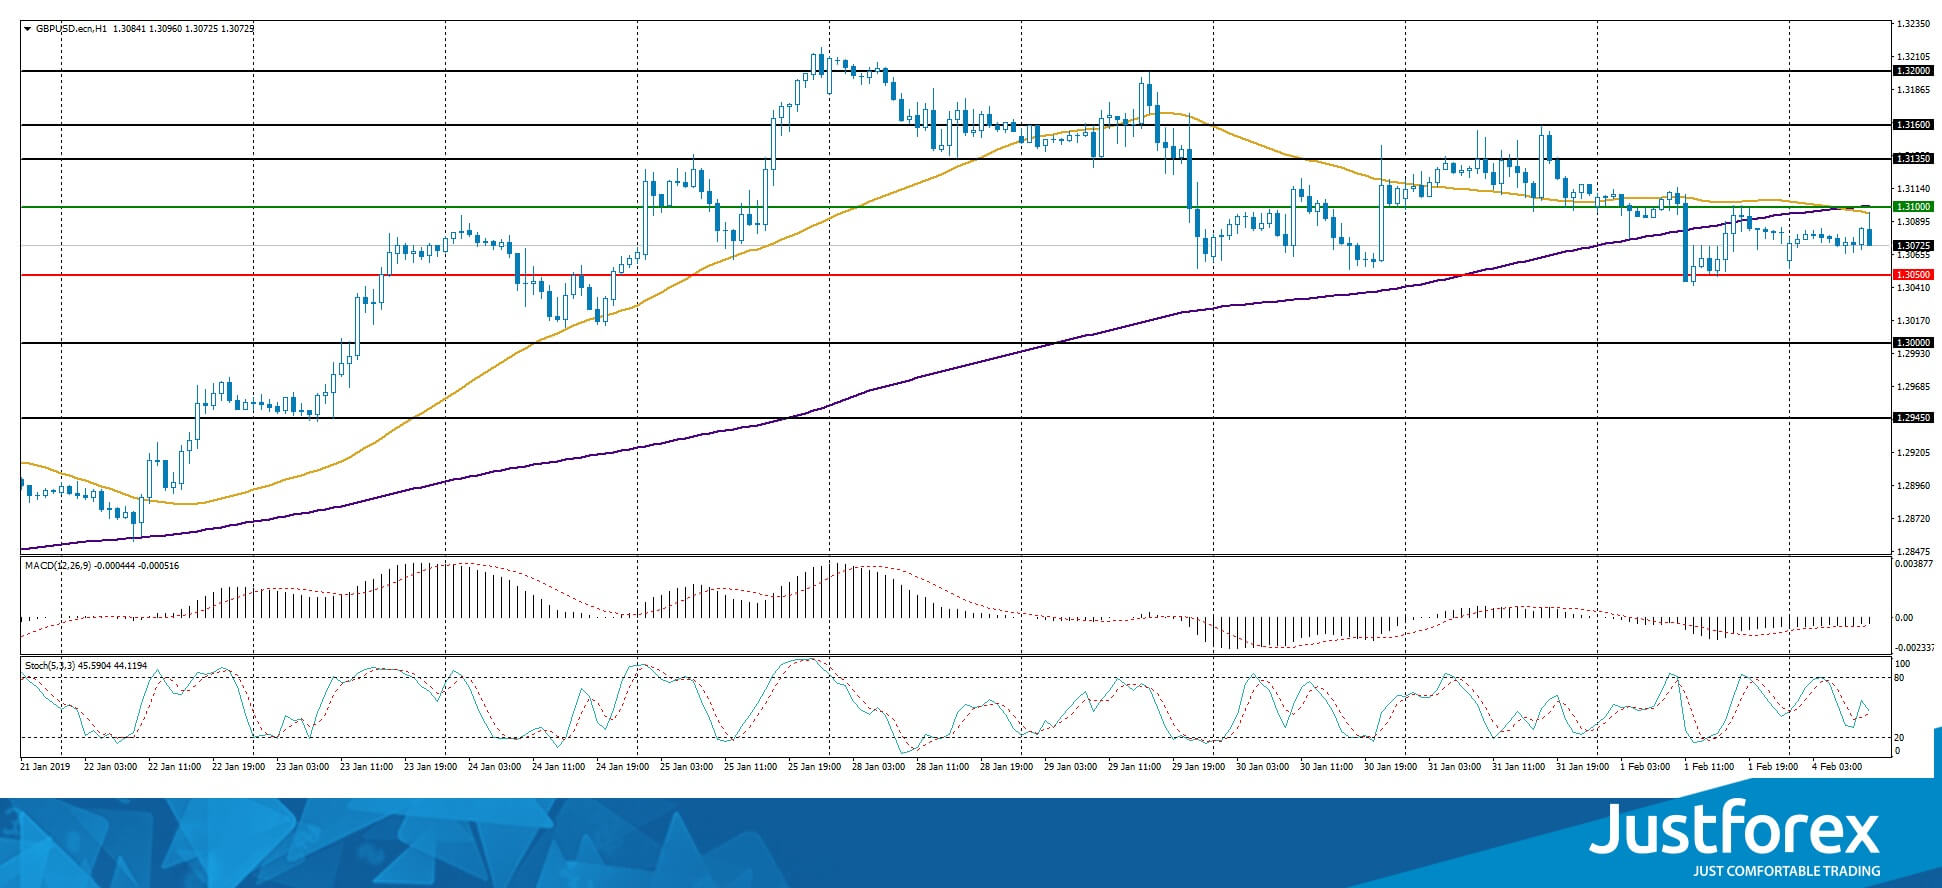
The indicators do not provide precise signals, 50 MA is crossing 200 MA.
The MACD histogram is in the negative zone but above the signal line, which gives a weak signal to sell GBP/USD.
The Stochastic Oscillator is in the neutral zone, the %K line is crossing the %D line. There are no signals at the moment.
Trading recommendations
Support levels: 1.30500, 1.30000, 1.29450
Resistance levels: 1.31000, 1.31350, 1.31600
If the price fixes below the key support of 1.30500 expect the quotes to correct toward 1.30000.
Alternatively, the quotes can recover toward 1.31350-1.31600.
The USD/CAD currency pair
Technical indicators of the currency pair:
Prev Open: 1.31213
Open: 1.30891
% chg. over the last day: -0.18
Day's range: 1.30836 – 1.31065
52 wk range: 1.2248 – 1.3664
USD/CAD remains in a bearish mood, the quotes are consolidating around the 3-month minimums of 1.30700-1.31200. A technical correction is possible soon. Keep an eye on the oil quotes and open positons from the key levels.
The Economic News Feed for 04.02.2019 is calm.
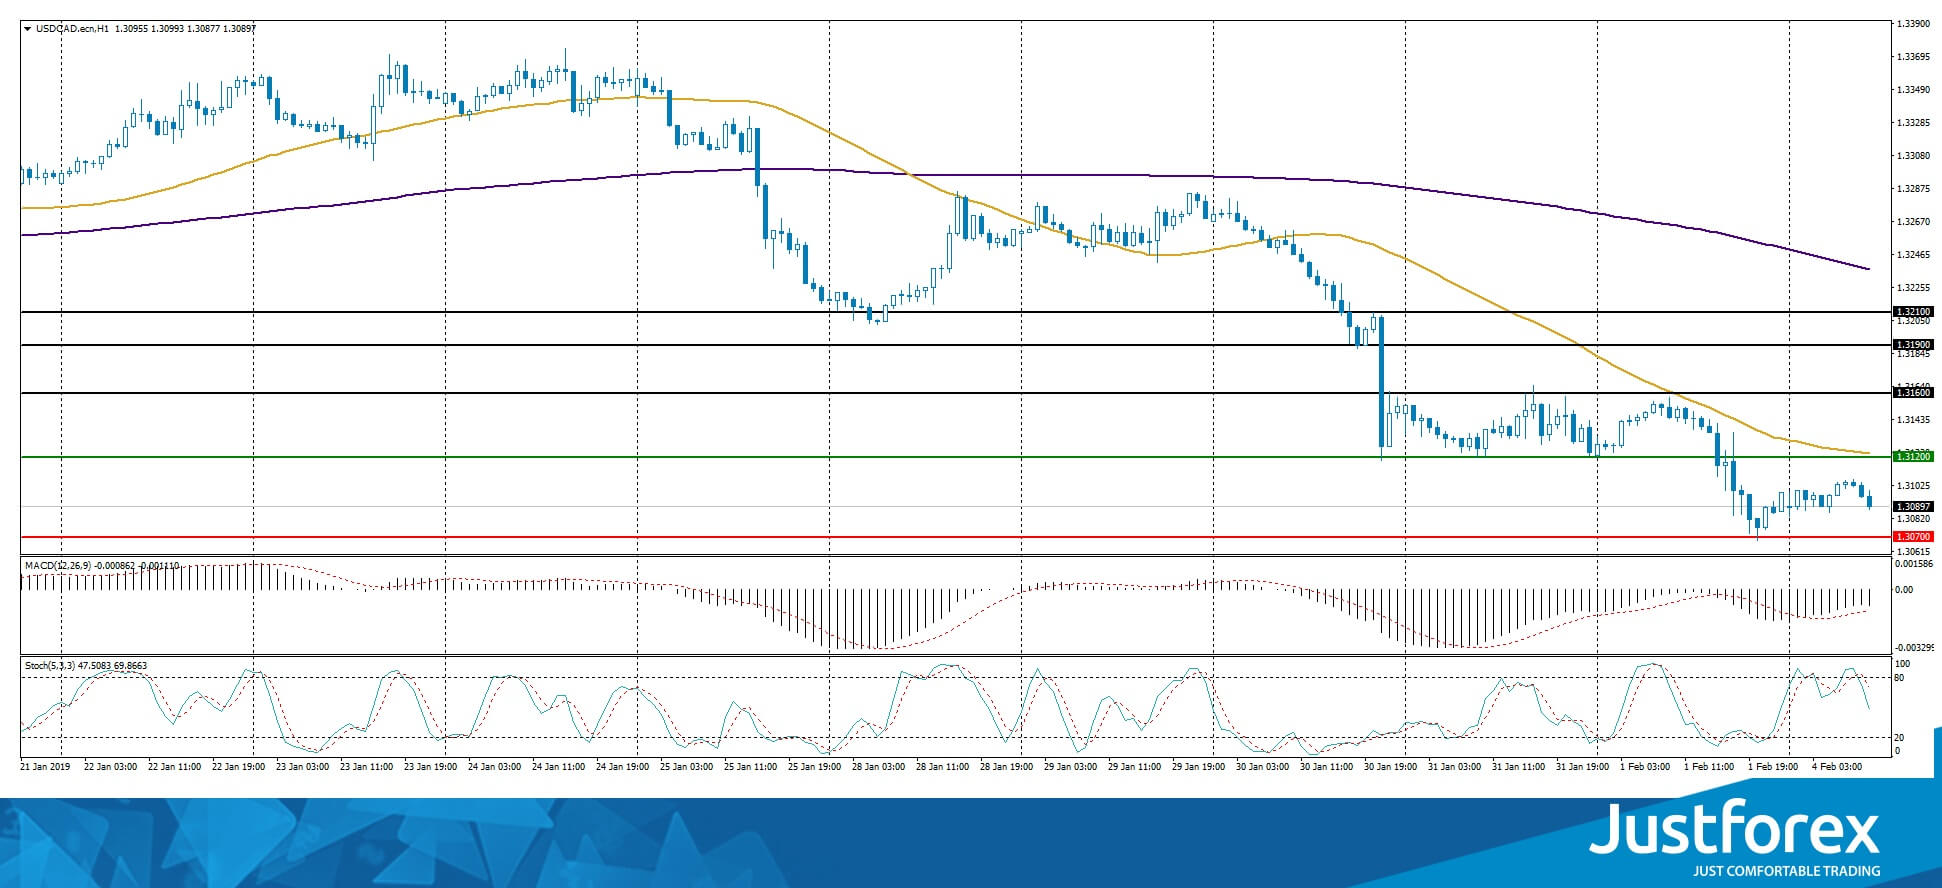
The price fixed below 50 MA and 200 MA which points to the power of the sellers.
The MACD histogram is in the negative zone but above the signal line which gives a weak signal to sell USD/CAD.
The Stochastic Oscillator is in the neutral zone, the %K line is below the %D line which also points toward a downward trend.
Trading recommendations
Support levels: 1.30700, 1.30200, 1.30000
Resistance levels: 1.31200, 1.31600, 1.31900
If the price fixes below 1.30700 expect the USD/CAD quotes to fall toward 1.30300-1.30000.
Alternatively the quotes can grow toward 1.31400-1.31600.
The USD/JPY currency pair
Technical indicators of the currency pair:
Prev Open: 108.859
Open: 109.513
% chg. over the last day: +0.57
Day's range: 109.432 – 109.909
52 wk range: 104.56 – 114.56
USD/JPY is in an aggressive buy-out, the quotes have updated the local maximums and are testing the resistance at 109.900. 109.650 acts as a mirror support. The quotes have prospects for future growth. Keep an eye on the US Treasury bonds` yield and open positions from the key levels.
The Economic News Feed for 04.02.2019 is calm.
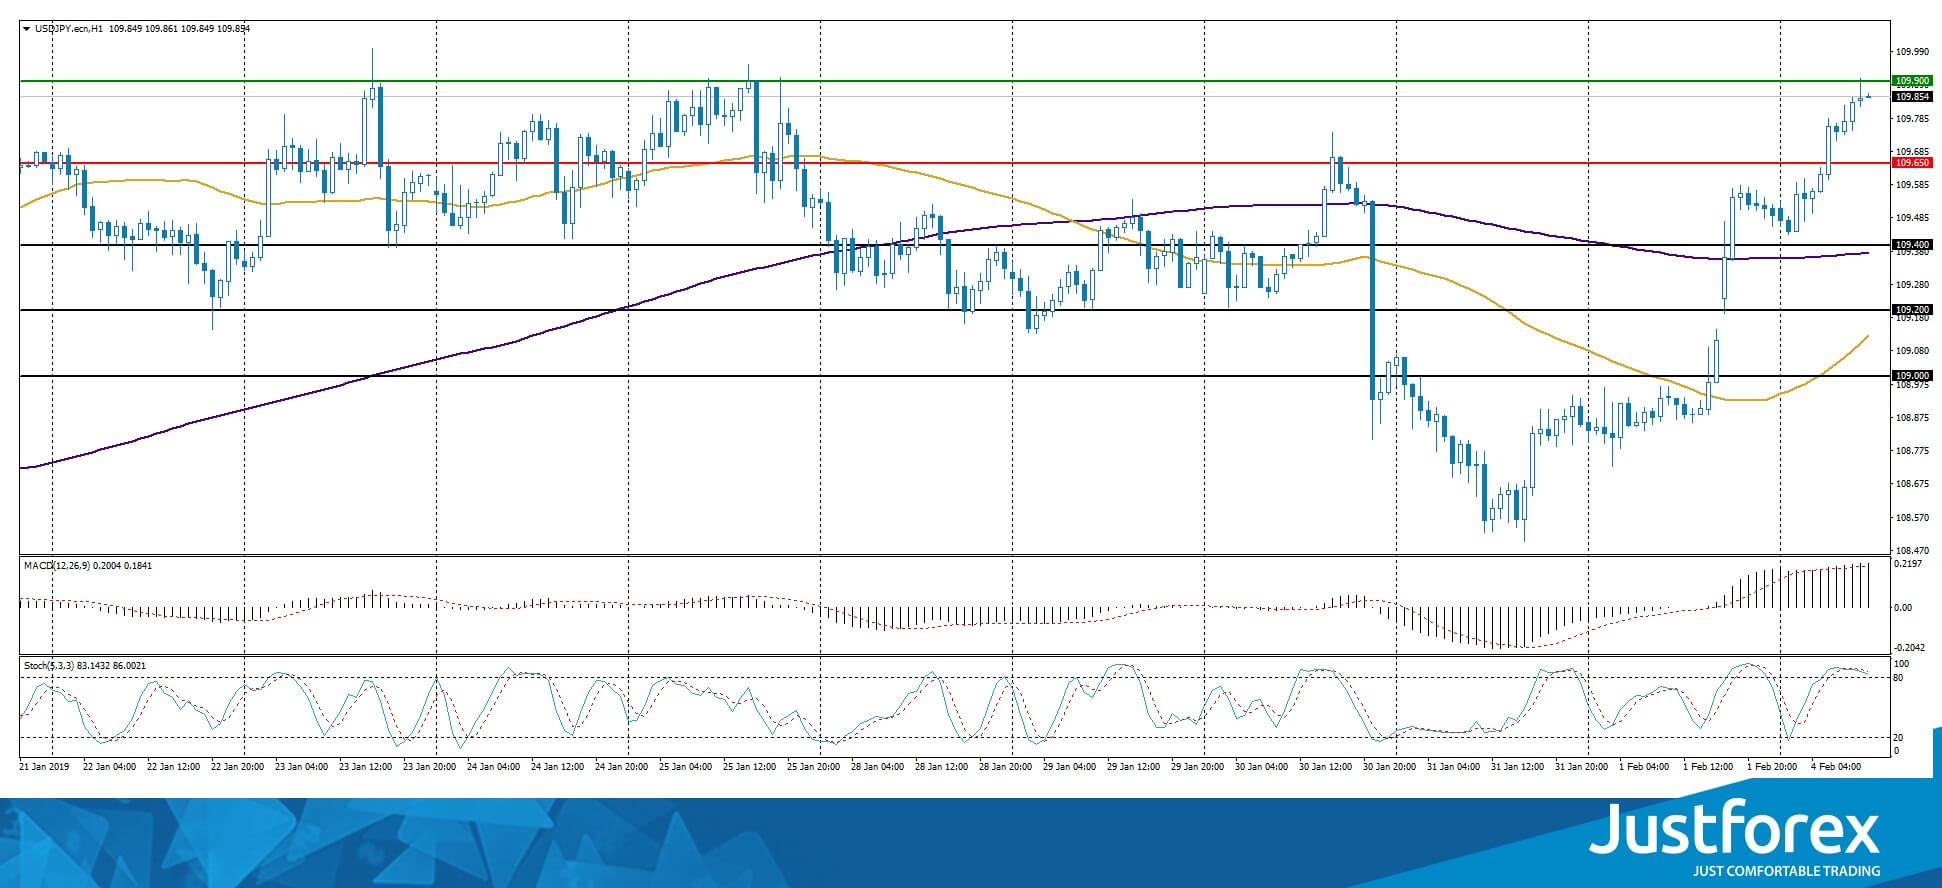
The price fixed below 50 MA and 200 MA which points to the power of the buyers.
The MACD histogram is in the positive zone and above the signal line which points to a bullish mood.
The Stochastic Oscillator is in the overbought zone, the %K line is crossing the %D line. There are no signals at the moment.
Trading recommendations
Support levels: 109.650, 109.400, 109.200
Resistance levels: 109.900, 110.400
If the price fixes above the resistance level of 109.900 expect the USD/JPY quotes to grow toward 110.300-110.500.
Alternatively, the quotes can descend toward 109.500-109.400.
The US Dollar Index Is Consolidating
On Friday, there was high trading activity on the currency majors. However, a unidirectional trend was not observed. The dollar index (#DX) kept the current levels. The US published ambiguous labor market data. Thus, the number of people employed in the nonfarm sector increased to 304K in January, while experts forecasted 165K. However, previous data was revised downward from 312K to 222K. Growth in average hourly earnings slowed down from 0.4% (m/m) to 0.1% (m/m). The unemployment rate rose to 4.0% in January instead of the forecasted value of 3.9%. The ISM manufacturing PMI in the US counted to 56.6 in January and was better than the expected value of 54.2.
This week, financial market participants will closely monitor political events. On Tuesday, the US President, Donald Trump, will give an annual speech to the US Congress. The main theme of his speech will be the problem of building a wall on the border with Mexico. Also, several speeches by the Fed representatives are planned to take place. The speech by Fed Chairman, Jerome Powell, will be the key event on Wednesday, February 6.
The "black gold" prices are stable after growth the day before. At the moment, futures for the WTI crude oil are testing $55.60 per barrel.
Market Indicators
- On Friday, there was a variety of trends in the US stock market: #SPY (+0.05%), #DIA (+0.14%), #QQQ (-0.42%).
- The 10-year US government bonds yield has been growing. Currently, the indicator is at the level of 2.68-2.69%.
Economic Data on 04.02.2019:
- The index of economic activity in the UK construction sector at 11:30 (GMT+2:00).
- We also recommend following the up-to-date information regarding the trade conflict between the US and China, as well as the Brexit process.
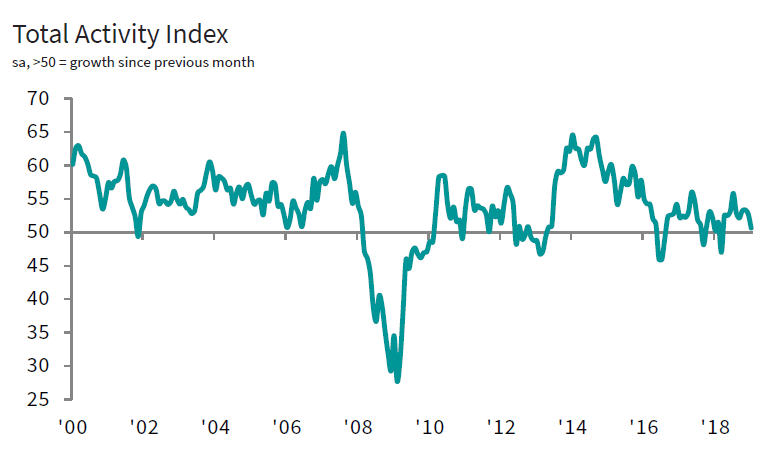
UK PMI construction dropped to 50.6, growth shifted down a gear
UK PMI construction dropped to 50.6 in January, down from 52.8 and missed expectation of 52.6. That's the slowest rise in business activity for ten months. Also, commercial work remains weakest performing area and employment growth hits two-and-a-half year low
Tim Moore, Economics Associate Director at IHS Markit, which compiles the survey:
"UK construction growth shifted down a gear at the start of 2019, with weaker conditions signalled across all three main categories of activity. Commercial work declined for the first time in ten months as concerns about the domestic economic outlook continued to hold back activity. The latest survey also revealed a loss of momentum for house building and civil engineering, although these areas of the construction sector at least remained on a modest growth path.
"Staff recruitment slowed to a crawl in January, with construction firms reporting the softest rate of job creation since July 2016. Delays to client decision making on new projects in response to Brexit uncertainty was cited as a key source of anxiety at the start of 2019. Difficulties converting opportunities to sales were reflected in a slowdown in total new business growth to its lowest since last May.
"Business expectations for the year ahead slipped to a three-month low and remained subdued in comparison to historic trends in January. Positive sentiment towards the outlook for civil engineering work remains a key factor helping to support business sentiment across the construction sector, according to survey respondents."
USD/JPY Outlook: Recovery Extension Pressures Pivotal 110 Barrier
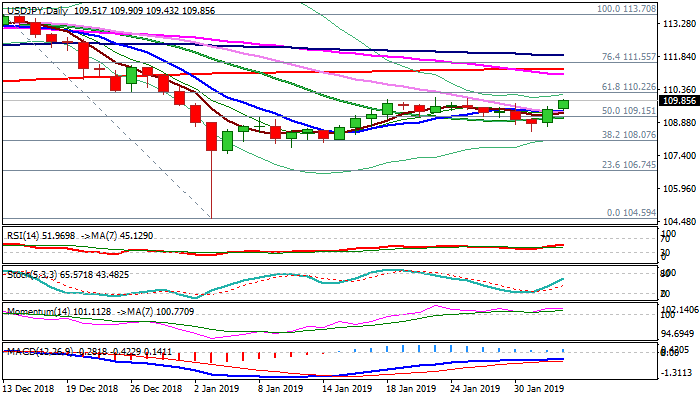
The pair extends recovery on Monday and pressures pivotal 110 barrier, as rebound after last week's hammer reversal nearly fully retraced 110.00/108.49 pullback.
Technical studies are bullishly aligned but may lack bullish momentum for final break above 110 pivot, with lower volumes expected on Lunar New Year in Asia.
Bullish scenario requires firm break above 110.00 (23 Jan high) and 110.22 (Fibo 61.8% of 113.70/104.59) for confirmation and extension towards 111.24 (200SMA).
Repeated rejection at 110 barrier would signal extended congestion, with weaker near-term structure on extension below 10SMA (109.40).
Res: 110.00, 110.22, 110.57, 110.92
Sup: 109.74, 109.40, 109.12, 108.72
Eurozone Sentix investor confidence: Growth forces weakening dangerously quickly and strongly
Eurozone Sentix Investor Confidence dropped to -3.7 in February, down from -1.5 and missed expectation of -1.1. That's the sixth decline in a row and the lowest level since November 2014. Current situation index dropped to 10.8, down from 18.0. That's also the sixth decline in a row and lowest since December 2016. Expectations index, however, improved from -19.3 to -17.3.
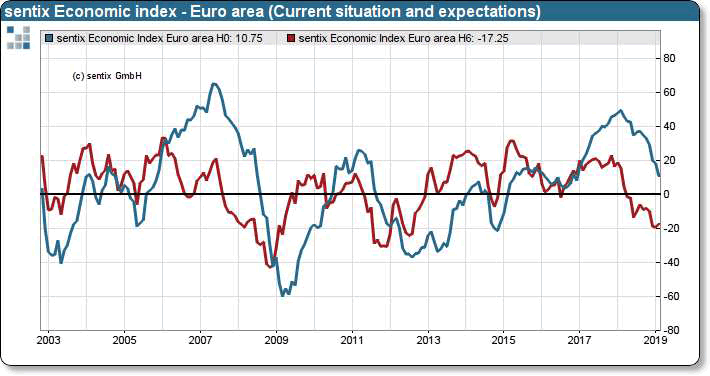
Sentix noted that "the bad news for the economy in Euroland is not abating." And, "at the current edge the growth forces seem to be weakening dangerously quickly and strongly." The main reason for the development was likely the approaching Brexit. And, "The economy now has to deal with the contingency plans in view of the unresolved political situation. Many companies exposed to UK-EU trade are currently not aiming for growth; they would probably be satisfied with stable business in the coming months."
EUR/USD Outlook: Pullback After Multiple Upside Rejections Still Holding Above Strong Support Zone
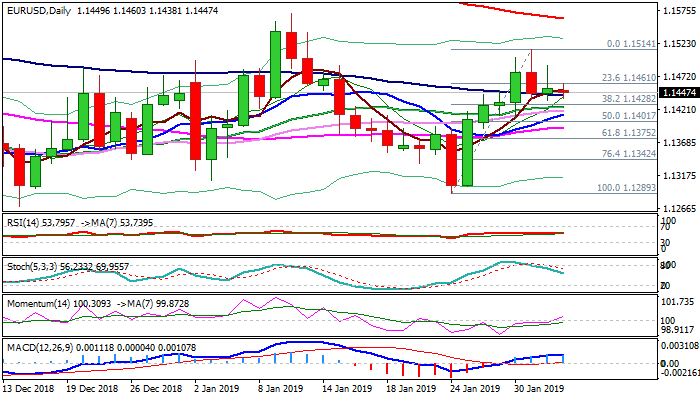
The Euro started the week at the back foot, following strong upside rejections at 1.1500 zone in past three days, which signaled that bulls may be running out of steam. Pivotal support at 1.1428 (Fibo 38.2% of 1.1289/1.1514, reinforced by daily Kijun-sen) stays intact for now, with plethora of supports marked by MA's and daily cloud, providing strong headwinds for bears and limiting dips. Rising bullish momentum adds to overall positive picture on daily chart (slightly offset by negative slow stochastic), keeping alive hopes of fresh upside attempts while 1.1428 support holds. Otherwise, deeper correction of 1.1289/1.1514 rally could be expected, with close below 1.1392/84 (55SMA/daily cloud base) to neutralize bulls and shift near-term bias into bearish mode.
Res: 1.1460, 1.1488, 1.1561, 1.1569
Sup: 1.1428, 1.1400, 1.1384, 1.1375
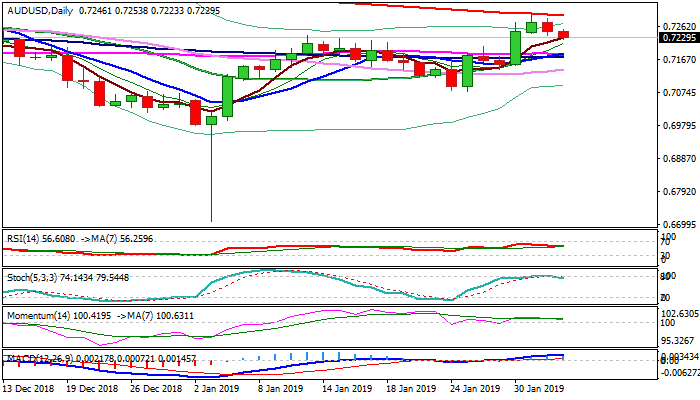
AUD/USD Outlook: Aussie Extends Pullback After Downbeat Data, RBA In Focus For Fresh Signals
The Aussie dollar holds in red in early Monday's trading, maintaining negative near-term tone after last week's rejection at 200SMA (0.7293) and Friday's bearish outside day which was negative signal.
Downbeat Australian building approvals data, released in Asia on Monday (Dec -8.4% vs 2.1% f/c) added to negative tone.
Weakening momentum and slow stochastic turning south after brief probe into overbought territory are also negative signals.
Dips eye daily cloud top (0.7205) violation of which would signal further easing and expose pivotal supports at 0.7184/74 zone (converged 10/20/55/100SMA's) where correction should find footstep to keep bulls in play for renewed attempt at 200SMA Conversely, reversal confirmation could be expected on sustained break below 0.7156 ( (daily cloud base/Fibo 61.8% of 0.6706/0.7295 rally. Focus turns towards Tuesday's RBA interest rate decision, with the central bank widely expected to keep rates unchanged at 1.5%, but traders will be looking for fresh signals from post-meeting statement.
Res: 0.7253, 0.7284, 0.7293, 0.7355
Sup: 0.7205, 0.7184, 0.7174, 0.7156
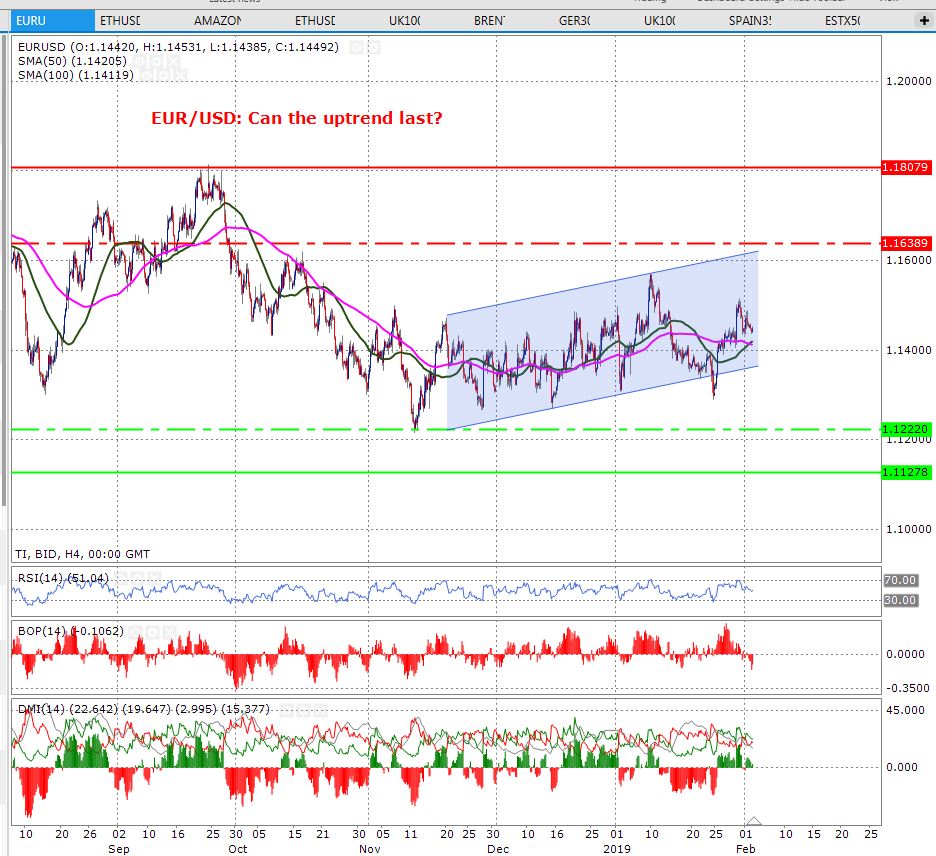
Euro Could Lose Its Upward Trend
The EUR/USD price is trading in an upward channel on a 4-hour time frame. This confirms the fact that the uptrend is intact and the bias remains to the upside. Further confirmation can also be seen by looking the price with respect to the important moving averages; the price is trading above the 50 and 100-day moving averages (shown in green and pink colour respectively). This confirms that the trend is skewed to the upside.
Having said this, the balance of power indicator is showing a change in momentum, it shows that the bears are picking up the steam and it is highly likely that the price may change its direction.
The RSI indicator is also confirming the fact that the bulls are losing control of the price and the price has retraced from its overbought zone.
The resistance zones are shown by the horizontal red lines and the support zones are shown by the horizontal green lines.
Europe Flat As Asia Goes Into Holiday Mode
Traders not sure what to make of jobs data
It's shaping up to be a pretty slow start to the week, with Europe getting little direction from Asia trade overnight where various countries join China in celebrating new year in the coming days.
There isn't much in store in Europe and the US on Monday either that will dramatically change this. Last week was packed with major political and economic events but this week looks very different, which may take its toll on volumes but also direction.
The US jobs report gave investors a bit of a lift on Friday, with job creation well exceeding expectations – 304,000 - and the shutdown having no clear negative impact on the numbers. The huge downward revision to the December number may have taken some of the edge off the report as investors seemed to battle with what the report actually means. Is the economy far better off than we think? Is the expected slowdown exaggerated? Are people's views of the Fed too dovish? We seem to be in a state of mild confusion at this moment in time.
Gold eyeing test of $1,300 from above on stronger dollar
We have seen some gradual improvements in the dollar since the immediate whipsaw price action which suggests that traders are taking the report at face value rather than looking for the hidden negatives or missed signals. That said, the upside has been mild under the circumstances so there is still a big element of suspicion around the reports we've seen over the course of the shutdown.
The gains we've seen in the dollar have taken the shine off gold, which has come under a little pressure in recent session. Still, the yellow metal trades above $1,300 and is yet to test this level from above. We may see that in the coming days and should it hold and rotate higher, it would be viewed as confirmation of the initial break and be a very bullish signal.
Oil traders less uncertain as jobs data brings strong gains
There was clearly no ambiguity in the jobs data among oil traders, with WTI and Brent both getting a significant boost from the report, with further gains coming later in the session as Baker Hughes confirmed the number of US oil rigs had fallen by 15 last week. This continues a trend that started following the peak in November but the pace is picking up.
Lower oil prices are clearly not just bad for OPEC nations and is taking its toll on US producers also. Any sign that US supply growth – which is currently at record levels around 11.9 million barrels a day – is slowing or reversing is bullish for crude at these levels. The key resistance levels in WTI and Brent though - $55 and $65 – remain intact for now although the former is flirting just above here. A clear break has not yet happened though.
European Stocks Trade Lower, UK’s PMI Data Ahead
European markets are trading lower as investors are more cautious with their approach after the US NFP data. It was a robust number, not many expected the reading to come in at 304K but a lot of shine was taken off because the wage growth number slipped back and for investors that were a deal breaker. No one wants to see the wage growth number to lose momentum and given that the number missed the expectations by 0.1%, this means that the Fed has no leg to stand on with respect to their hawkish monetary policy.
Back in the UK, the prime minister will be heading back to Brussels with the only purpose in her mind that she needs to win some concessions. However, the EU leaders have been very firm with their approach and they have told the prime minister that there is nothing here for her because the deal she has is the only deal she is going to get.
This opens the door wide open for a possibility of the UK tumbling out of Europe with no deal. It is this threat which has made manufacturers really nervous and they are looking for alternatives. For instance, the Japanese car marker’s decision to ditch its second plant for the new vehicles is the direct of this result of this. In the past, the UK’s government bent many roles to keep Nissan in the country. But obviously, the firm needs to have its own safety net and their decision is based on this. These circumstances have made the traders a little nervous and this is the reason that we are seeing weakness in sterling.
In terms of economic data, we have the UK’s construction PMI’s number due later in the morning and the forecast is little on the soft side. The previous reading was 52.8 and expectations 52.6.