Sample Category Title
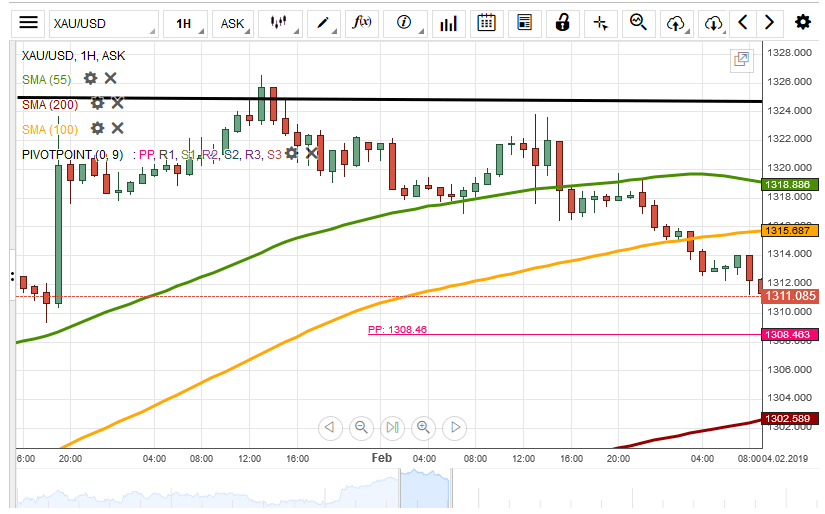
XAU/USD Will Be Retraced By PP At 1,308.46
During Friday's trading session, the yellow metal passed through the support level of the 55-hour simple moving average to the 1,314.00 mark. On Monday morning, the gold was depreciating against the US Dollar to pass through the support of the 100-hour simple moving average to 1,310.75.
Most likely, the yellow metal will bounce off the monthly pivot point at 1,308.46 to stay at the 1,312.00 level during the trading session.
However, the gold could pass through the support level of the monthly pivot point at 1,308.46 to trade near the 200-hour simple moving average at the 1,30.50 mark.
Elliott Wave Analysis: AUD/USD Intra-day View
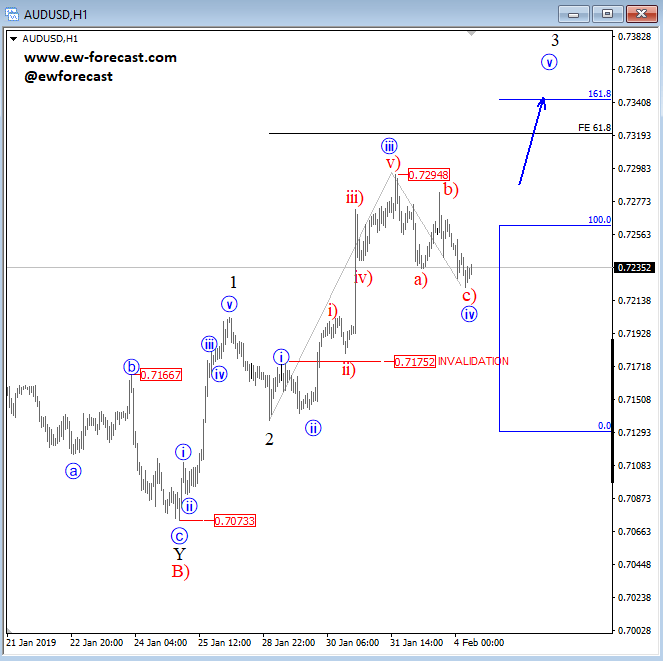
The USD NFP report caused some choppy price action since Friday when dollar moved lower and then recovered against the majors. So this unclear direction suggest that we shall stay unchanged regarding the wave counts, and corrective price action can be happening here.The first market I am looking at today is AUDUSD which came down nicely from the high; so far in three legs so we may see a new turn up this week to 0.7300, while market is trading above 0.7175 invalidation mark.
AUDUSD, 1h
WTI Oil Outlook: Extended Bulls Look For Clear Break Above Pivotal $55.55 Fibo Barrier
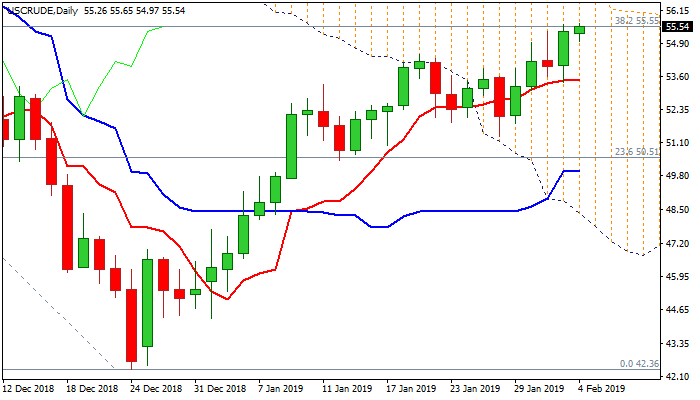
WTI oil maintains positive tone on Monday and hit new 2019 high at $55.65 (upper 20-d Bollinger band) on renewed probe through pivotal $55.55 barrier (Fibo 38.2% of Oct/Dec $76.88/$42.36 fall).
Oil advanced 2.4% on Friday, boosted by tighter oil market on US sanctions on Venezuela, with OPEC supply cut and lower number of US oil rigs, adding to positive sentiment.
Sustained break above cracked $55.55 barrier is needed for strong bullish signal and acceleration towards next pivotal barrier at $57.39 (daily cloud top).
Bullishly aligned daily techs are supportive, however, risk of further hesitation at $55.55 pivot cannot be ruled out as slow stochastic is entering overbought territory and bullish momentum is weakening.
Dip-buying scenario could be anticipated while rising 10SMA ($53.64) holds.
Loss of 10SMA support would be initial negative signal, while extension and close below ascending 20SMA ($52.90) would sideline bulls and risk deeper pullback.
Res: 55.65, 56.00, 57.39, 57.56
Sup: 54.97, 54.47, 53.64, 52.90
GBP/USD Outlook: Cable Retests Key 200SMA Support After Downbeat UK Data Further Weakened Near-Term Structure
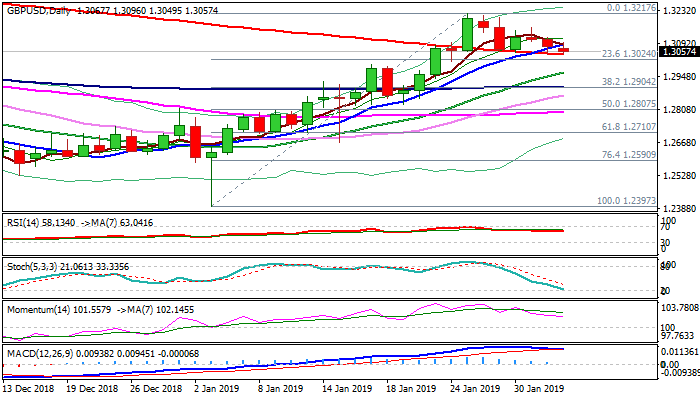
Cable remains in red for the third straight day and retests key 200SMA support (1.3045) on Monday, after downbeat UK construction PMI (Jan 50.6, the lowest in 10 months vs 52.4 f/c), further weakened negative near-term sentiment. South-heading momentum and formation of 5/10SMA add to negative outlook but bears for now face strong headwinds from 200SMA support. Sustained break below 200SMA would generate strong bearish signal for extension of pullback from 1.3217 (25 Jan high) towards 1.2965 (rising 20SMA) and more significant support at 1.2904 (Fibo 38.2% of 1.2397/1.3217/100SMA). Conversely, close above 10SMA (1.3087) would ease immediate bearish pressure, but return and close above 1.3160 (31 Jan lower top) would neutralize and re0focus 1.3217 peak.
Res: 1.3087, 1.3114, 1.3160, 1.3217
Sup: 1.3045, 1.3000, 1.2965, 1.2904
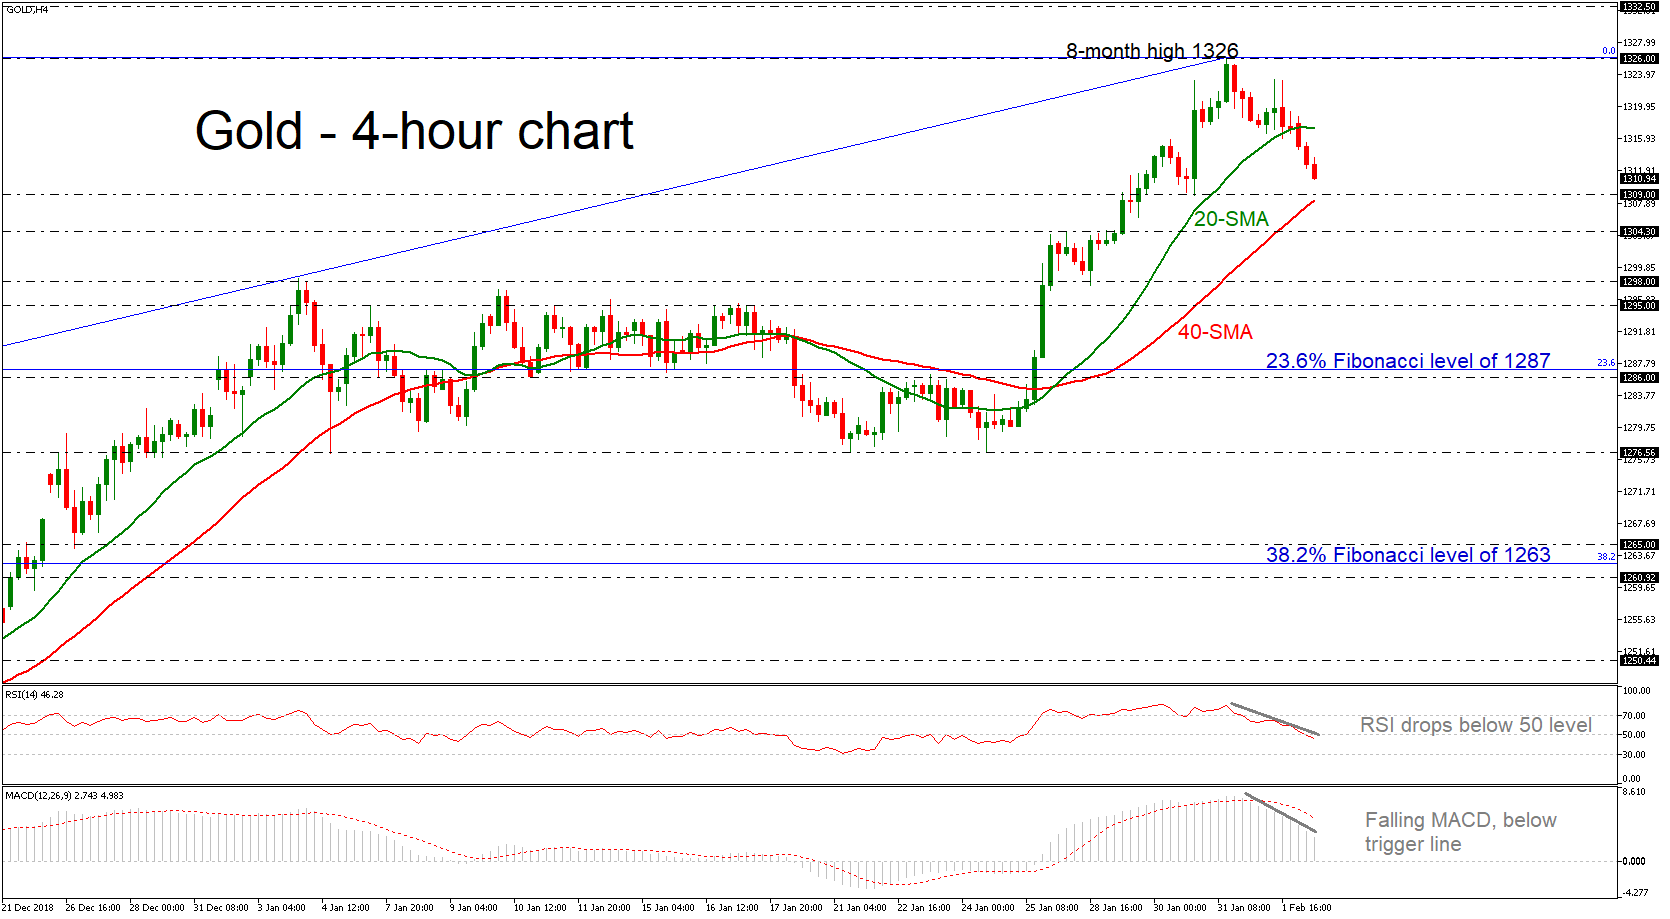
Gold Retreats From 8-Month High, Slips Below 20-SMA
Gold price reversed back to the downside and dropped below the 20-simple moving average (SMA) in the 4-hour chart after finding strong resistance at the eight-month high of 1326 in the prior week. The bias in the very short-term looks bearish as indicated by the RSI which has already entered the negative territory, while the MACD keeps falling below the trigger line, embracing this view as well.
Further declines may meet immediate support around 1309, taken from the latest lows, while slightly lower the 40-SMA could act as strong barrier for the bears. More downside pressures could send the price towards the 1304.30 hurdle, identified by the inside swing top on January 28, before attention shifts towards the 1298 region.
On the other side, resistance could occur around the 20-SMA currently at 1317.50. Even higher, the price could meet a stronger obstacle around the eight-month high of 1326, while a rally above this point could hit the 1355 peak on April 2018.
In the medium-term picture, the market is strongly bullish thanks to the rebound on the 1160 level on August 2018. However, the latest pullback suggests that the bullish action may calm down in the near term.
EU: Weak Growth, Accelerating Inflation
The Eurozone is walking a tightrope. Q4 2018 data suggests the European economy is growing slowly amid softer Chinese demand, Sino-American discord and a Brexit stalemate. After a 2018 yearly GDP gain of 1.20%, a 5-year low, inflation appears to have picked up. The contribution of higher wages is finally taking effect. The recent rise in January core inflation rate to 1.10% (prior: 1%), attributable to services, as well as the continued drop in unemployment rate (+ 7.90% as of December 2018) should support the European economy.
Although the European Central Bank forecasts core GDP and inflation to reach 1.50% and 1.60% respectively in 2019, we think these might be revised at the next monetary policy committee in March 2019. We do not expect the ECB to change its stance on stimuli, as risk of a recession in the EU is very low. A stabilization in the EU economy is feasible if current issues, including a US–China trade truce and a soft Brexit, are realised. The upbeat US employment numbers from last Friday should support the greenback against the EUR short-term.
Australia to maintain wait-and-see
Australia's central bank's (RBA) first policy meeting of the year is not opening in the best conditions. Unpleasant news from both home and foreign markets are weighing on the economy while optimism on growth is fading. Despite repeated intentions to raise its cash rate (currently at 1.50%), unchanged since August 2016, it appears investors are pricing in a change in the other direction. Currently trading at 0.7225, AUD/USD (+2.50%) is expected to head along 0.7220. We advocate a long position following tomorrow's meeting.
In addition to a sharp drop in Chinese demand, which accounts for more than 40% of total exports in the country, Australia is facing direct consequences, starting with a slowdown in Q4 2018 inflation data, largely below RBA's target of 2–3% while the hardest downturn remains for the property market. Building approvals are being given at a decade-low level, amid falling prices and tighter credit conditions. A positive signal remains in a vivid labour market. How dovish the RBA will be during Tuesday's monetary policy meeting? Will it lower its key rate? Risk is balanced, since the economy remains stable, thus favouring an unchanged rate.
EUR/JPY Bullish Sentiment Today
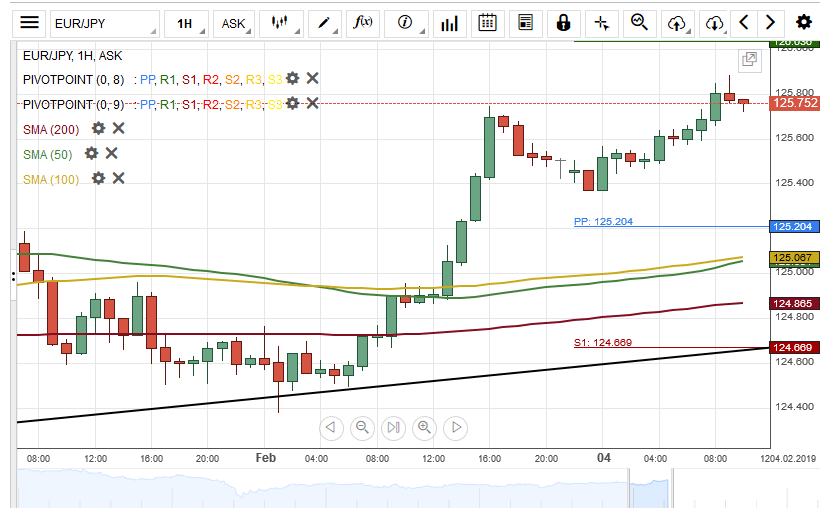
Upside risks dominated the single European currency against the Japanese Yen on Friday. The currency pair appreciated about 134 base points during Friday's trading session.
Monday's trading session began with a bullish sentiment and by the middle of the day, the exchange rate was moving towards a resistance level formed by the weekly R1 at 126.03.
Most likely, the short-term target for the currency exchange rate will be near a swing high at 127.13.
Although, the EUR/JPY is expected to make a brief pull-back from a resistance level at 126.03 today.
AUD/USD Breaches Support Cluster At 0.7226
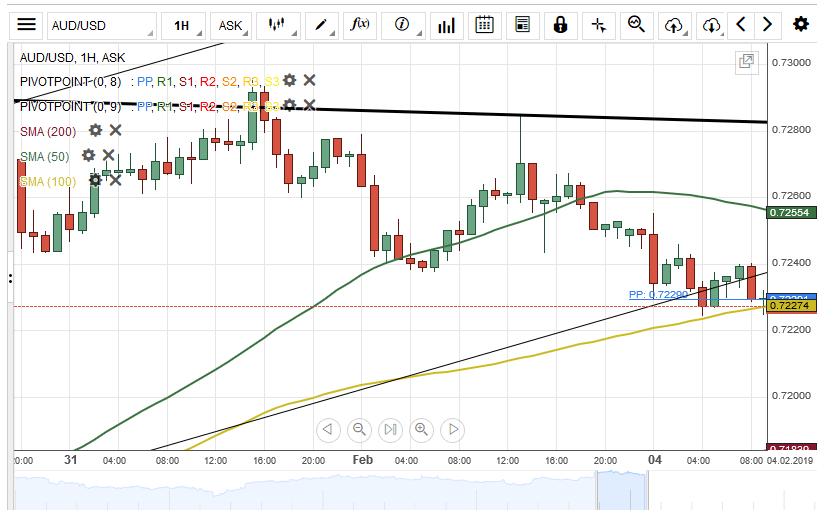
The Australian Dollar maintained a junior ascending channel pattern against the US Dollar on Friday. The currency pair breached the 50-hour simple moving average at the end of Friday's session.
However, the exchange rate tested the lower boundary of the junior ascending channel at 0.7229 during the first part of Monday's trading session.
Given that the currency exchange rate has breached the channel pattern, it is likely that bears push the pair towards the 200-hour simple moving average at 0.7162 today.
Although, the AUD/USD pair could reversal from current price level at 0.72262 and maintain the junior ascending channel pattern.
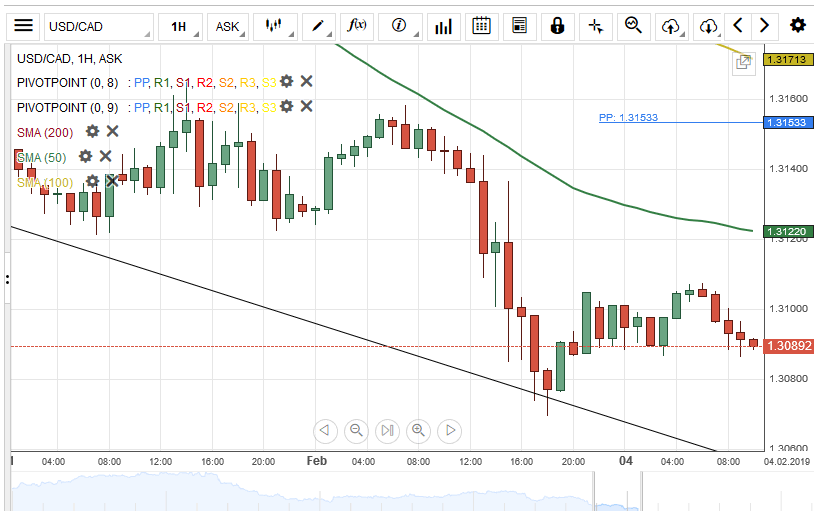
USD/CAD Pressure By 50-Hour SMA
The US Dollar depreciated about 83 base points against the Canadian Dollar on Friday. The currency pair tested the lower boundary of a one-week descending channel pattern at 1.3073 during Friday's trading session.
As for the near future, it is likely that the currency exchange rate will make a brief movement up towards a resistance level formed by a traditional weekly pivot point at 1.3153.
However, the 50-hour simple moving average at 1.3123 could drive the USD/CAD currency pair towards the bottom border of a descending channel pattern.
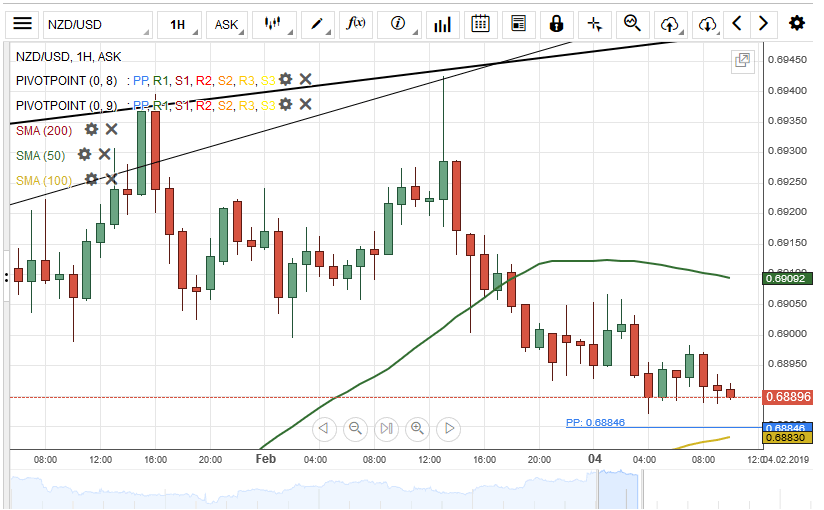
NZD/USD Stranded Between SMAs
The New Zealand Dollar depreciated about 50 base points against the US Dollar on Friday. The decline started when the currency pair tested a resistance level formed by the upper boundary of an ascending channel pattern at 0.6940.
The exchange rate was stranded between SMAs during the first part of Monday's trading session. The 50-hour simple moving average was providing resistance for the pair at 0.6910, while the 100-hour SMA was providing support at 0.6882.
A breakout from the moving averages could be expected within this session. Technical indicators suggest that bulls are likely to prevail in the market during the following trading session.