

Sample Category Title
Japan core CPI slowed more than expected to 0.7% in Dec
In December, Japan all item CPI slowed to 0.3% yoy, down from 0.8% yoy and matched expectation. Core CPI, all item ex-fresh food, slowed to 0.7% yoy, down from 0.9% yoy and missed expectation of 0.8% yoy. Core-core CPI, al item ex-fresh food, energy, stayed unchanged at 0.3% yoy.
The data showed that even discounting the fall in energy prices, consumer inflation stayed week. And apparently, the recovery is not passed on to consumers. And business remained reluctant to raise prices.
The data added to the case for BoJ to cut inflation forecasts next week. Back in October, BoJ projects core CPI to hit 1.4% in fiscal 2019 and then 1.5% in fiscal 2020. Such projections would be trimmed to reflect the decline in oil as well as global slowdown.
Germany and China signed pacts to deepen financial sector cooperation
Germany and China pledged to deepening cooperation in the finance sector and fight trade protectionism during Finance Minister Olaf Scholz's two-day visit to Beijing. And three pacts are signed, including agreements with the China Banking and Insurance Regulatory Commission and China's Securities Regulatory Commission.
Ahead of today's meeting with Chinese Vice Premier Liu He, Scholz said "it is important that, contrary to recent trends that we can observe elsewhere, we are seeing progress in our cooperation". And, "we have a lot of common interests in financial matters, and then we need to bring different perspectives together. I believe that is the very important task of this financial dialogue."
US Treasury denies rumors that Mnuchin mulls China tariff rollback
WSJ reported yesterday that US Treasury Secretary Steven Mnuchin was considering the idea of lifting some of even all of extra tariffs on Chinese imports to facilitate trade negotiation with China. But a Treasury spokesman quickly denied.
The spokesman said "neither Secretary Mnuchin nor Ambassador Lighthizer have made any recommendations to anyone with respect to tariffs or other parts of the negotiation with China." And, "this an ongoing process with the Chinese that is nowhere near completion."
Mnuchin is widely considered a dove in the trade war with China, and he has rather good relationship with Chinese Vice Premier Liu. So we won't be surprised if Mnuchin has considered or even brought out such idea. But he is often seen as isolated by others in the team on the issue. So, it doesn't really mean a thing even if he did make that suggestion.
Liu has confirmed his scheduled to visit Washington on January 30-31. The result of the meeting with USTR Robert Lighthizer then is the real key and the whole negotiation.
AUD/USD And NZD/USD Could Correct Lower
AUD/USD is currently struggling to gain bullish momentum above the 0.7220 resistance. NZD/USD is also facing hurdles and it may correct lower in the near term.
Important Takeaways for AUD/USD and NZD/USD
- The Aussie Dollar recovered recently and traded above the 0.7170 resistance against the US Dollar.
- There is a major bearish trend line in place with resistance at 0.7210 on the hourly chart of AUD/USD.
- NZD/USD is also facing a crucial bearish trend line with resistance near 0.6780 on the hourly chart.
- The pair may decline a few points towards the 0.6740 or 00.6730 support levels.
AUD/USD Technical Analysis
Recently, there was a downside move below the 0.7170 support in the Aussie Dollar against the US Dollar. The AUD/USD pair even traded below the 0.7160 level before buyers appeared near 0.7145.
A low was formed at 0.7146 on FXOpen and later the pair started a decent upside correction. It climbed above the 0.7170 and 0.7180 resistance levels, plus there was a close above the 50 hourly simple moving average.
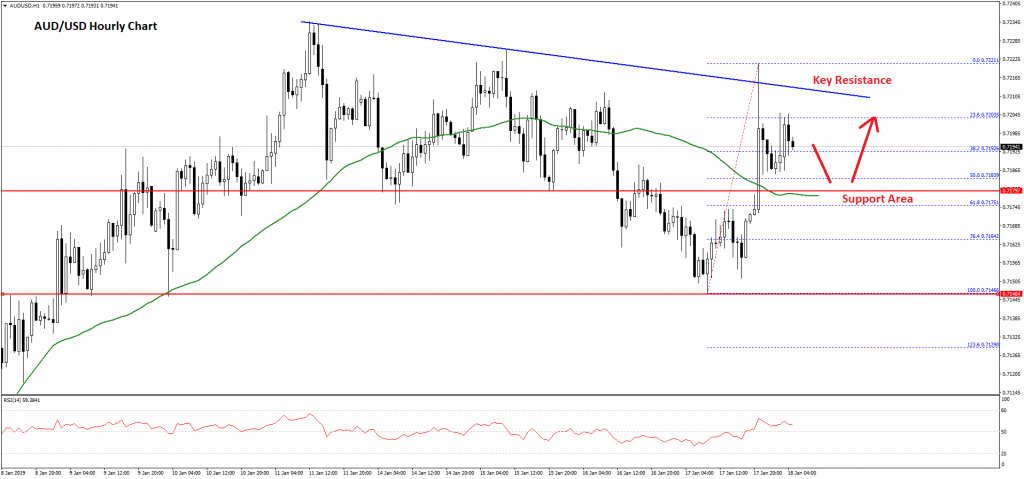
However, the pair struggled to gain traction above the 0.7220 resistance and topped near the 0.7221 level. The pair corrected below the 0.7200 level and the 23.6% Fib retracement level of the recent wave from the 0.7146 low to 0.7221 high.
On the downside, there are many key supports near the 0.7170 and 0.7180 levels. The 50% Fib retracement level of the recent wave from the 0.7146 low to 0.7221 high is also near the 0.7183 level.
Besides, the 50 hourly simple moving average is positioned near the 0.7180 level. Therefore, the pair is likely to bounce back if it declines towards the 0.7170 or 0.7180 support levels.
On the upside, there is a crucial resistance near 0.7200 and a major bearish trend line in place with resistance at 0.7210 on the hourly chart of AUD/USD. A close above 0.7210 and 0.7220 is needed for more gains in the near term. If not, the pair may slide back towards 0.7140.
NZD/USD Technical Analysis
The New Zealand Dollar started a major downward move from the 0.6850 swing high against the US Dollar. The NZD/USD pair broke the 0.6800 and 0.6780 support levels to move into a bearish zone.
There was even a break below the 0.6750 level and the 50 hourly simple moving average. The pair traded as low as 0.6727 and later started an upside correction. It moved above the 38.2% Fib retracement level of the recent decline from the 0.6848 high to 0.6727 low.
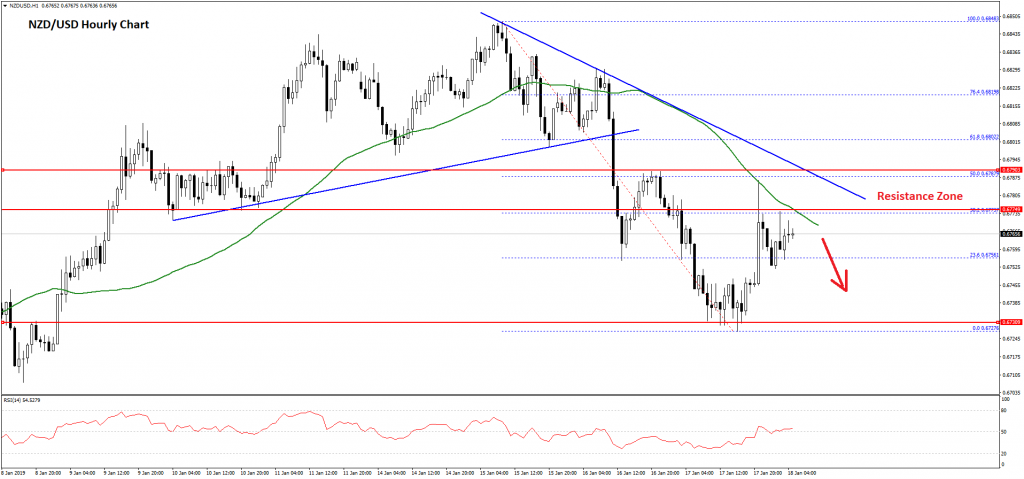
However, the pair struggled to gain momentum above the 0.6780 level and the 50 hourly simple moving average. Moreover, there is a crucial bearish trend line with resistance near 0.6780 on the hourly chart.
Finally, the 50% Fib retracement level of the recent decline from the 0.6848 high to 0.6727 low is near 0.6787. Therefore, it won’t be easy for buyers to clear the 0.6780 and 0.6800 hurdles in the near term.
As long as the pair is trading below the 0.6780 and 0.6800 resistance levels, there is a risk of a fresh decline towards the 0.6750 or 0.6730 support levels in the near term.
Fed Evans: We’re at a good point for sort of pausing rate hikes
Chicago Fed President Charles Evans said "I'm not worried about inflation getting out of hand" and Fed is "at a good point for sort of pausing" rate hikes. Though, he "wouldn't be surprised if at the end of the year we have a funds rate that's a little bit higher than where we are now." But, "that would be associated with a better economy and inflation moving up."
Evans also noted risk from uncertainties including slowdown in Europe and China, trade war. On government shutdown, he warned "the longer it goes on, I think it becomes a little bit more of a challenge, and the uncertainties mean that people are going to delay making certain types of investments, and that's not good for the outlook either."
Market Morning Briefing: Dollar Index Has Immediate Resistance Near 96.50/30
STOCKS
All the Indices, apart from the DAX have some more room on the upside in the near term, but chances of profit-taking are there. Japan, China and India look more bullish than Germany and USA.
The Dow (24370.10, +162.94, +0.67%) saw a high of 24474.46 yesterday, just shy of the upper end of our mentioned Resistance region of 24100-500. If our preferred profit-taking does not kick in now, the Dow may rise further to 25000 as well. In case selling does come in now, it can take the Dow down towards 23500.
On the DAX (10918.62, -12.62, -0.12%), however, the mentioned Resistance at 11000 is holding well enough over the last three days. If selling comes in, the DAX could dip to 10700 in the near term.
The Shanghai (2578.47) is up again today after a small dip yesterday, clearly wanting to break into higher ground. A break above 2627 (21-MA on Weekly Line chart) could propel it higher.
The Nikkei (20666, +264, +1.29%) is up strongly today after two days of minor profit-taking. Look for 20900-21200 on the upside now.
In India, the Sensex (36374.08, +52.79, +0.15%) and Nifty (10905.20, +14.90, +0.14%) continue to try and break above crucial Resistances at 36500 and 11000 respectively. Proper bullishness can set in once these are broken. Else some near-term profit-taking is possible.
COMMODITIES
Precious metals are almost stable with no major movement while crude prices and Copper have moved up.
Crude prices were trading slight lower yesterday as the US crude production neared 12 mbpd but thereafter the prices have risen slightly and are trading in the green just now.
Brent (61.67) could attempt a re-test of 62.5 while WTI (52.88) could target 54 in the near term.
Brent-WTI spread (9.09) is just above immediate resistance and could come off towards 8.35 and lower in the near term. This could be indicative of a fall in the crude prices from current levels.
Gold (1290.60) and Silver (15.55) are almost stable without any major movement. Silver could be bearish while below 16 and Gold needs to break below 1290 to indicate some weakness for the near term. Else a short term rise to 1300/20 could be a possibility before a sharp fall is seen.
Copper (2.6970) has risen and could be bullish for the near term on a break above 2.70 targeting 2.80/85 on the upside. Failure to rise past 2.70 could again bring the price back towards 2.65/60. Watch price action near 2.70.
FOREX
Currencies are mixed. Dollar index looks bearish while below 96.50. Euro, Aussie and Pound have risen and have some more scope to rise towards 1.15, 1.31 and 0.73 on the upside. Yen and Yuan may see some weakness in the near to medium term towards 110-111 and 6.83 respectively.
Dollar Index (96.06) has immediate resistance near 96.50/30 and while that holds, the index finds difficult to break on the upside just now. While below 96.50/30, it could come off towards 95.25/00 in the near term again.
Euro (1.1394) is in a near term channel uptrend and could bounce back from 1.1340 targeting 1.15-1.16 again in the near term. Before that some stability within 1.1420-1.1340 is possible.
The Euro-Yen (124.58) is looking bullish in the coming sessions towards 126-127 as indicated by the 3-day line charts. A fall towards 122.80 can be negated while the pair trades above 123.50. Near to medium term view is bearish.
Dollar Yen (109.33) has risen sharply on a rise in Nikkei. Both the equity index and Dollar-Yen look bullish for the near to medium term. Yen could weaken towards 110-111 levels soon.
Pound (1.2972) has risen sharply breaking above resistance at 1.2930. Now a rise towards 1.30/31 looks possible before a dip from there is seen. Near term is bullish before a fall from 1.31 is seen in the longer run.
Aussie (0.7194) has also moved up a bit possibly because of a rise in Copper. If copper continues to rise past 2.70, Aussie could also turn bullish towards 0.73 in the near term before falling back from there.
USD-CNY (6.7779) is nearing 6.80 as expected and could rise further towards 6.83 on a sustained rise above 6.80. Near to medium term looks bullish.
Dollar Rupee (71.0550) came off sharply from 71.40 itself, instead of moving higher towards 71.50/60. While a rise to 71.50/60 is on the cards, it could be delayed for now. Trade within 70.90-71.40 is possible in the next few sessions.
INTEREST RATES
Sharp rise in the US2Yr (2.57%, up from 2.52%), US 5Yr (2.57%, up from 2.51%) and US 10Yr (2.75%, up from 2.69%) over the last two days, perhaps mirroring the rise in the Dow. If so, some more upside could be possible in case the Dow happens to rise further towards 25000. And, also perhaps, profit-taking in the Dow could push yields lower?
As mentioned yesterday, the 30-10 Spread (0.32%) found Resistance at 0.35% and has come off a bit from there. The 30-5 Spread (0.50%) has also come off from 0.53%. Importantly, contrary to expectation, the dip has happened due to a rise in the 10Yr and 5Yr yields, rather than a dip in the 30Yr yield.
Central bank meetings coming up next week. BOJ on 23rd (Wed) and ECB on 24th (Thu). FOMC the week after, on 30th (Wed). Indian Budget on 1st Feb.
Resistance at 7.59% is holding for now on the 10Yr GOI (7.5487%). Maybe it comes down a little more ahead of the Budget? Let us see. A rise past 7.59% (if seen) takes it up to 7.70%.
USD/JPY Could Gain Bullish Momentum Above 109.50
Key Highlights
- The US Dollar traded higher and broke the 108.00 resistance against the Japanese Yen.
- There was a break above a major bearish trend line with resistance at 108.40 on the 4-hours chart of USD/JPY.
- The US Initial Jobless Claims for the week ending Jan 12, 2019 declined from 216K to 213K.
- The US Industrial Production for Dec 2018 will be released today, which could increase 0.2% (MoM).
USDJPY Technical Analysis
In the past few days, the US Dollar traded with a positive bias above 107.80 against the Japanese Yen. The USD/JPY pair must surpass the 109.50 resistance to gain further bullish momentum.
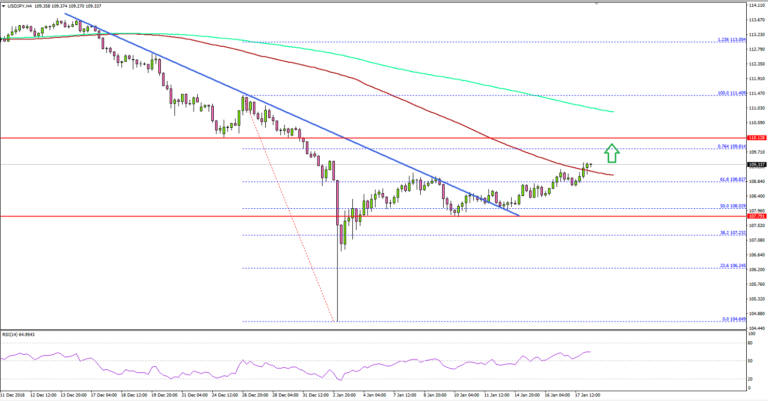
Looking at the 4-hours chart, the pair traded above the 107.50 and 107.80 resistance levels to place itself in a positive zone. There was also a break above the 50% Fib retracement level of the last decline from the 111.40 high to 104.64 low.
Moreover, there was a break above a major bearish trend line with resistance at 108.40 on the same chart. The pair even traded above the 108.80 level, but a close above the 109.50 resistance is must for an upside extension.
The next resistance is at 109.80 and the 76.4% Fib retracement level of the last decline from the 111.40 high to 104.64 low, followed by 110.00.
On the downside, the 108.00 and 107.80 levels are important supports, below which the pair may move back in a bearish zone. The next key supports are 107.20 and 106.80.
Fundamentally, the US Initial Jobless Claims figure for the week ending Jan 12, 2019 was released recently. The market was looking for an increase from the last reading of 216K to 220K.
However, the actual result was better than the forecast as there was a decline in the US Initial Jobless Claims from 216K to 213K. The report added:
The advance number for seasonally adjusted insured unemployment during the week ending January 5 was 1,737,000, an increase of 18,000 from the previous week’s revised level.
Overall, the US Dollar remains supported on dips versus the Japanese Yen unless there is a close below the 107.80 support.
Economic Releases to Watch Today
- UK Retail Sales for Dec 2018 (YoY) – Forecast +3.6%, versus +3.6% previous.
- UK Retail Sales for Dec 2018 (MoM) – Forecast -0.8%, versus +1.4% previous.
- US Industrial Production Dec 2018 (MoM) – Forecast +0.2%, versus +0.6% previous.
- US Capacity Utilization Dec 2018 – Forecast 78.5%, versus 78.5% previous.
- Canadian Consumer Price Index Dec 2018 (MoM) – Forecast -0.4%, versus -0.4% previous.
- Canadian Consumer Price Index Dec 2018 (YoY) – Forecast +1.7%, versus +1.7% previous.
Daily Markets Broadcast
Wall Street firmer on hopes for trade stance shift
Press reports suggested US Treasury Secretary Mnuchin supported lifting some or all of the China sanctions helped US indices higher yesterday. The report was subsequently denied by the Treasury, but the wheels had been set in motion for an uptick in risk appetite. A strong Philadelphia Fed survey also helped.
US30USD Daily Chart
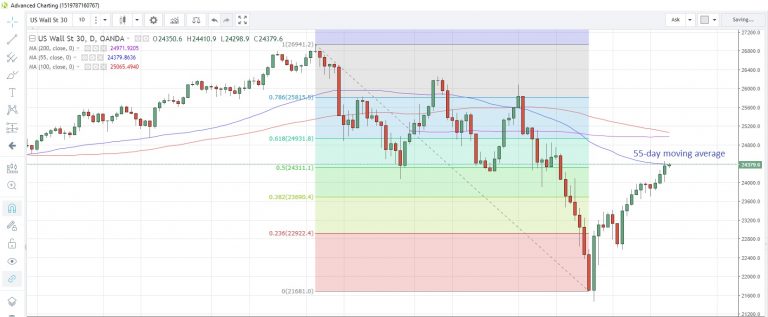
The US30 index climbed to the highest level in more than a month yesterday on hopes for an easing in trade tensions
The index tested the 55-day moving average at 24,392 for the first time since December 4, but failed to close above it. It’s at 24,380 today
US industrial production for December is due today and is seen slipping to +0.2% m/m from +0.6%. Capacity utilization is expected to hold steady at 78.5%.
DE30EUR Daily Chart
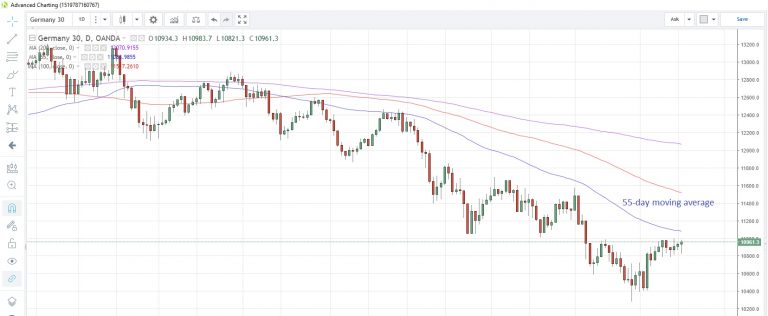
The Germany30 index eked out small gains for the third straight day yesterday, with most of the advance coming in the latter part of the trading session, helped by the better sentiment on Wall Street.
The 55-day moving average at 11,084 is still in focus. It has capped prices since September 28
Euro-zone consumer price data confirmed that the index dipped below the ECB’s target level in December, the first time in seven months.
NAS100USD Daily Chart
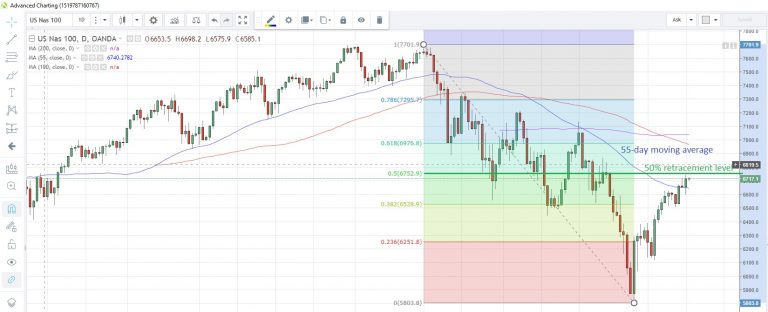
The NAS100 index advance to the highest since December 14 following the conflicting trade tariff press reports
The index is looking to test the 50% retracement level of the October-December drop at 6,752.9
Fed’s Quarles focused on the strong aspects of the US economy in a speech yesterday, citing December’s “very big number” jobs report.
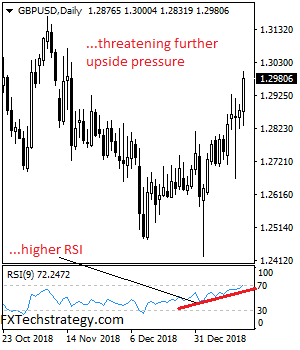
GBPUSD Targets Further Upside Pressure Towards 1.3000/29 Zone
GBPUSD targets further upside pressure towards 1.3000/29 zone. Support is seen at 1.2950 level. Further down, support comes in at the 1.2900 level where a break will turn focus to the 1.2850 level. Further down, support lies at the 1.2800 level. Below here will set the stage for more weakness towards the 1.2750 level. On the upside, resistance stands at the 1.3000 with a turn above here allowing for additional strength to build up towards the 1.3050 level. Further out, resistance stands at the 1.3100 level followed by the 1.3150 level. On the whole, GBPUSD faces further upside pressure.
Eco Data 1/18/19
[php_everywhere instance="1"]