Sample Category Title
EURUSD Intraday Analysis
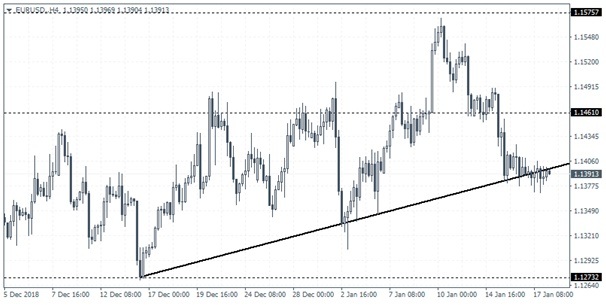
EURUSD (1.1391): The EURUSD currency consolidated near the minor rising trend line after breaking to the downside. The consolidation could potentially see the bearish trend resuming. The Euro currency could post further declines as it approaches the 1.1273 level of support to the downside. In case the Euro currency posts a reversal, we could expect the price to retest the breached price level of 1.1461 to establish resistance. Either way, the common currency looks to be trading flat once again.
Eurozone Inflation Fell More Than Expected In December
The Eurozone's inflation report showed that consumer prices slipped more than expected. Headline CPI fell to 1.6% which was more than the flash estimates that pointed to a decline of 1.7%. Core inflation, however, remained steady at 1.0%. The data comes ahead of the ECB meeting next week.
In the U.S. the Philly Fed manufacturing index increased to 17.0 on the index in January. This beat estimates of a modest increase to 9.7 and activity surged from 9.4 in December.
Japan released the revised industrial production numbers. Data showed that industrial production declined 1.0% on the month.
The European session is quiet with the UK's retail sales report on the cards. Forecasts point to a weak retail sales report showing a 0.8% decline on the month in December. The British pound maintained its gains amid news that some MP's wanted to block a no-Brexit deal.
The NY trading session will see Canada's inflation data coming out. The inflation data comes as the BoC decided to hold interest rates steady at its meeting a week before. Headline inflation is forecast to fall 0.4% on the month.
Data from the U.S. will cover the industrial production figures which are expected to rise 0.3% on the month. This marks a slower pace of increase after industrial production grew 0.6% previously
USDJPY Could Test 110.00 Level
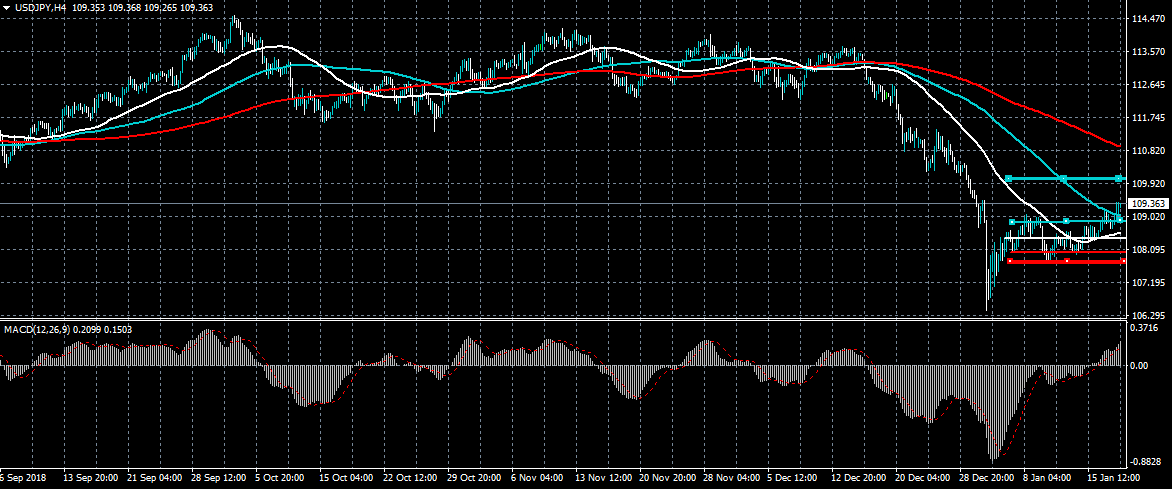
The US dollar has broken higher against the Japanese yen, amidst fresh hopes that the United States and China may strike a trade deal. The recent bullish move above the USDJPY pairs 100-period moving average on the four-hour time frame is also encouraging technical buying. Overall, a move towards the 110.00 level should be expected while price trades above the key 109.19 to 109.08 support region.
The USDJPY pair is strongly bullish while trading above the 109.08 level, key technical resistance is found at the 109.60 and 110.00 levels.
If the USDJPY pair trades below the 109.08 level, sellers may test towards the 108.80 and 108.40 levels.
GBPUSD Sterling Hits 1.3000
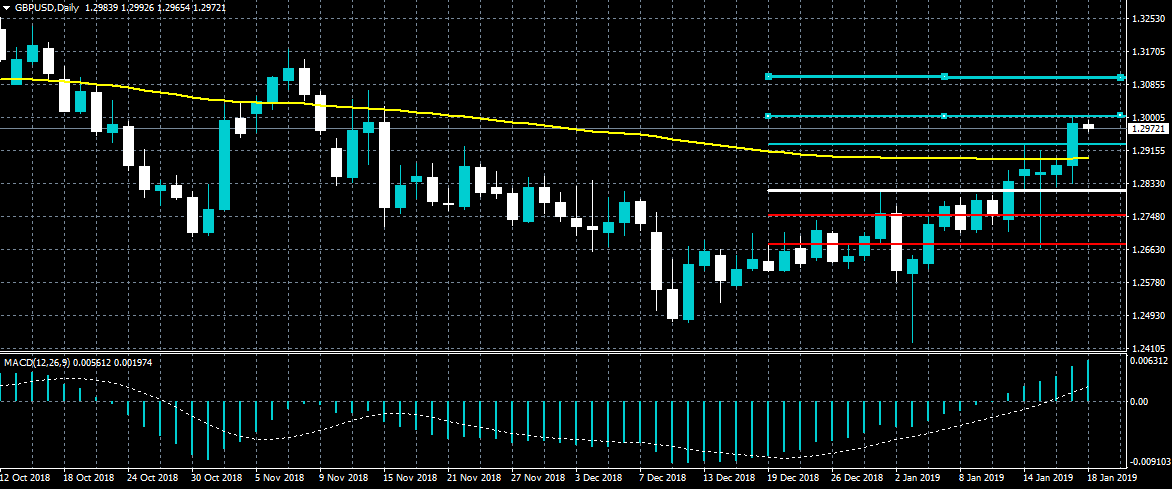
The British pound has surged towards the 1.3000 level against the US dollar, as traders continue to speculate that the United Kingdom’s departure from the European Union may be delayed. The bullish break above the 1.2930 level further encouraged sterling buyers, with the psychological 1.3000 level now key intraday resistance. The 1.3095 level is the next key upside level to watch if the 1.3000 technical barrier is broken by GBPUSD bulls.
The GBPUSD pair is strongly bullish while trading above the 1.2930 level, key technical resistance is now found at the 1.3000 and 1.3095 levels.
If the GBPUSD pair fails around current levels, key technical support is found at the 1.2930 and 1.2890 levels.
ETHUSD Still Bearish Below $126.00 Level
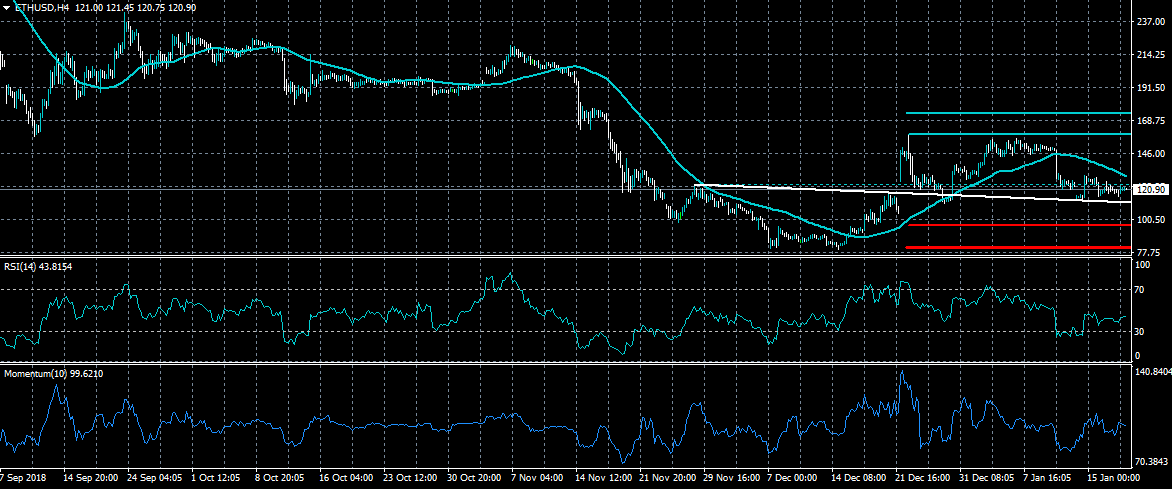
Ethereum remains under pressure on Friday, as the third largest cryptocurrency by market capitalization struggles to attract short-term buying interest. The Relative Strength and Momentum indicators on the four-hour time frame are currently neutral, suggesting further price consolidation ahead. Overall, a clear break from the $110.00 to $126.00 levels is needed to move away from the current narrow trading ranges.
The ETHUSD pair is only bullish while trading above the $126.00 level, key resistance remains at the $158.00 and $170.00 levels.
If ETHUSD pair trades back under the $110.00 level, sellers may test towards the $98.00 and $80.00 support levels.
USDCAD Finds Significant Resistance Near 23.6% Fibonacci Region
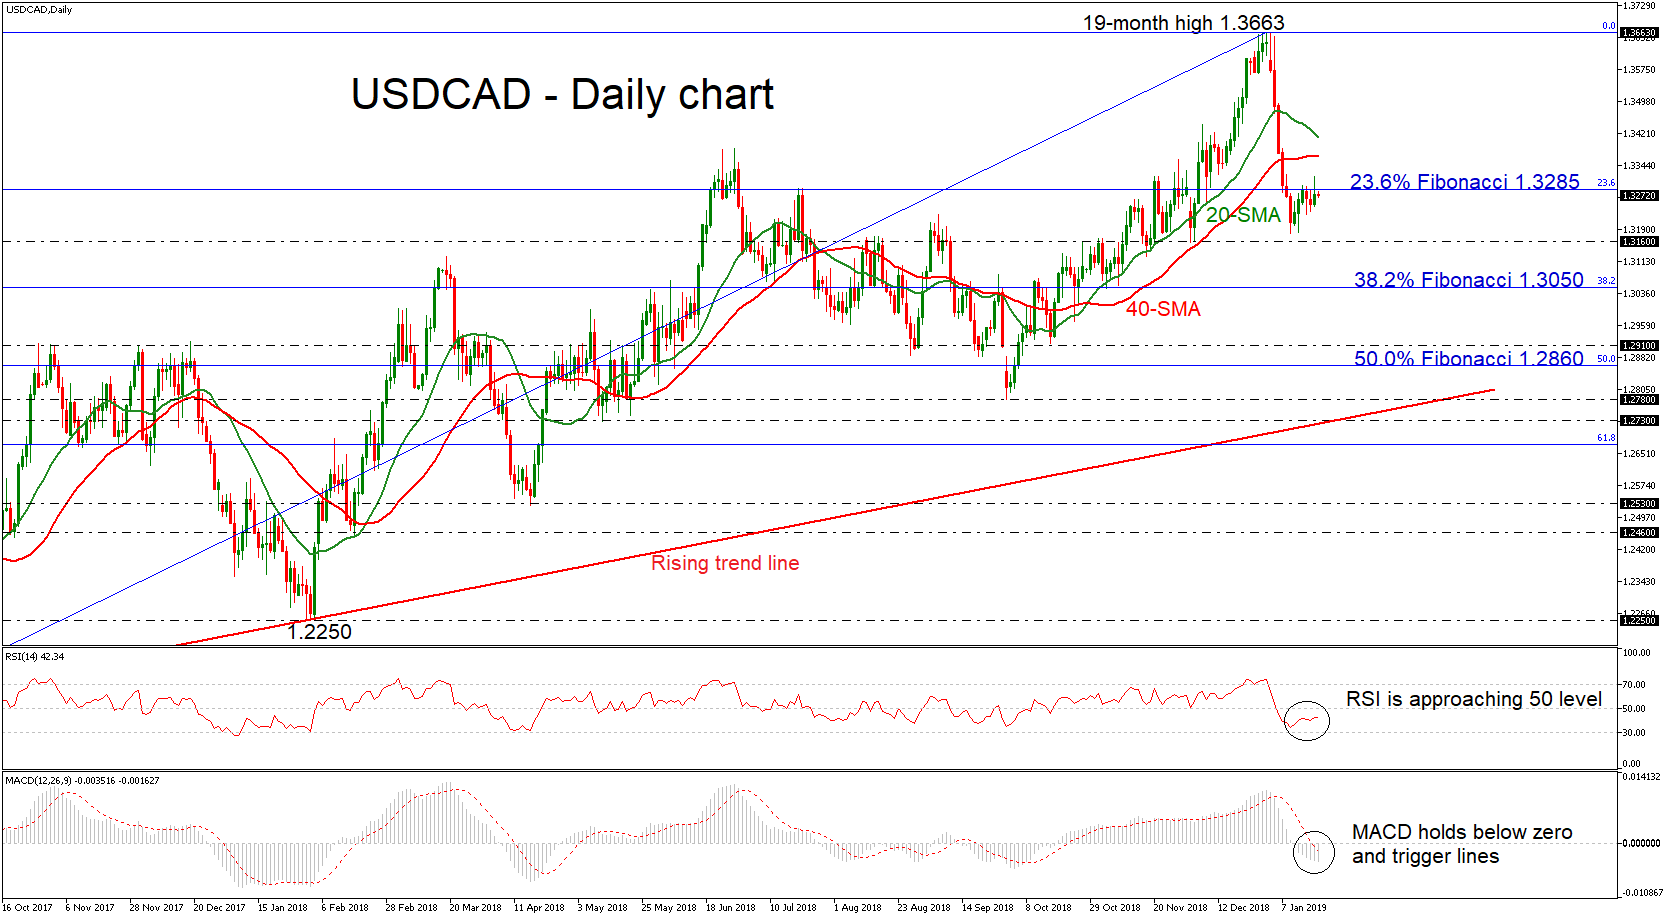
USDCAD has been struggling below the 23.6% Fibonacci retracement level of the upleg from 1.2060 to 1.3663, around 1.3285 over the last seven days, following the bearish rally from the 19-month high of 1.3663. The price also remains below the simple moving averages (SMAs) which are turning lower, signaling a bearish crossover in the near future.
Looking at the technical indicators, in the daily timeframe, they seem to be in agreement with the latest movement in the very short-term. The RSI is marginally rising below the neutral threshold of 50, while the MACD oscillator is moving beneath the zero and trigger lines, weakening its momentum.
In case of further downside pressures the pair could run towards the next immediate support level of 1.3160, increasing chances for a deeper negative correction. Even lower, if the price fails to hold above the aforementioned level, it could re-touch the 38.2% Fibonacci of 1.3050, which overlaps with the support level taken from the lows on November 7.
In the alternative scenario, if the price jumps back above the 23.6% Fibonacci it could find a stop around the 40-day simple moving average near 1.3370. A successful move above this level could move the market towards the 20-day SMA of 1.3410, while more advances could hit the 19-month peak of 1.3663.
To sum up, in the bigger picture USDCAD has been developing in an ascending tendency since September 2017, while in the short-term, bears have taken control for some correction.
Elliott Wave View In GBP/JPY Favors Upside Bias
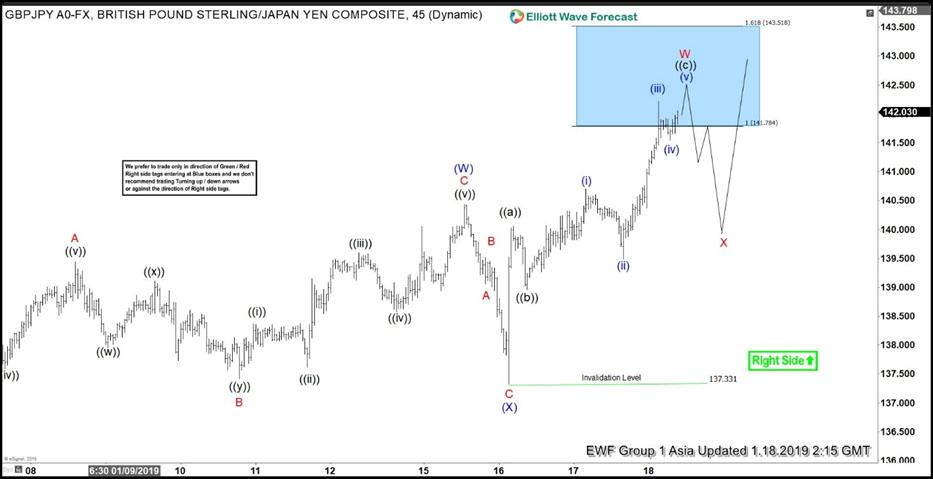
Short term Elliott Wave view on GBPJPY suggests the rally to 140.43 ended wave (W). From there, pair did a pullback to 137.33 which ended wave (X). Since then, pair has made a new high above wave (W) at 140.43, suggesting that the next leg higher in wave (Y) has started. Internal of wave (W) unfolded as a zigzag Elliott Wave structure where wave A ended at 139.44, wave B ended at 137.42, and wave C of (W) ended at 140.43.
Rally from wave (X) low at 137.33 can take various structures. One possible structure we present is a zigzag Elliott Wave structure. In this scenario, wave ((a)) ended at 140.06, wave ((b)) ended at 138.96, and wave ((c)) of W should complete soon. Pair has reached 141.78 – 143.5 area where wave W can end any moment. Once wave W is complete, it should pullback in wave X to correct cycle from 1/16/2019 low.
Wave X pullback should unfold in 3, 7, or 11 swing. As far as pivot at 137.33 low stays intact in the pullback, expect pair to extend higher again. Near-term target to the upside is 142.7 – 144, and the full 100% target is 146.08 – 148.16.
GBPJPY 1 Hour Elliott Wave Chart
The End Of The Trade War May Be Near
Market movers
Watch out for any headlines on US-China trade talks after The Wall Street Journal' s story that the US administration is considering reduce tariffs on Chinese imports.
UK retail sales for December are set to provide an insight into whether consumer spending in the UK stayed robust at the end of 2018 despite the Brexit turmoil.
Despite the sharp fall in ISM manufacturing, US industrial production probably registered another increase in December, according to consensus. In light of the ongoing US government shutdown, it will also be interesting to see whether consumer confidence from the University of Michigan for January shows the first signs of any negative repercussions. The weekly consumer confidence index from Bloomberg has moved lower recently.
New York Fed President John Williams is also scheduled to speak in the afternoon and we will again look out in particular for any hints on the future strategy around the balance sheet.
There are no Scandi market movers today but in Sweden Social Democratic leader Stefan Löfven will probably be approved as Prime Minister today - four months after the election took place.
Selected market news
Market sentiment was initially lifted by headlines that the US administration is considering rolling back some of the tariffs on Chinese imports but the rally was short-lived as the US Treasury denied the story soon after. In addition, the story was probably not as interesting as the headlines suggested, as the story states that the proposal comes from Treasury Secretary Steven Mnuchin (a China dove), while the US Trade Representative Robert Lighthizer (China hawk) opposes the idea. Nonetheless, we still interpret the story as another sign that a US-China trade deal is moving closer and markets probably do as well. S&P 500 ended 0.8% higher and Asian markets are also up this morning. Oil and yields are too.
In the UK, it was announced yesterday that the voting on Prime Minister Theresa May's motion on her Brexit plan B and amendments to the motion will take place on 29 January (the motion will still be presented on Monday) . A poll from YouGov has shown that support for the UK remaining in the EU is increasing. According to the poll, 56% now want to remain in the EU (versus 44% leave), which is the highest gap since the EU referendum. Polls like these increase the pressure on pro-EU politicians to call for a second EU referendum.
In Sweden , HOX-index (Valueguard home prices) came in at -0.8% in December with single family home prices leading the decrease. Sweden's residential market remains shaky and right now it is a buyer's market.
China Q4 GDP Data Seen Next Week
General Trend:
- Hong Kong listed property developer Jiayuan International rises over 90% (said to have made note payment), declined over 75% prior session
- Rio Tinto rises over 0.5% following quarterly production update
- Nidec declines after recent profit warning
- On Thursday, it was reported that Treasury Sec Mnuchin was said to support lifting China trade tariffs to break stalemate, but Trade Rep Lighthizer is pushing back against easing tariffs (press)
- The US Treasury Dept later issued the following response: neither Mnuchin or Lighthizer has made any recommendations to anyone with respect to tariffs or other parts of the talks with
China
- Japan Dec CPI eases, there is speculation the BoJ may trim inflation forecast at next week’s meeting (Jan 22-23rd)
- China's Q4 GDP figures are expected to be released on Jan 21st (Monday)
Headlines/Economic Data
Australia/New Zealand
- ASX 200 opened +0.4%
- Rio Tinto[ RIO.AU] Reports Q4 Pilbara Iron Ore production 86.6 Mt, -1% y/y; Shipments 87.4 Mt v Mte v 90.0Mt y/y; Guides initial FY19 Pilbara shipments 338-350Mt v 348Mte
- (NZ) New Zealand Dec Business Manufacturing PMI: 55.1 v 53.7 prior
China/Hong Kong
- Shanghai Composite opened +0.3%, Hang Seng +0.9%
- (CN) US and China said to be in discussions to reopen China's markets to chicken exports from the US – press
- (CN) According to Nikkei estimates, China 2019 tax reduction program is projected to exceed CNY1.5T, program expected to be announced in March
- (CN) For the week, PBoC injected net CNY1.16T in its open market operation v CNY410B net drain w/w
- (CN) China PBoC sets Yuan Reference Rate: 6.7665 v 6.7592 prior
- (CN) China to target 2019 GDP growth of 6.0-6.5% (in line with prior report from Jan 11th) - China Daily
- (CN) China revises 2017 GDP growth lower to 6.8% v 6.9% prior - Stats Agency
Japan
- Nikkei 225 opened +0.4%
- (JP) JAPAN DEC NATIONAL CPI Y/Y: 0.3% V 0.3%E (7-month low); CPI EX-FRESH FOOD (CORE) Y/Y: 0.7% V 0.8%E
- (JP) Japan Government Official: No change to government's view inflation accelerating 'moderately' as a trend
- (JP) Japan Finance Min Aso: Reiterates making changes to budget due to wages issue, [as a result] FY19 will have ¥700M in additional JGB issuance
- (JP) Japan Nov Final Industrial Production M/M: -1.0% v -1.1% prelim; Y/Y: 1.5% v 1.4% prelim
- (JP) Japan Cabinet Office Official: BoJ Gov Kuroda expects US/China trade friction to be 'resolved' this year
Korea
- Kospi +0.4%
- (KR) North Korea official Kim Yong Chol has arrived at airport in Washington D.C. - South Korean Press
- (US) Trump administration missile defense review: North Korea poses an extraordinary threat despite peace efforts; US won't accept limitations on missile defense development against 'rogue states'
Other
- (MY) Malaysia Finance Ministry: To issue up to ¥200B in 10-year Samurai bonds, coupon seen below 0.65%
North America
- (US) White House: President Trump and Treasury Sec Mnuchin to hold oval office meeting on Friday
- (US) US House Ways and Means Committee Chairman Neal: Treasury Sec Mnuchin has declined request to testify next week over partial government shutdown; Treasury Dept has instead offered to send sr officials to testify, said a US financial press report
- (US) Senate Majority Leader McConnell (R): Democrats want 'power grab' not negotiation
- (US) White House: President Trump cancels delegation trip to Davos, cites US government shutdown
- (US) Fed's Quarles (hawk, voter): the real US economic data is 'very strong'; Dec job data was a 'very big number' - remarks in NYC
- (US) Fed's Evans (dove, voter): Believe we are about 75 basis points below what would be a slightly restrictive fed funds rate
Europe
- (UK) Northern Ireland's DUP Party reportedly edging towards a customs union - UK's Times
- (CN) China and Germany Joint Statement: Support role of the G-20, committed to expand bilateral opening up
Levels as of 01:00ET
- Nikkei 225, +1.3%, ASX 200 +0.5%, Hang Seng +1.1%; Shanghai Composite +1%; Kospi +0.6%
- Equity Futures: S&P500 +0.2%; Nasdaq100 +0.2%, Dax flat; FTSE100 +0.1%
- EUR 1.1408-1.1385 ; JPY 109.39-109.05 ; AUD 0.7206-0.7177 ;NZD 0.6775-0.6748
- Feb Gold -0.1% at $1,291/oz; Feb Crude Oil +1% at $52.59/brl; Feb Copper flat at $2.697/lb
Euro-Zone’s Final Consumer Price Inflation Slowed To Its Lowest Level In 8-Months In December
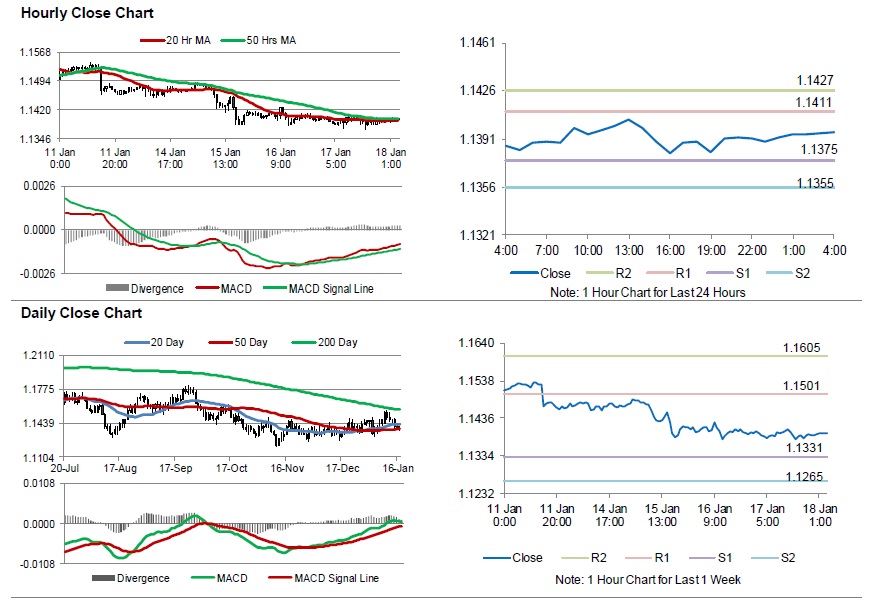
For the 24 hours to 23:00 GMT, the EUR slightly declined against the USD and closed at 1.1389.
On macro front, the Euro-zone's final consumer price inflation slowed to its lowest level in 8-months to 1.6% on an annual basis in December, in line with market expectations as well as confirming the preliminary print. In the previous month, the CPI had climbed 1.9%. Moreover, the region's seasonally adjusted construction output eased 0.1% on a monthly basis in November, following a drop of 1.6% in the prior month.
In the US, data indicated that the US Philadelphia Fed manufacturing index climbed to a level of 17.0 in January, compared to a revised reading of 9.1 in the previous month. Market participants had anticipated the index to rise to a level of 9.5. Moreover, the nation's seasonally adjusted initial jobless claims unexpectedly declined to a level of 213.0K in the week ended 12 January 2019, defying market expectations for a gain to a level of 220.0K. In the preceding week, the initial jobless claims had recorded a level of 216.0K.
In the Asian session, at GMT0400, the pair is trading at 1.1396, with the EUR trading 0.06% higher against the USD from yesterday's close.
The pair is expected to find support at 1.1375, and a fall through could take it to the next support level of 1.1355. The pair is expected to find its first resistance at 1.1411, and a rise through could take it to the next resistance level of 1.1427.
Amid lack of macroeconomic releases in the Euro-zone today, traders would focus on the US industrial production and manufacturing production, both for December along with the Michigan consumer sentiment index for January, slated to release later in the day.
The currency pair is showing convergence with its 20 Hr and 50 Hr moving averages.