

Sample Category Title
Japan’s Trade Deficit Widened Less-Than-Estimated In November
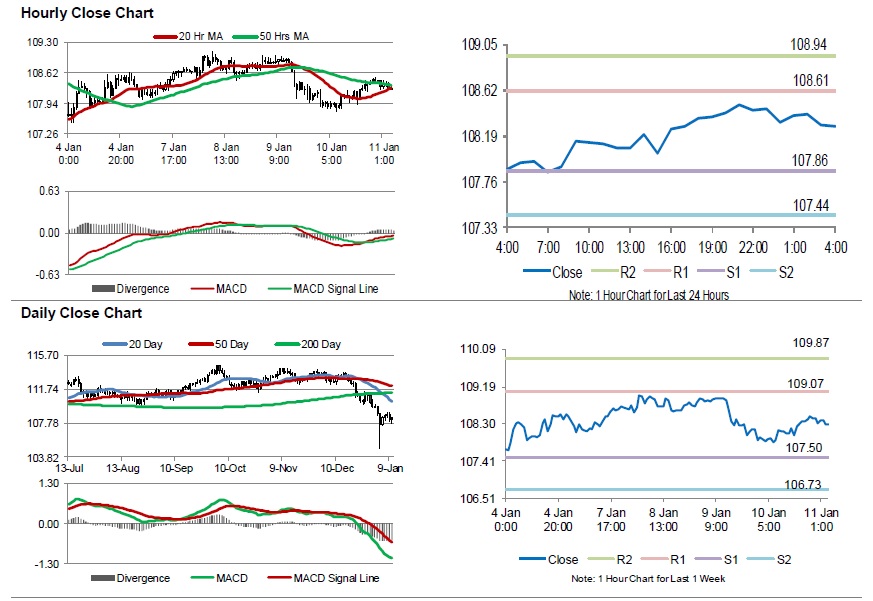
For the 24 hours to 23:00 GMT, the USD rose 0.46% against the JPY and closed at 108.44.
In the Asian session, at GMT0400, the pair is trading at 108.28, with the USD trading 0.15% lower against the JPY from yesterday's close.
Overnight data indicated that Japan's trade deficit (BOP basis) widened to ¥559.1 billion in November, compared to a deficit of ¥321.7 billion in the prior month. Market participants had envisaged the nation's trade deficit to expand to ¥612.6 billion. Meanwhile, the nation's household spending eased for the third consecutive month by 0.6% on a yearly basis in November, compared to a drop of 0.3% in the preceding month. The pair is expected to find support at 107.86, and a fall through could take it to the next support level of 107.44. The pair is expected to find its first resistance at 108.61, and a rise through could take it to the next resistance level of 108.94.
The currency pair is showing convergence with its 20 Hr and 50 Hr moving averages.
Swiss Franc Trading Higher In The Asian Session
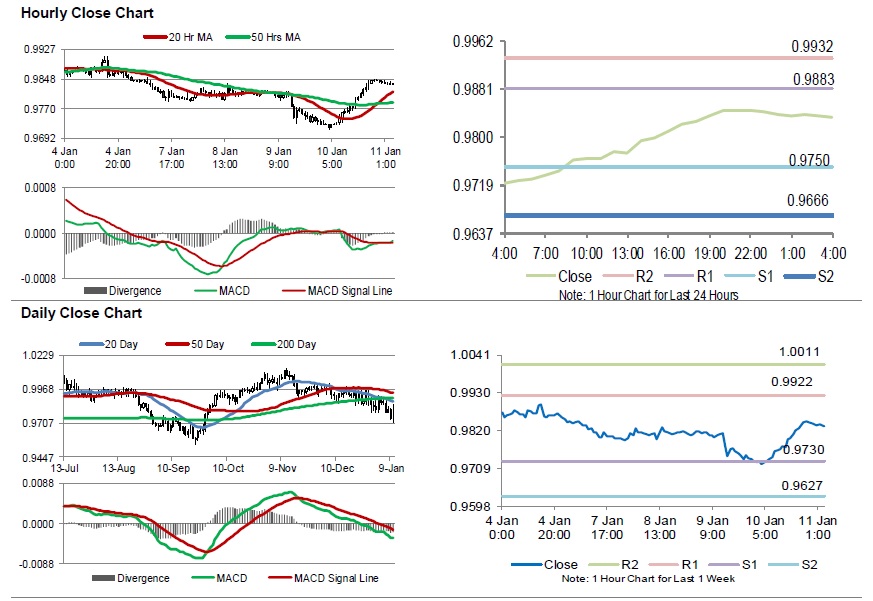
For the 24 hours to 23:00 GMT, the USD rose 1.15% against the CHF and closed at 0.9842.
In the Asian session, at GMT0400, the pair is trading at 0.9833, with the USD trading 0.09% lower against the CHF from yesterday’s close.
The pair is expected to find support at 0.9750, and a fall through could take it to the next support level of 0.9666. The pair is expected to find its first resistance at 0.9883, and a rise through could take it to the next resistance level of 0.9932.
Moving ahead, traders would await Switzerland’s producer & import prices, due to release next week.
The currency pair is trading above its 20 Hr and 50 Hr moving averages.
The BoC Kept Its Key Interest Rate Steady At 1.75%, As Widely Expected
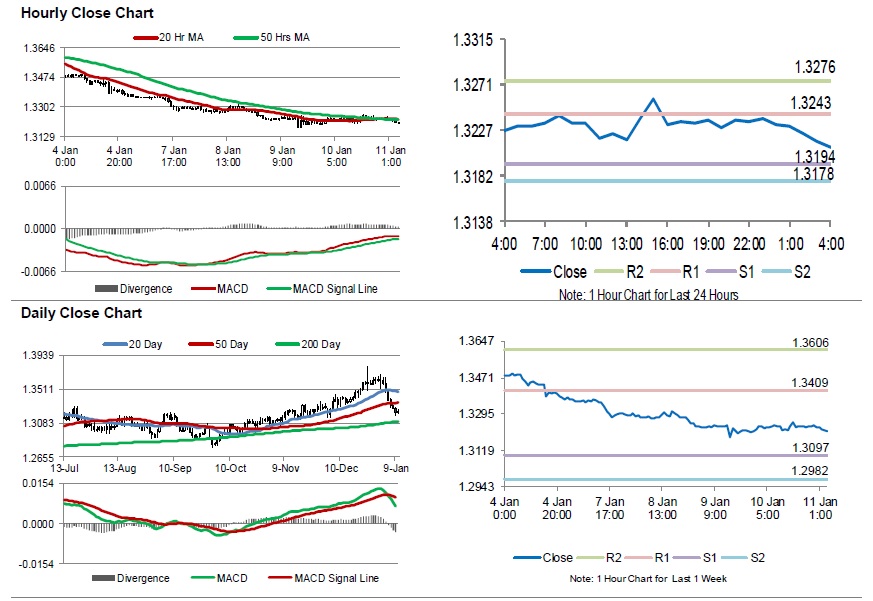
For the 24 hours to 23:00 GMT, the USD declined 0.20% against the CAD and closed at 1.3208.
Data revealed that Canada’s seasonally adjusted housing starts fell to a level of 213.4K in December, compared to market anticipations for a drop to a level of 205.5K. In the prior month, housing starts had recorded a revised level of 224.3K.
The Bank of Canada, in its monetary policy meeting, opted to leave its key interest rate unchanged at 1.75%, as widely expected. However, the central bank lowered its 2019 growth outlook to 1.7% from 2.1%, signalling a slower expansion in the economy.
In the Asian session, at GMT0400, the pair is trading at 1.3227, with the USD trading 0.14% higher against the CAD from yesterday’s close.
The pair is expected to find support at 1.3189, and a fall through could take it to the next support level of 1.3150. The pair is expected to find its first resistance at 1.3257, and a rise through could take it to the next resistance level of 1.3286.
Trading trend in the Loonie today is expected to be determined by Canada’s new housing price index and building permits, both for November, set to release later in the day.
The currency pair is showing convergence with its 20 Hr moving average and trading below its 50 Hr moving average.
Australia’s Retail Sales Advanced To A 5-Month High Level In November
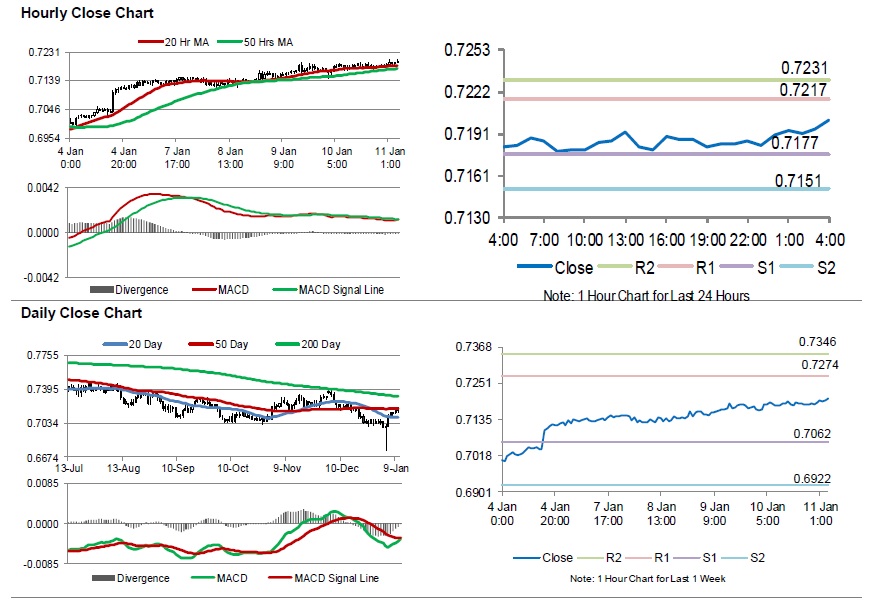
For the 24 hours to 23:00 GMT, the AUD rose 0.24% against the USD and closed at 0.7183.
LME Copper prices declined 0.9% or $55.5/MT to $5908.5/MT. Aluminium prices rose 0.1% or $2.0/MT to $1844.0/MT.
In the Asian session, at GMT0400, the pair is trading at 0.7202, with the AUD trading 0.26% higher against the USD from yesterday's close.
Overnight data showed that Australia's seasonally adjusted retail sales climbed to a 5-month high level of 0.4% on a monthly basis in November, beating market expectations for a rise of 0.3%. In the prior month, retail sales had recorded a gain of 0.3%. On the other hand, the nation's AIG performance of construction index declined to a level of 42.6 in December, following a reading of 44.5 in the previous month.
The pair is expected to find support at 0.7177, and a fall through could take it to the next support level of 0.7151. The pair is expected to find its first resistance at 0.7217, and a rise through could take it to the next resistance level of 0.7231.
Amid lack of economic releases in Australia today, traders would focus on global macroeconomic events for further direction.
The currency pair is trading above its 20 Hr and 50 Hr moving averages.
Gold: Yellow Metal Reverses Is Losses In The Morning Session
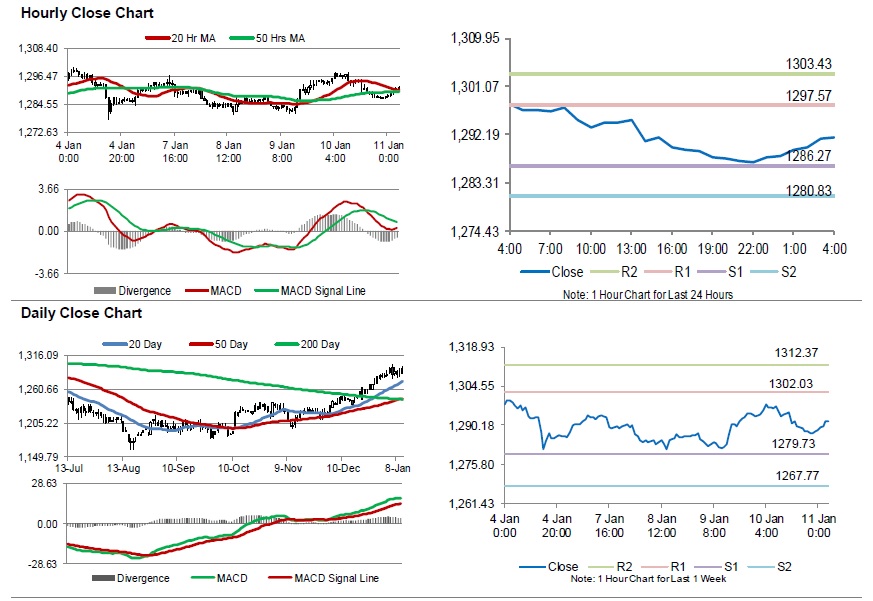
For the 24 hours to 23:00 GMT, Gold declined 0.66% against the USD and closed at USD1287.10 per ounce, amid strength in the US dollar.
In the Asian session, at GMT0400, the pair is trading at 1291.70, with gold trading 0.36% higher against the USD from yesterday’s close.
The pair is expected to find support at 1286.27, and a fall through could take it to the next support level of 1280.83. The pair is expected to find its first resistance at 1297.57, and a rise through could take it to the next resistance level of 1303.43.
The yellow metal is showing convergence with its 20 Hr and 50 Hr moving averages.
Silver: White Metal Trading On A Stronger Footing This Morning
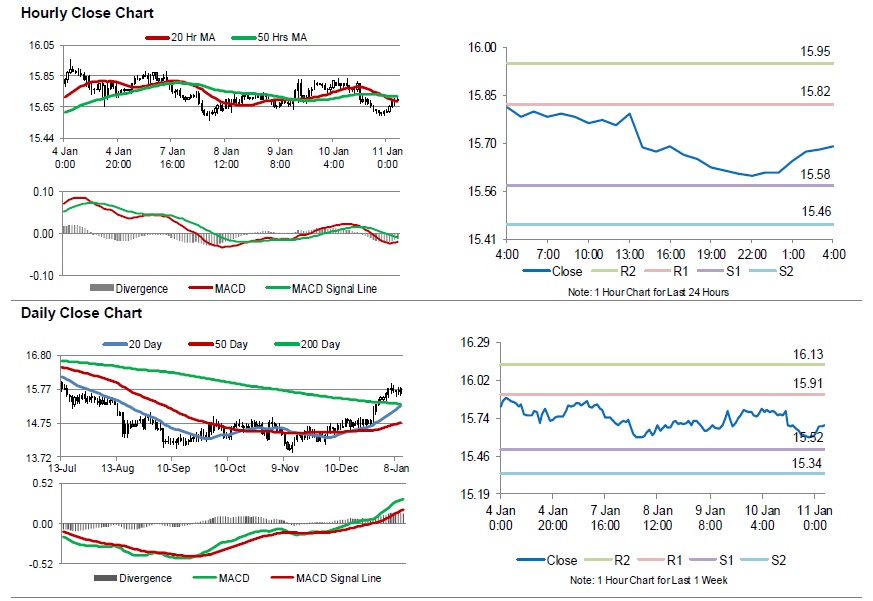
For the 24 hours to 23:00 GMT, Silver declined 1.01% against the USD and closed at USD15.62 per ounce, tracking losses in gold prices.
In the Asian session, at GMT0400, the pair is trading at 15.70, with silver trading 0.51% higher against the USD from yesterday’s close.
The pair is expected to find support at 15.58, and a fall through could take it to the next support level of 15.46. The pair is expected to find its first resistance at 15.82, and a rise through could take it to the next resistance level of 15.95.
The white metal is showing convergence with its 20 Hr moving average and trading below its 50 Hr moving average.
Crude Oil: Oil Trading Higher, Ahead Of Baker Hughes Weekly Rig Count Data
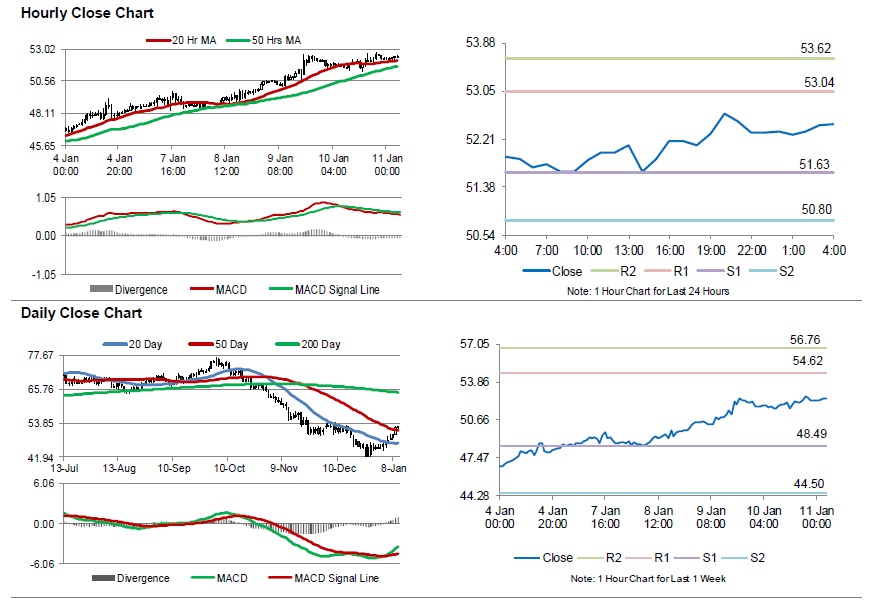
For the 24 hours to 23:00 GMT, Crude Oil rose 0.98% against the USD and closed at USD52.33 per barrel.
In the Asian session, at GMT0400, the pair is trading at 52.47, with oil trading 0.27% higher against the USD from yesterday’s close.
The pair is expected to find support at 51.63, and a fall through could take it to the next support level of 50.80. The pair is expected to find its first resistance at 53.04, and a rise through could take it to the next resistance level of 53.62.
Crude oil is trading above its 20 Hr and 50 Hr moving averages.
Gold And Crude Oil Price Primed For Gains
Gold price corrected lower recently and found support near the $1,286 level. Crude oil price is following a bullish path and it may continue to rise in the short term towards $55.00.
Important Takeaways for Gold and Oil
- Gold price found support near the $1,286 level and recently recovered above $1,290 against the US Dollar.
- There is a major bullish trend line in place with support at $1,282 on the hourly chart of gold.
- Crude oil price climbed higher recently and broke the $48.00 and $50.00 resistances.
- There are two bullish trend lines formed with support near $52.20 on the hourly chart of XTI/USD.
Gold Price Technical Analysis
Gold price traded higher recently and broke the $1,295 resistance zone against the US Dollar. The price traded close to the $1,300 level before sellers appeared near the $1,297 and $1,298 resistance levels.
A high was formed near $1,297 on FXOpen and later the price declined below $1,295. Sellers pushed the price below the 50% Fib retracement level of the last leg from the $1,280 low to $1,297 high. However, the decline found a strong support near the $1,286 level.
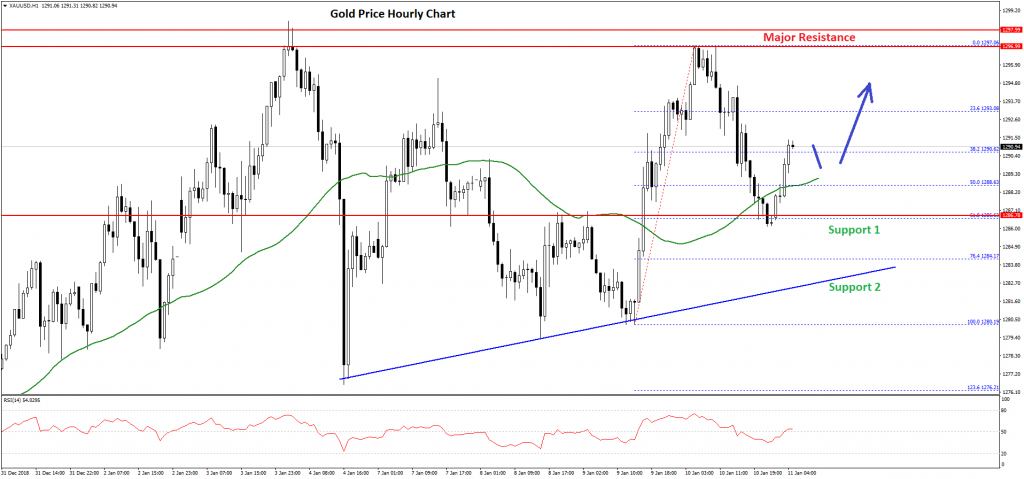
Besides, the 61.8% Fib retracement level of the last leg from the $1,280 low to $1,297 high also acted as a support. The price bounced back above $1,290 and the 50 hourly simple moving average.
The current price action is positive and it seems like there could be more gains above the $1,292 and $1,295 resistance levels. However, a proper break above the $1,298 resistance is needed for more gains in the near term.
On the downside, an initial support is at $1,290, followed $1,288. Moreover, there is a major bullish trend line in place with support at $1,282 on the hourly chart of gold. Overall, dips remain supported in gold and the price may soon trade towards $1,298.
Oil Price Technical Analysis
Crude oil price started a solid recovery from the $48.00 support zone against the US Dollar. The price traded above the $50.00 and $51.50 resistance levels to move into a bullish zone.
The recent upward move was positive since there was a close above the $52.00 level and the 50 hourly simple moving average. The price even broke the $52.60 resistance and traded as high as $52.99.
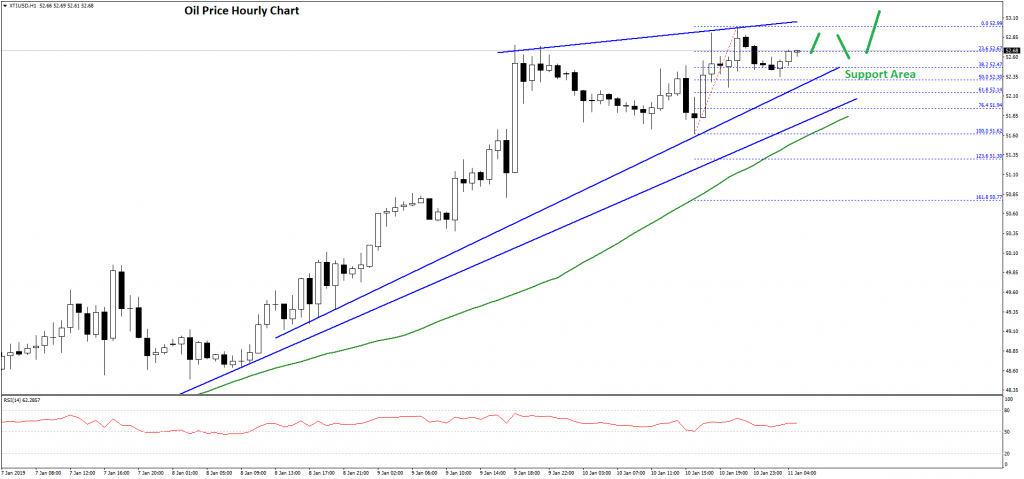
The price is currently correcting lower below $52.60 and the 23.6% Fib retracement level of the recent wave from the $51.62 low to $52.99 high. However, there are many supports on the downside near the $52.40 and $52.30 levels.
There are also two bullish trend lines formed with support near $52.20 on the hourly chart of XTI/USD. The trend lines are positioned near the 50% Fib retracement level of the recent wave from the $51.62 low to $52.99 high.
Therefore, dips in the short term remain well supported above the $52.20 level. If there is a downside break below $52.20 and $52.00, the price may decline towards the $50.00 support.
On the upside, a break above the $53.00 resistance could clear the path for more gains towards the $54.20 and $54.50 levels in the near term.
EUR/USD Daily Outlook
Daily Pivots: (S1) 1.1467; (P) 1.1519; (R1) 1.1552; More.....
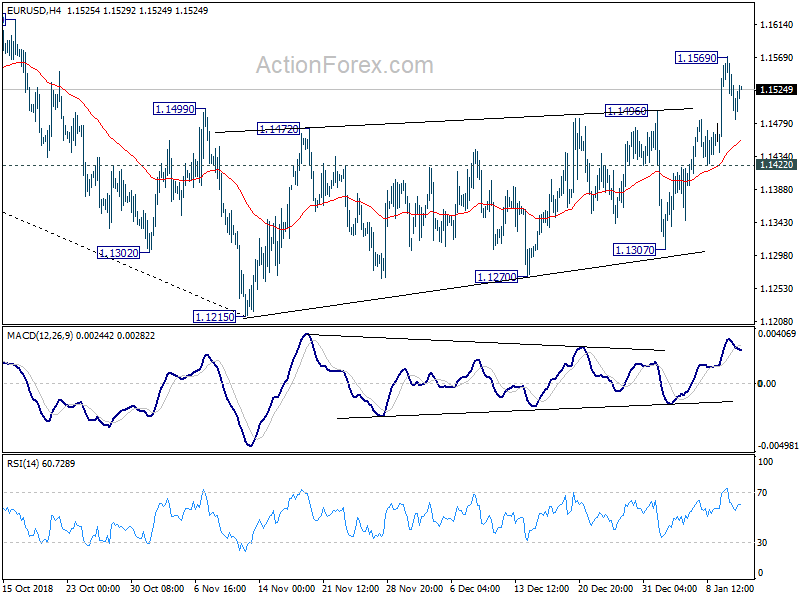
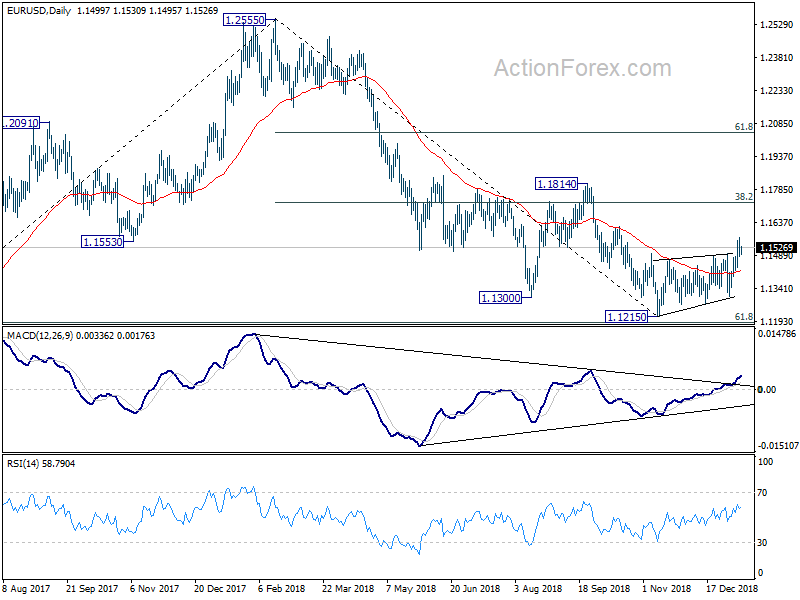
EUR/USD formed a temporary top at 1.1569 and retreated. Intraday bias is turned neutral first. Further rise is in favor with 1.1422 minor support intact. Price actions from 1.1215 low is correcting whole decline from 1.2555, if not reversing the down trend. On the upside, above 1.1569 will target 1.1621 resistance first. Break will target 38.2% retracement of 1.2555 to 1.1215 at 1.1727 next. On the downside, break of 1.1422 support will bring retest of 1.1214 low instead.
In the bigger picture, as long as 1.1814 resistance holds, down trend down trend from 1.2555 medium term top is still in progress and should target 61.8% retracement of 1.0339 (2017 low) to 1.2555 at 1.1186 next. Sustained break there will pave the way to retest 1.0339. However, break of 1.1814 will confirm completion of such down trend and turn medium term outlook bullish.
Market Morning Briefing: The Euro-Yen Is Trading Below 125.20 Just Now And While That Holds
STOCKS
While we are inclined to be bullish for most Equity markets in the long term, we are alive to the chances of a dip in the near term in most indices, which might provide a decent opportunity to go Long.
For the Western hemisphere, the Resistances to watch are near current level (24001.92, +122.80, +0.51%) on the Dow on the 3-day line chart, near 11050 on the DAX (10921.59, +28.27, +0.26%) on the trendline coming down from near 12500 since Sep-Oct. Unless broken strongly, these Resistances could push the markets down a bit in the near term.
We are more bullish on the Nikkei (20306, +142.36, +0.71%) which has a long-term trendline Support on the Weekly Line chart; and the Shanghai (2533.71, -0.05%) which has a long-term Support at 2425. Within this, there is some chance that both of these could see a small near-term dip before they are bought again more strongly.
The Sensex (36106, -0.29%) and Nifty (10821.60, -0.31%) have dipped a little, suggesting that the market has not as yet fully made up its mind on bullishness. The outlook for India is a little more mixed, compared to the Oriental and the Occidental regions.
COMMODITIES
Metals are almost stable while crude prices continue to rise. Resistances above current levels could hold which could push the commodity prices to lower levels soon.
Brent (61.40) and Nymex WTI (52.44) continue to trade higher. Brent could test resistance near $62.30 in the next couple of sessions if the rising momentum continues while WTI may face rejection from $54.
Gold (1291.10) is stuck above support at 1280 and could trade within 1300-1280 region for some more sessions. While 1280 holds, Gold could attempt to test 1320 on the upside but is likely to decline from there in the medium term. We may expect some sideways movement within 1280-1300/20 before a sharp fall is seen in the longer run.
Silver (15.68) is stable below 16. Near term looks ranged for now within 15.5-16.0 levels.
Copper (2.6450) has come off from 2.6705 and while 2.70/68 holds, copper could fall back to 2.60 or even lower in the coming sessions. Near term is bearish while below 2.70/68.
FOREX
Currencies are almost stable with important resistances above current levels. Aussie and Euro looks bullish while the others look weak against the US Dollar.
Euro (1.1523) could have scope of testing 1.16-1.17 in the near term which could be a decent resistance on the upside. Dollar Index (95.39) has some scope of coming off towards 94.50/20 in the near term while trading below 95.50. Only a sustained bounce above 95.50 would negate a fall towards 94.50/20.
The Euro-Yen (124.75) is trading below 125.20 just now and while that holds, we could see some stable movement in the 124-125.20 region. A break above 125.20 is needed to turn bullish and take the prices higher towards 128 in the longer run.
Dollar Yen (108.28) bounced back from levels near 107.91 seen yesterday. 107-108 is a decent support which if holds could take the pair towards 110 soon. Before that we could see some sideways consolidation in the 107-109 region. Long term weekly support is holding near 107.
Pound (1.2791) is stable after testing 1.28 on the upside. A sustained break on the upside is needed to make it more bullish towards 1.29-1.31. While below 1.28, we cannot negate a fall towards 1.270-1.265.
Aussie (0.7196) has been continuously and slowly rising every session and could soon target 0.73 on the upside. Aussie looks bullish for the near term.
USD-CNY (6.7625) has fallen quite a bit and is looking bearish for the near term targeting levels of 6.73/71.
Dollar Rupee (70.42) could trade within 70.20-70.60/80 in the near term. A rise towards 70.60/80 (possible extension to 71) looks more likely while supports at 70.20 and 70.40 holds.
INTEREST RATES
US Bond Yields (2Yr 2.56%, 5Yr 2.55%, 10Yr 2.73% and 30Yr 3.05%) have moved up a little yesterday, contrary to our expecation of a dip. Could it be that the Support at 2.45% on the 5Yr is stronger than might have been anticipated?
We note that the US Yield Curve is steepening for now, with the 10-5Yr Spread (0.18%) breaking above declining trendline coming down from 0.59% (Dec-16) and the 30-10 (0.32%) and 30-5 (0.50%) looking like they can move higher to 0.35% and 0.60% respectively. This suggests the fears of growth slowdown might subside a bit.
Keep an eye on the US-Japan 10Yr Spread (2.71%) which could be bouncing off a long-term Support trendline coming up from 1.62% in 2016. A further rise here could help pull Dollar-Yen higher.
We are not too clear about the 10Yr GOI (7.476%), which may/ may not move higher to test Resistance at 7.59%.