

Sample Category Title
EUR/JPY Daily Outlook
Daily Pivots: (S1) 124.36; (P) 124.71; (R1) 125.07; More....
Intraday bias in EUR/JPY is turned neutral with 4 hour MACD crossed below signal line. At this point, we're still looking for strong resistance around 124.61 to limit the rebound from 118.62. And, on the downside, break of 123.40 minor support will turn bias back to the downside for retesting 118.62 low first. However, sustained break of 124.61 will extend the rebound to 127.09 resistance next.
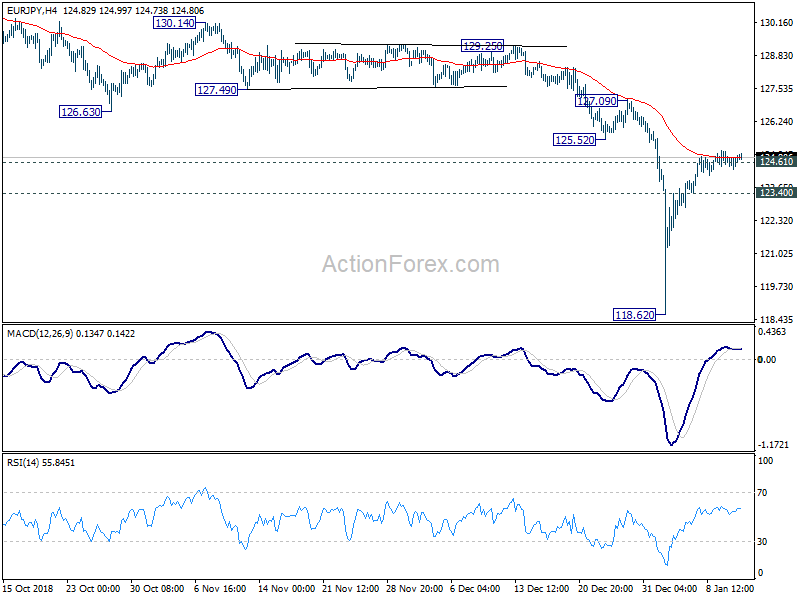
In the bigger picture, medium term rebound from 109.03 (2016 low) has completed at 137.49 already, with corrective structure. Fall from 137.39 is seen as a medium term fall, resuming the decline from 149.76 (2014 high). Such decline should break through 109.03 low next. This will remain the preferred case as long as 124.61 support turned resistance holds. Sustained break of 124.61 will mix up the outlook and we'll reassess on the final structure of the rebound from 118.62.
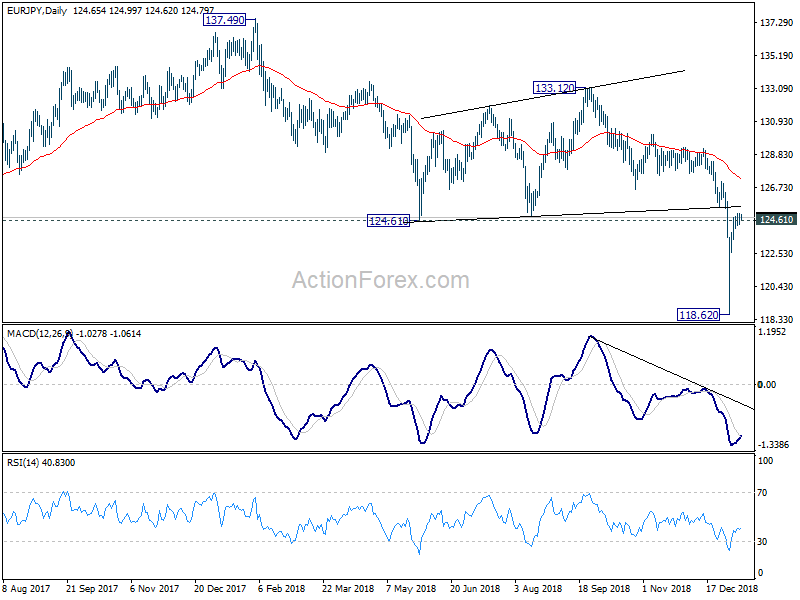
GBP/USD Key Resistance At 1.2780
Pivot (invalidation): 1.2780
Our preference Short positions below 1.2780 with targets at 1.2730 & 1.2705 in extension.
Alternative scenario Above 1.2780 look for further upside with 1.2805 & 1.2820 as targets.
Comment As Long as the resistance at 1.2780 is not surpassed, the risk of the break below 1.2730 remains high.
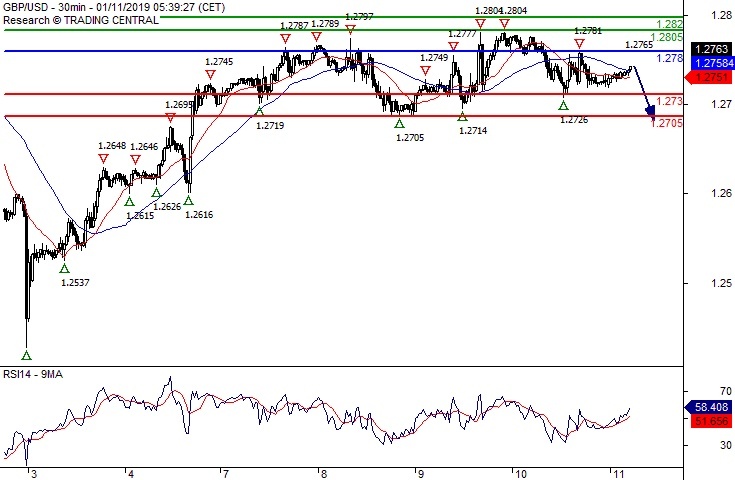
EUR/USD Key Resistance At 1.1540
Pivot (invalidation): 1.1540
Our preference Short positions below 1.1540 with targets at 1.1500 & 1.1480 in extension.
Alternative scenario Above 1.1540 look for further upside with 1.1570 & 1.1595 as targets.
Comment The upward potential is likely to be limited by the resistance at 1.1540.
Oil Pullback To Fib Resistance Within Wave 4
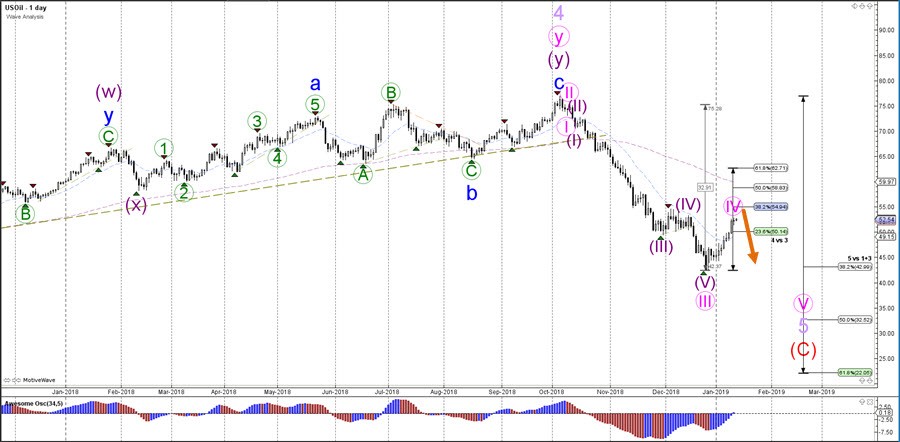
Oil is expected to make a bearish bounce at the 38.2% or 50% Fibonacci levels. A break above the 50% Fib makes the current wave 4 (pink) pattern less likely. A bearish breakout below the support trend lines (blue) could potentially confirm the downtrend continuation towards the Fib targets within waves5 (pink/purple).
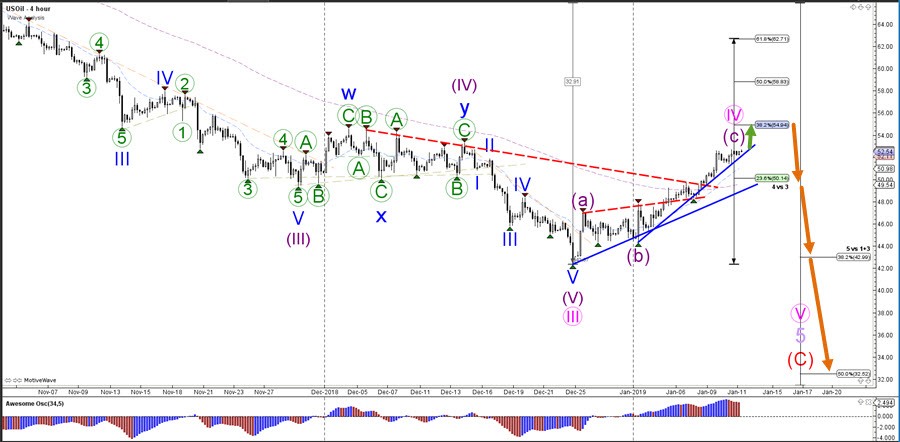
Oil’s bearish momentum has been very strong on the daily chart and a bearish continuation is likely as long as price stays below the 50% Fib resistance.
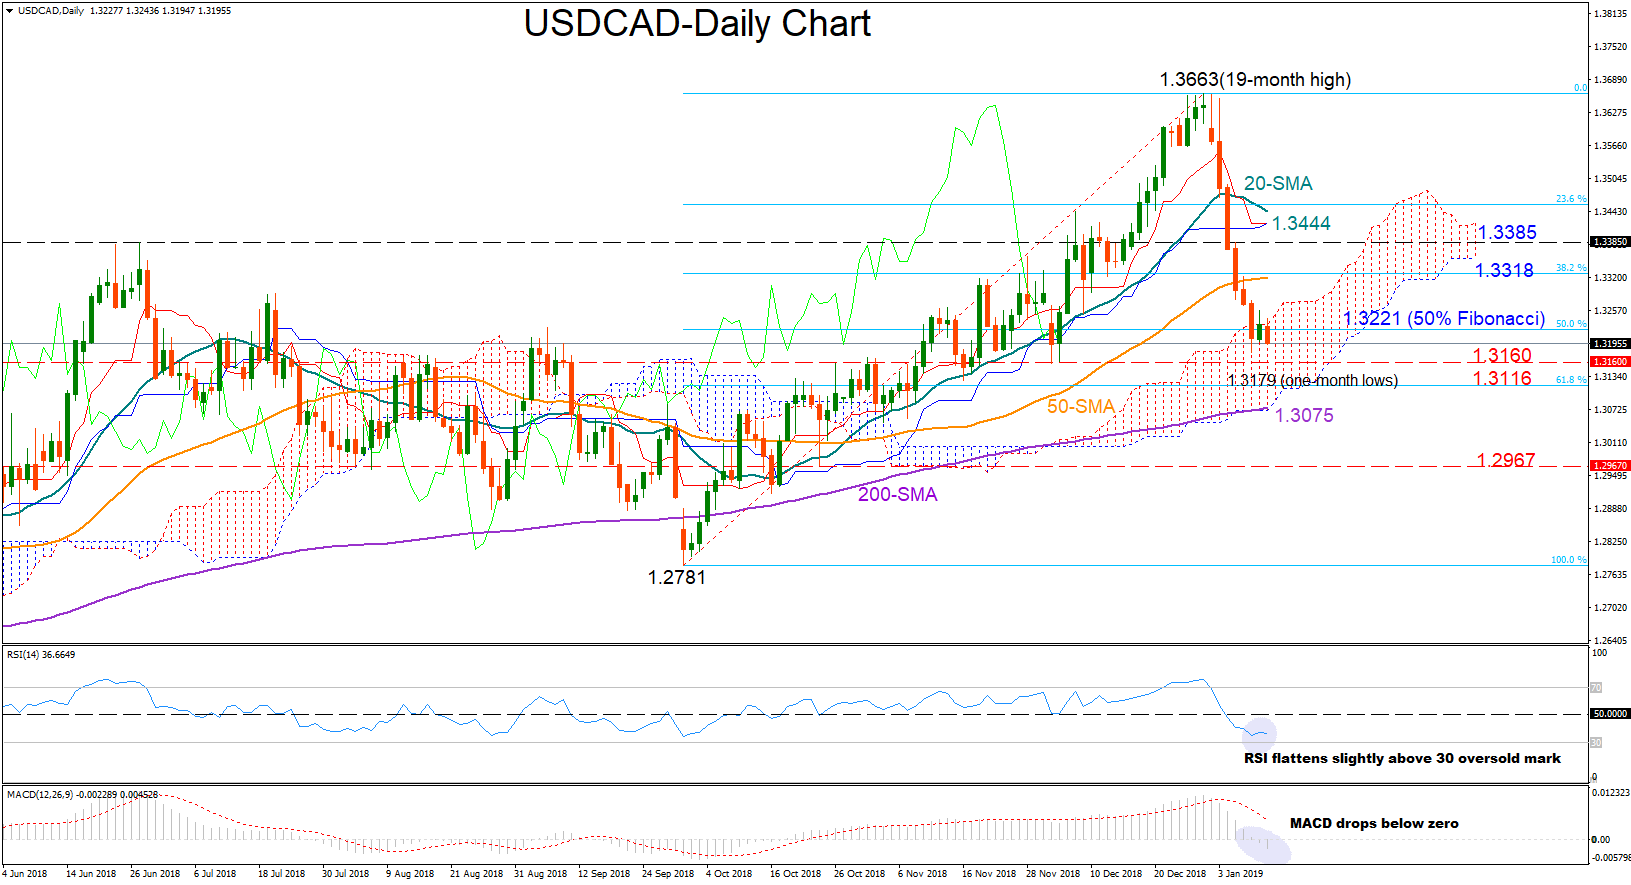
USDCAD Freefall Pauses Around 50% Fibonacci, Bias Still Negative
USDCAD erased half of its October-December rally, dropping to a one-month low of 1.3179 on Wednesday before turning neutral.
According to the RSI the pair is not far away from oversold territory at the moment, as the indicator lies slightly above 30, a sign that a rebound could possibly emerge in the short term. Yet, with the MACD entering the negative zone and the blue Kijun-sen line set to cross above the red Tenkan-sen, any gains could appear limited. The bearish shift in the 20-day simple moving average (MA) also provides some negative signals.
Should the bears distance the price further below the 50% Fibonacci of the upleg from 1.2781 to 1.3631, immediate support could be found between the 1.3160 barrier and the 61.8% Fibonacci of 1.3116. Under that region, a stronger sell-off could take place probably towards 1.2967 but only if the price successfully clears out the 200-day MA currently at 1.3075.
In the alterative scenario, in case the price jumps back above the 50% Fibonacci of 1.3221, investors would be interested to see whether bullish pressure is enough to overcome the 50-day MA and the 38.2% Fibonacci at 1.3318. Slightly higher, July’s peak of 1.3385 could be next in target, while if more gains come into the market, buyers would be eagerly waiting for a break above the 20-day MA at 1.3444.
Turning to the three-month period picture, the bullish outlook has somewhat faded after the market’s recent freefall. Yet, as long as the 50-day MA holds above the 200-day MA, the risk is positive.
EUR/GBP Daily Outlook
Daily Pivots: (S1) 0.8987; (P) 0.9014; (R1) 0.9054; More...
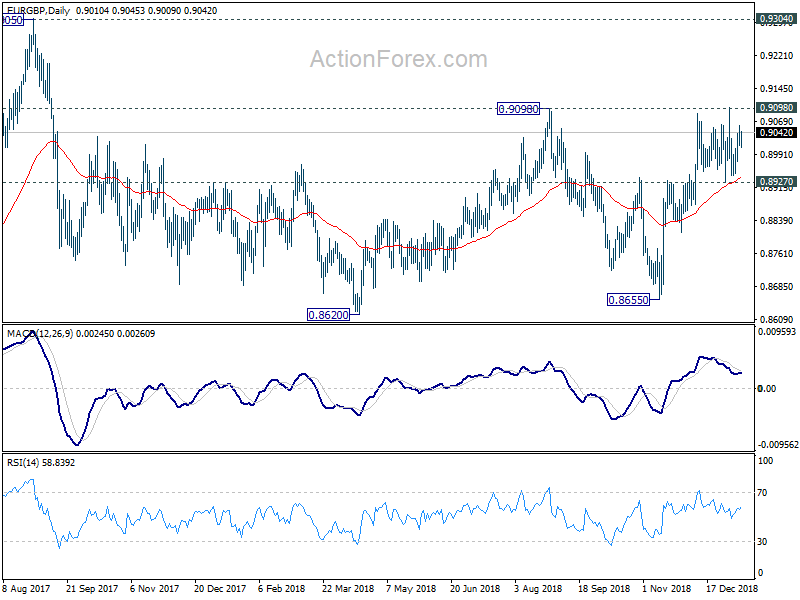
Intraday bias in EUR/GBP remains neutral as consolidation continues. Further rally is expected with 0.8927 support intact. On the upside, firm break of 0.9098 resistance will extend the whole rise from 0.8655 to 0.9304 key resistance next. However, on the downside, break of 0.8927 support will suggest near term reversal and turn bias to the downside for 0.8810 support and below.
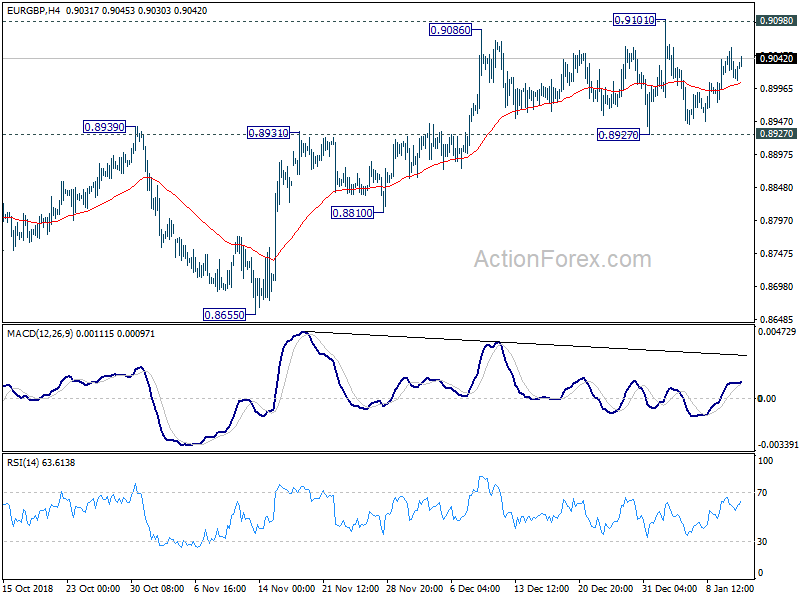
In the bigger picture, EUR/GBP is seen as staying in long term range pattern started at 0.9304 (2016 high). It should be in medium term rising leg for 0.9304. Meanwhile, in case of another fall, downside should be contained by 0.8620/55 support zone to bring rebound.
EUR/AUD Daily Outlook
Daily Pivots: (S1) 1.5947; (P) 1.6051; (R1) 1.6108; More....
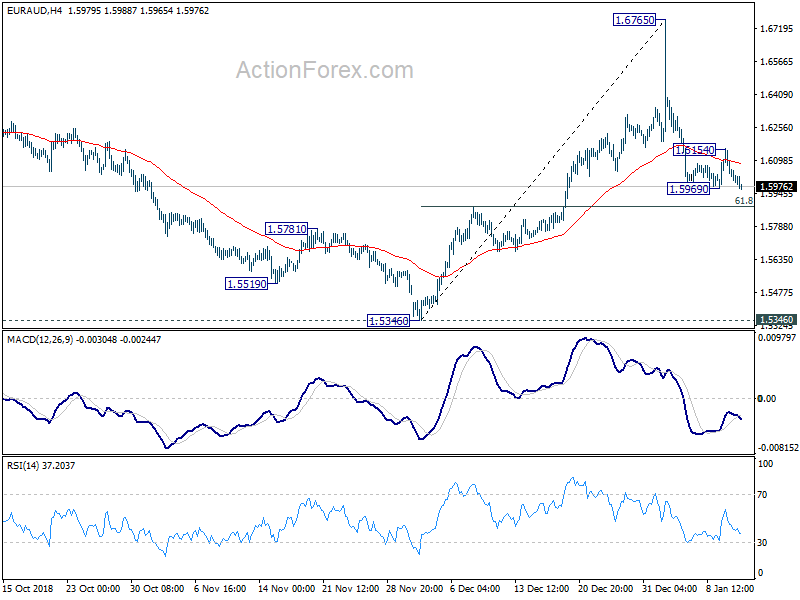
Despite recovery to 1.5154, EUR/AUD quickly reversed and intraday bias is turned neutral again. On the downside, break of 1.5696 will extend the pull back from 1.6765 to 61.8% retracement of 1.5346 to 1.6765 at 1.5888 and below. On the upside, above 1.6154 will turn bias to the upside for retesting 1.6765 high.
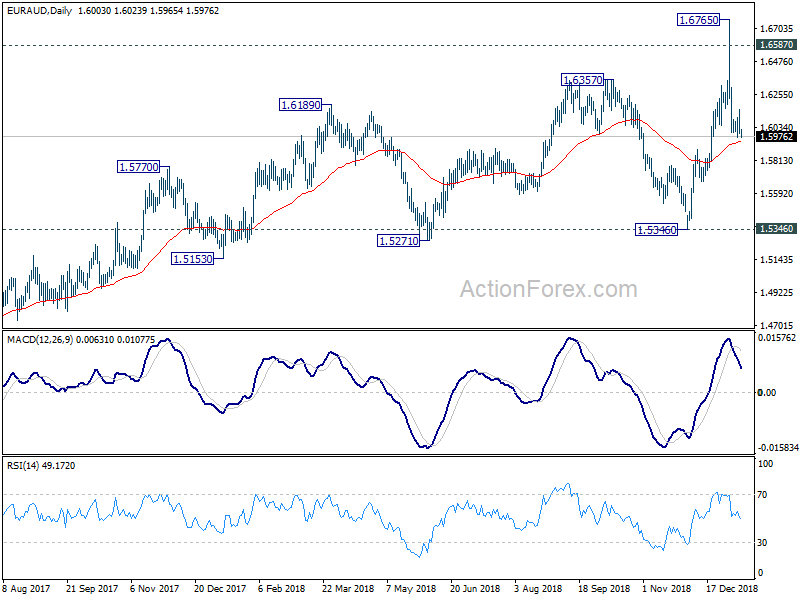
In the bigger picture, the failure to sustain above 1.6587 key resistance (2015 high), argues that up trend from 1.1602 (2012 low), is not ready to resume yet. But still, as long as 1.5346 support holds, outlook will remain bullish. Break of 1.6765 will target 61.8% retracement of 2.1127 (2008 high) to 1.1602 at 1.7488 next.
AUD/USD Daily Outlook
Daily Pivots: (S1) 0.7155; (P) 0.7177; (R1) 0.7207; More...
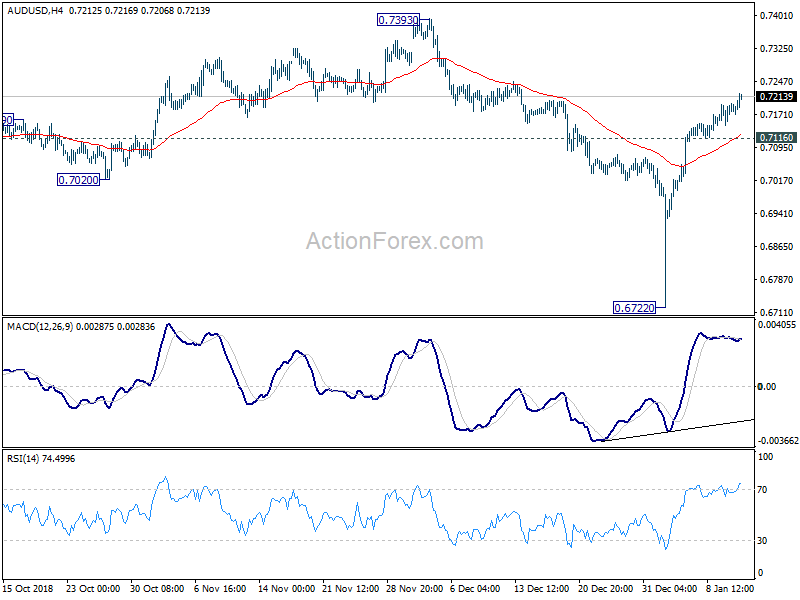
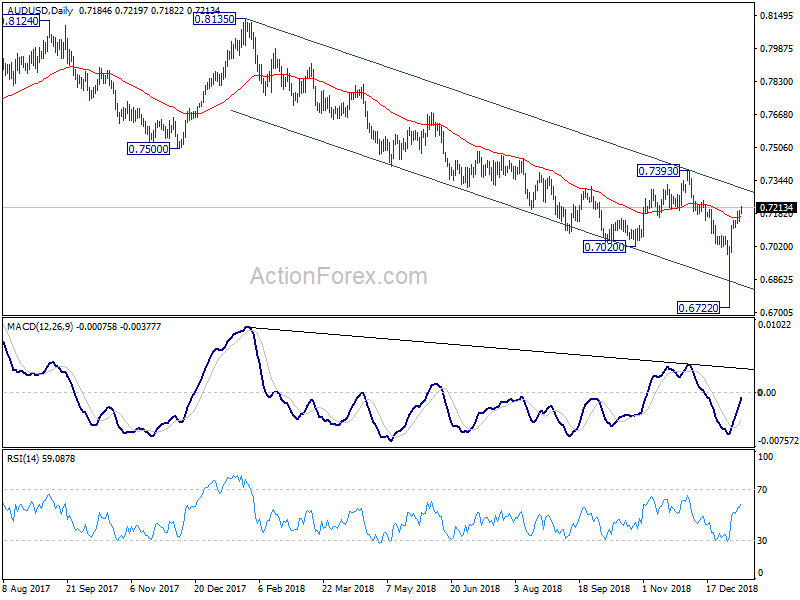
Despite diminishing upside momentum as seen in 4 hour MACD, intraday bias stays on the upside in AUD/USD. Current rebound from 0.6722 might extend higher. But upside should be limited below 0.7393 resistance. On the downside, break of 0.7116 minor support will turn bias back to the downside for retesting 0.6722 low. Overall, larger down trend from 0.8135 is expected to resume later after consolidation completes.
In the bigger picture, the failure to sustain below 0.6826 (2016 low) suggests that the long term down trend is now ready to resume yet. But prior rejection by 55 week EMA indicates underlying medium term bearishness in the pair. Outlook will also stay bearish as long as 0.7393 resistance holds. On the downside, sustained break of 0.6826 will target 0.6008 (2008 low).
USD/CAD Daily Outlook
Daily Pivots: (S1) 1.3207; (P) 1.3233; (R1) 1.3265; More...
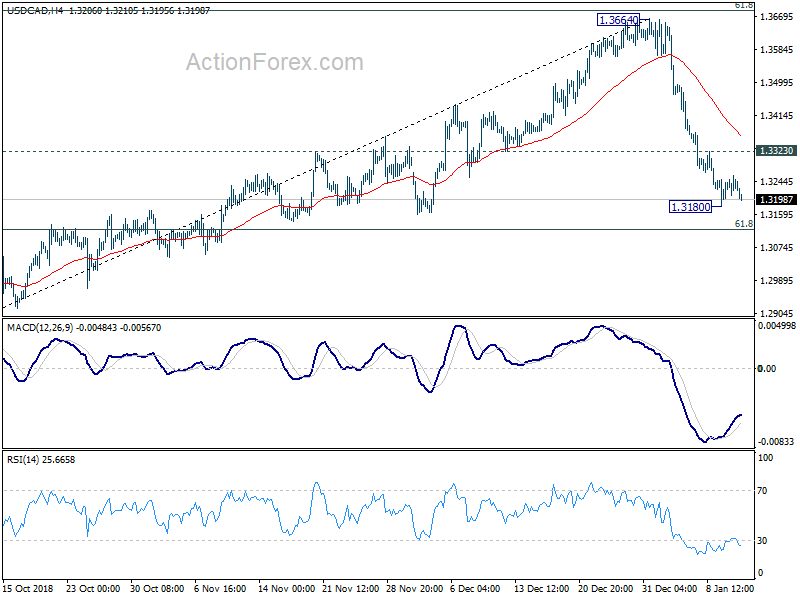
Intraday bias in USD/CAD is turned neutral as the consolidation fro 1.3180 temporary low might extend. But recovery should be limited by 1.3323 minor resistance to bring another decline. On the downside, break of 1.3180 will resume the fall from 1.3664 and target 61.8% retracement of 1.2781 to 1.3664 at 1.3118. We'll start look for bottoming sign below there. On the upside, above 1.3323 will suggest short term bottoming and turn bias back to the upside for stronger rebound.
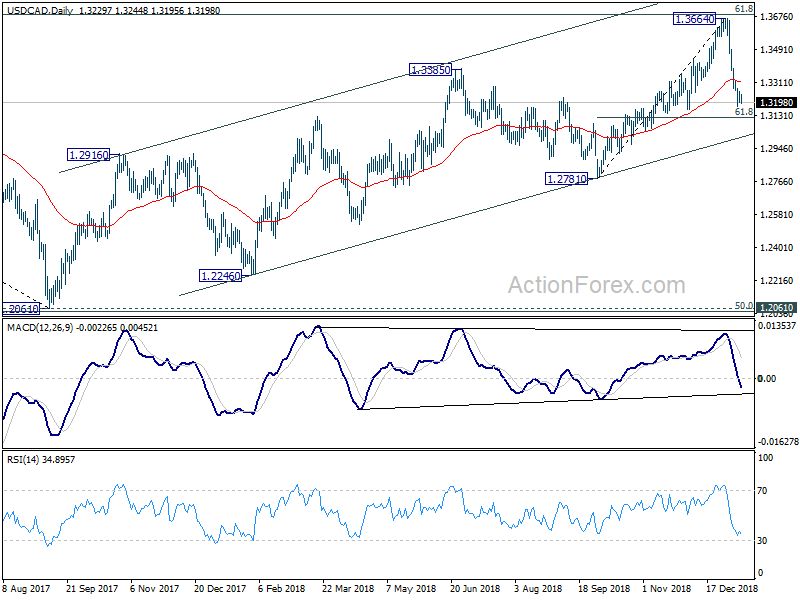
In the bigger picture, the medium term rise from 1.2061 (2017 low) might continue further. But the structure of such rise is not clearly impulsive so far. Hence, we'd stay cautious on strong resistance from 61.8% retracement of 1.4689 (2016 high) to 1.2061 at 1.3685 and 1.3793 resistance to limit upside, and bring medium term topping. But in any case, medium term outlook will stay bullish as long as channel support (now at 1.2993) holds. Sustained break of 1.3793 will pave the way to retest 1.4689 (2015 high).
Canada PM Trudeau to pressure Trump to drop steel tariffs
Canadian Prime Minister Justin Trudeau said in a televised Q&A that he's working on pressuring Trump to drop steel and aluminum tariffs. The measures were imposed last May using national security as excuse. And it stays in place despite the signing of the so called US-Mexico-Canada (USMCA) trade agreement in November.
Trudeau said "We have already been working with members of Congress, with governors, with business interests who are being affected negatively by these tariffs ... to put pressure on the President that in the process of ratification, they should remove those steel and aluminum tariffs".
Asked why he still signed the USMCA with steel tariffs in place, Trudeau defended and said securing the deal "at a time of unpredictability and protectionism in the United States was a massive priority for all Canadians".