Sample Category Title
AUD/USD Moving Towards 0.7249
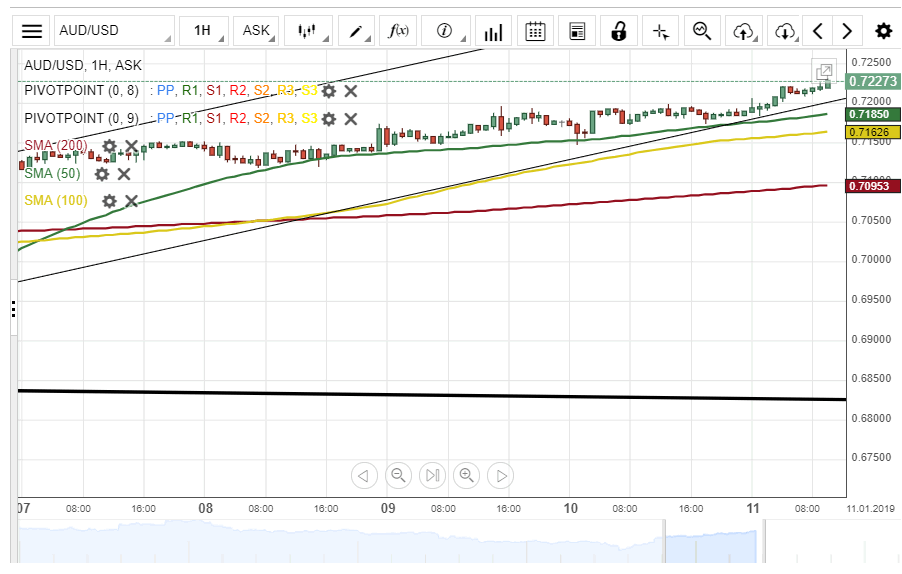
The Australian Dollar has continued to gain strength against the US Dollar. The currency pair appreciated about 49 base points during the previous trading session.
By and large, the 50-hour simple moving average will guide the exchange rate towards the monthly pivot points at 0.7246 within this session.
If and when the resistance level set by the monthly PP holds, the currency exchange rate will make a reversal south and potentially breakout through the lower boundary of a junior ascending channel at 0.7183 during the following trading session.
USD/CAD Like To Edge Lower Today
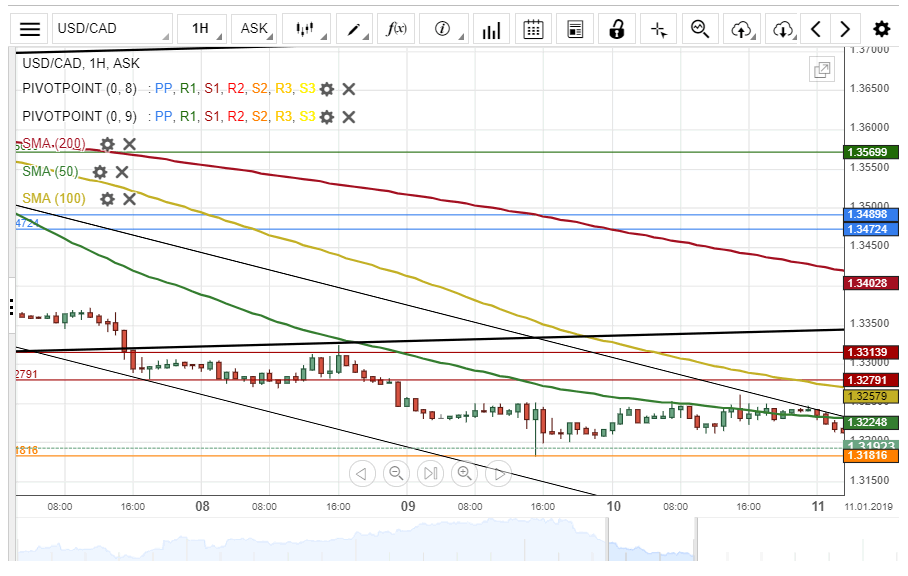
The US Dollar traded sideways movement against the Canadian Dollar on Thursday. The 50-hour simple moving average provided resistance for the currency pair at 1.3250 during Thursday's trading session.
Everything being equal, it is likely that the currency exchange rate continues to edge lower during the following trading session.
Bearish traders could push the USD/CAD currency pair towards a support cluster formed by the combination of the weekly and the monthly pivot points at 1.2985 before the end of this week's session.
NZD/USD Bullish Sentiment Today
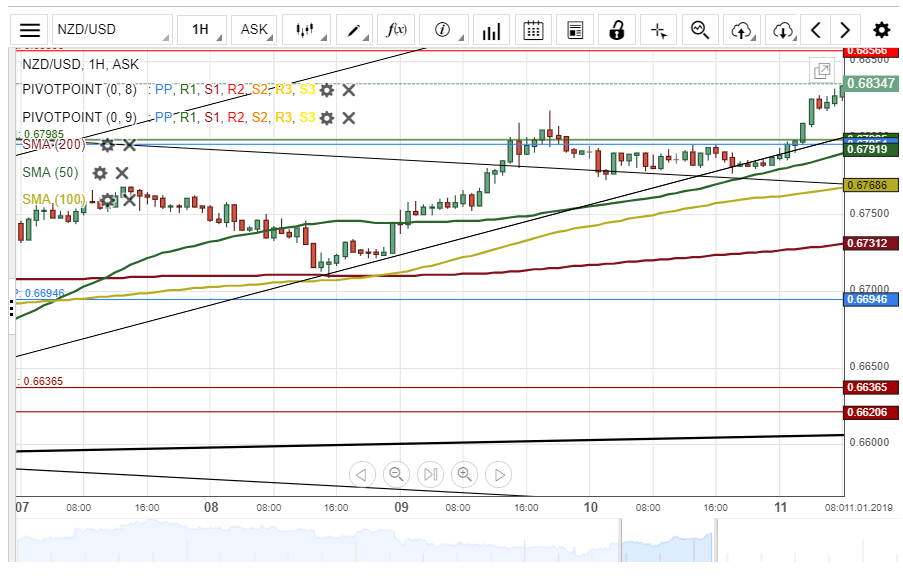
A resistance cluster formed by the combination of the weekly and the monthly pivot points restricted the upside movement of the New Zealand Dollar against the US Dollar on Thursday.
However, the situation changed during the Asian session on Friday, as bullish traders pushed the NZD/USD currency pair past the strong resistance level as mentioned above.
As for the shorter term future, it is likely that the currency exchange rate will target the weekly R2 at 0.6856.
Stocks Higher Again As Momentum Gathers
Markets building on renewed momentum
It's been a relatively relaxed start to trading on the final day of the week, with equity markets once again edging higher and looking to extend their winning streak following Thursday's turnaround.
Needless to say it's been a very encouraging couple of weeks for investors, full of post-Christmas cheer. We've almost halved the deficit in the S&P 500, Dow and NASDAQ, having entered into bear market territory in two of these, and investors have become less gloomy about the outlook.
That's not to say that challenges don't still exist for the global and domestic economy, or that a slowdown isn't still expected this year. But improved trade relations between the US and China and progress towards a deal and away from tariffs is undoubtedly positive and reduces a major headwind. The same is true of the Fed and it's shift to more flexibility on rate hikes.
Brexit vote on Tuesday a major source of sterling volatility
One important headwind, particularly domestically, is Brexit and we are now heading into another crunch week. Debates have begun in parliament on Theresa May's deal ahead of the vote on Tuesday, assuming this one isn't cancelled, and traders will be preparing for significant volatility in UK instruments, particularly the pound, going forward.
The deal is widely expected to be rejected and by quite a margin which opens the door to numerous possibilities in the coming weeks including a no confidence vote in the government, a push for a second referendum and of course, no deal planning. The latter looks less likely after this week's amendments in parliament but it's certainly still possible. The pound has been relatively steady this week but I don't expect that to last long. Obviously, May's deal somehow passing should be very bullish for the pound but nothing ever is that straightforward, especially when Brexit is concerned.
Gold heading higher again on softer dollar
Gold is pushing higher this morning, supported once again by a weaker dollar. The greenback did pare some of Wednesday's losses yesterday but that's all it was, with the break the day before looking quite significant from a technical standpoint and potentially opening up a move back towards the July and September lows.
This means the $1,300 resistance level is gold is looking very vulnerable and could be a case of when, rather than if, it breaks. Risk aversion has been supportive for gold but as we're seeing now, it's primary driver is the dollar. And the dollar softening as trade relations between the US and China improves should continue to lift gold.
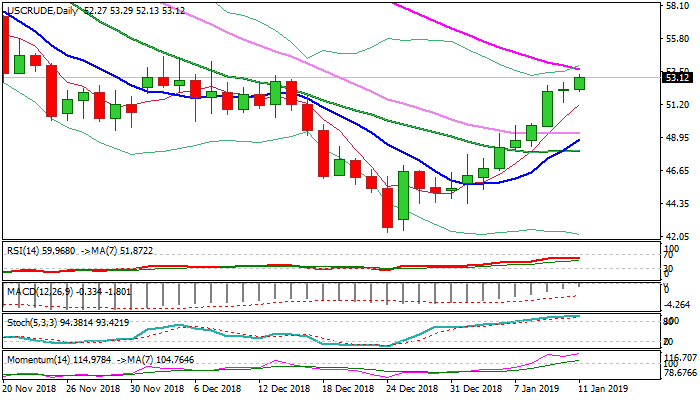
WTI Oil Outlook: Recovery Extension Eyes Daily Cloud Base As WTI Is On Track For The Biggest Weekly Gain...
WTI oil extends advance on Friday after the action on Thursday ended in Doji, signaling a pause in recent strong rally.
Fresh upside pressures falling 55SMA ($53.68) and could extend towards key barriers at $54.54/$55.08 (4 Dec high / base of falling thick daily cloud), after break above psychological $50 barrier and extension above 200WMA ($52.24) generated strong bullish signals.
The oil is on track for the second straight bullish weekly close (the biggest one-week gains since late June 2018).
Bullish studies add to growing positive sentiment on hopes of US/China deal and output reduction from main oil exporters that would stabilize global oil markets.
Fresh draws in US crude stocks last week added to bullish outlook, with weekly close above 200WMA needed to confirm.
Dip-buying above $50 remains favored near-term scenario.
Res: 53.68, 54.54, 55.08, 55.55
Sup: 52.24, 51.30, 50.50, 50.00
USD Weakens On Powell’s And Clarida’s Comments
USD weakened against a number of its counterparts during the Asian session today, as Fed Chairman Powell and Fed Vice Chair Clarida made some dovish comments. Fed Chairman Powell repeated on Thursday that the Fed could be patient on monetary policy, given that inflation remains stable. It should be noted though that the greenback got some temporary support as Powell at some point mentioned that the Fed may further shrink its balance sheet, implying that some indirect tightening could happen. Fed Vice Chair Clarida also backed Powell’s comments later on as he stressed the Fed’s ability for a more patient stance. Analysts, note that the market has almost priced in that the Fed will not be hiking rates any further in 2019. We currently maintain a bearish outlook for the USD and we could see it being sensitive to today’s financial releases. Dropped during the European and the American session, breaking the 1.1550 (R1) support line (now turned to resistance), however bounced during today’s Asian session on the 1.1500 (S1) support line. We maintain a bullish outlook for the pair, as the USD may weaken even further. The pair could also prove sensitive to today’s US financial releases as the headline CPI for December is expected to slow-down. Should the pair find fresh buying orders along its path, we could see it breaking the 1.1550 (R1) resistance line and aim for the 1.1610 (R2) resistance hurdle. Should the pair come under the selling interest of the market, we could see it breaking the 1.1500 (S1) and aim for the 1.1465 (S2) support barrier.
Increasing Brexit uncertainty keeps the pound in check
Increased Brexit uncertainty seems to be keeping the pound in check, especially after the UK Parliament, voted that Theresa May will have only a few days to prepare and present a plan B should her Brexit plan be rejected on Tuesday. Analysts, point out that the two parliamentary defeats of Theresa May, undermines the authority of Theresa May as a PM and enhances the possibility of a general election. UK’s Labour party has already called for a general election, should Theresa May’s Brexit plan be rejected by parliament. The possibility of such a scenario, could prevent Labour MP’s from crossing the line and supporting Theresa May’s plan, reducing even further the chances of the plan being approved. Overall, we maintain a bearish outlook for the GBP and today’s GDP data could weigh on the pound. GBP/USD maintained its sideways movement yesterday, testing the 1.2795 (R1) resistance line. WE expect the pair to maintain its sideways movement, however it may prove sensitive to UK’s financial data releases and especially the GDP growth rates, during today’s European session. Should the bulls dictate the pair’s direction we could see the pair breaking the 1.2795 (R1) resistance line and aim for the 1.2880 (R2) resistance zone. Should on the other hand the bears take over, we could see the pair breaking the 1.2700 (S1) support line and aim for the 1.2630 (S2) support area.
Today’s other economic highlights
In today’s European session, we get from the UK the GDP growth rates, the manufacturing output growth rate and the trading balance, all for November. In the American session from the US we get the headline and core inflation rates for December and Baker Hughes oil rig count.
GBP/USD H4
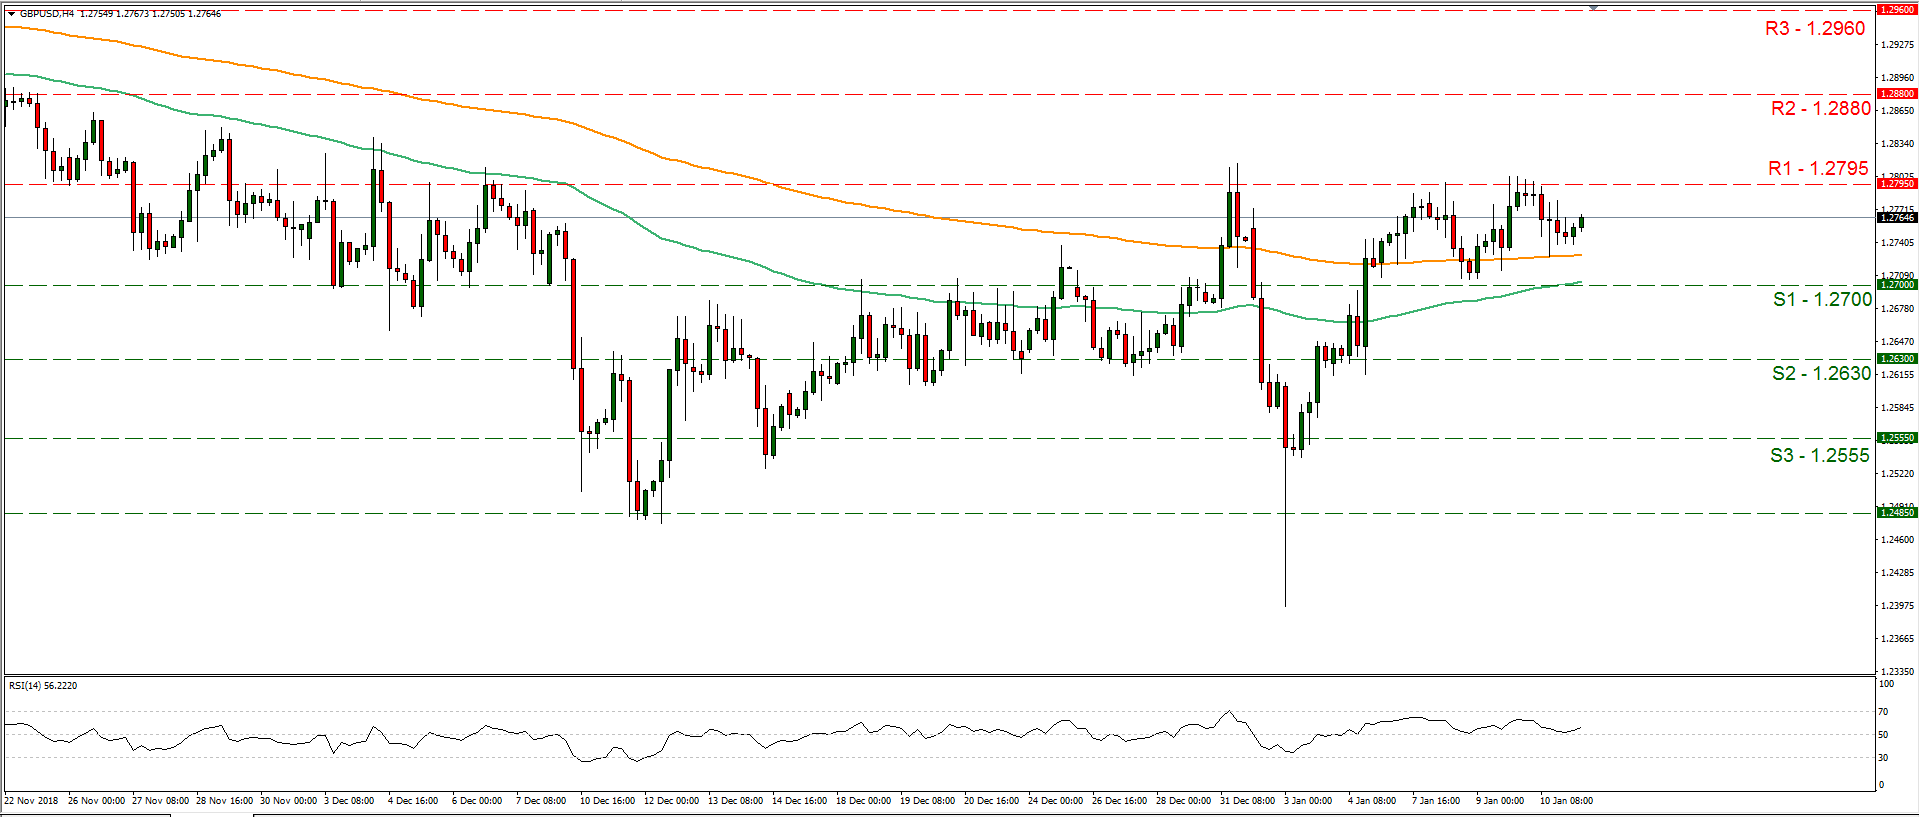
Support: 1.2700 (S1), 1.2630 (S2), 1.2555 (S3)
Resistance: 1.2795 (R1), 1.2880 (R2), 1.2960 (R3)
EUR/USD H4
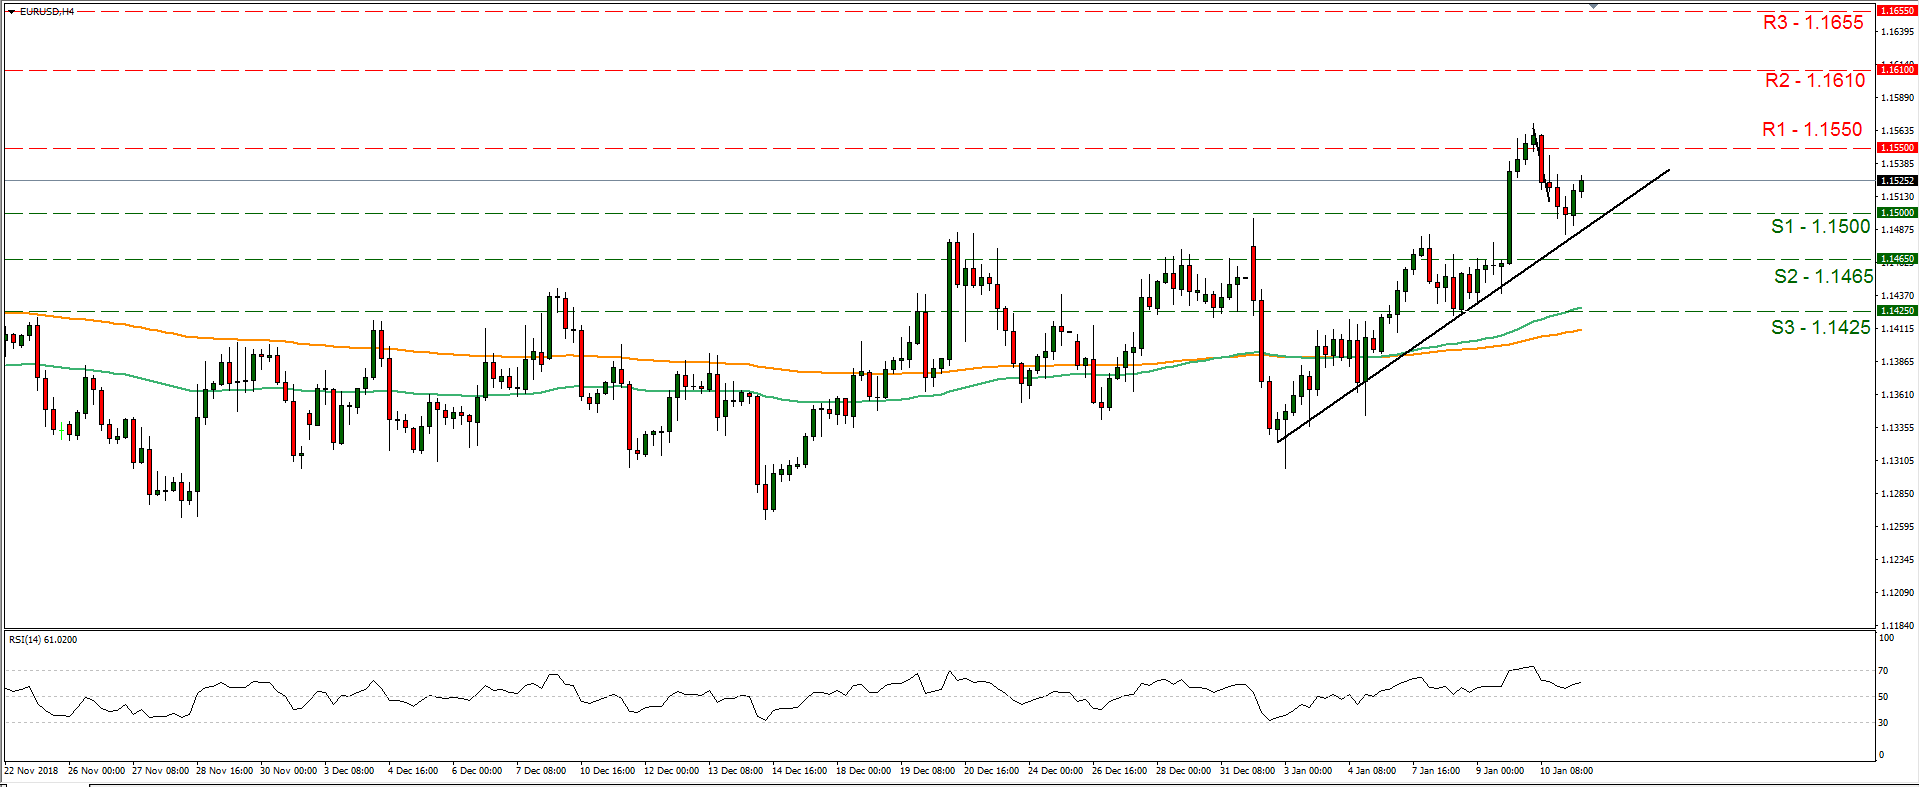
Support: 1.1500 (S1), 1.1465 (S2), 1.1425 (S3)
Resistance: 1.1550 (R1), 1.1610 (R2), 1.1655 (R3)
The US Dollar Slightly Strengthened
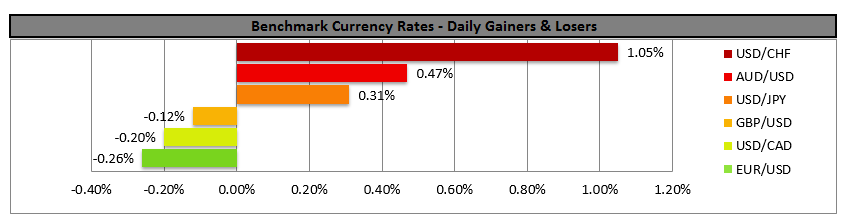
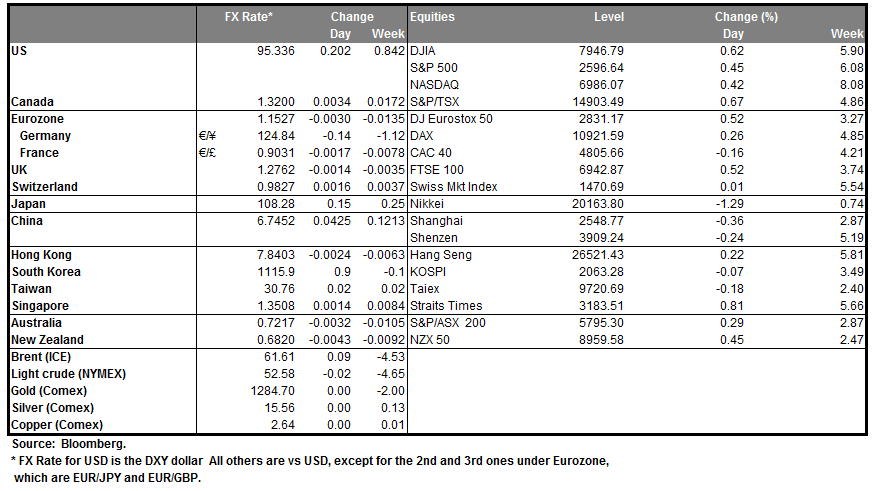
The US dollar slightly strengthened against a basket of major currencies. However, the US currency is still under pressure after the publication of the FOMC minutes. Some Fed representatives believe that it is not necessary to rush to a further increase in interest rates in the current year. Yesterday, the head of the US Central Bank announced that the regulator would take into account the state and risks in the global financial markets when adjusting monetary policy. The dollar index (#DX) closed yesterday in the positive zone (+0.35%).
Today, during the Asian trading session, a report on the volume of retail sales has been published in Australia, the figure counted to +0.4% in November and was better than the forecasted value of +0.3%. We expect important statistics from the UK and the US.
The "black gold" prices continue to show positive dynamics. At the moment, futures for the WTI crude oil are testing the mark of $53.15 per barrel.
Market Indicators
- Yesterday, the bullish sentiment was observed in the US stock market: #SPY (+0.35%), #DIA (+0.45%), #QQQ (+0.29%).
- The 10-year US government bonds yield has become stable. At the moment, the indicator is at the level of 2.72-2.73%.
The news feed on 11.01.2019:
- UK GDP data at 11:30 (GMT+2:00);
- UK manufacturing production at 11:30 (GMT+2:00);
- Core consumer price index in the US at 15:30 (GMT+2:00).
GBPJPY Moves Sideways Within SMAs, Still Negative In Near Term
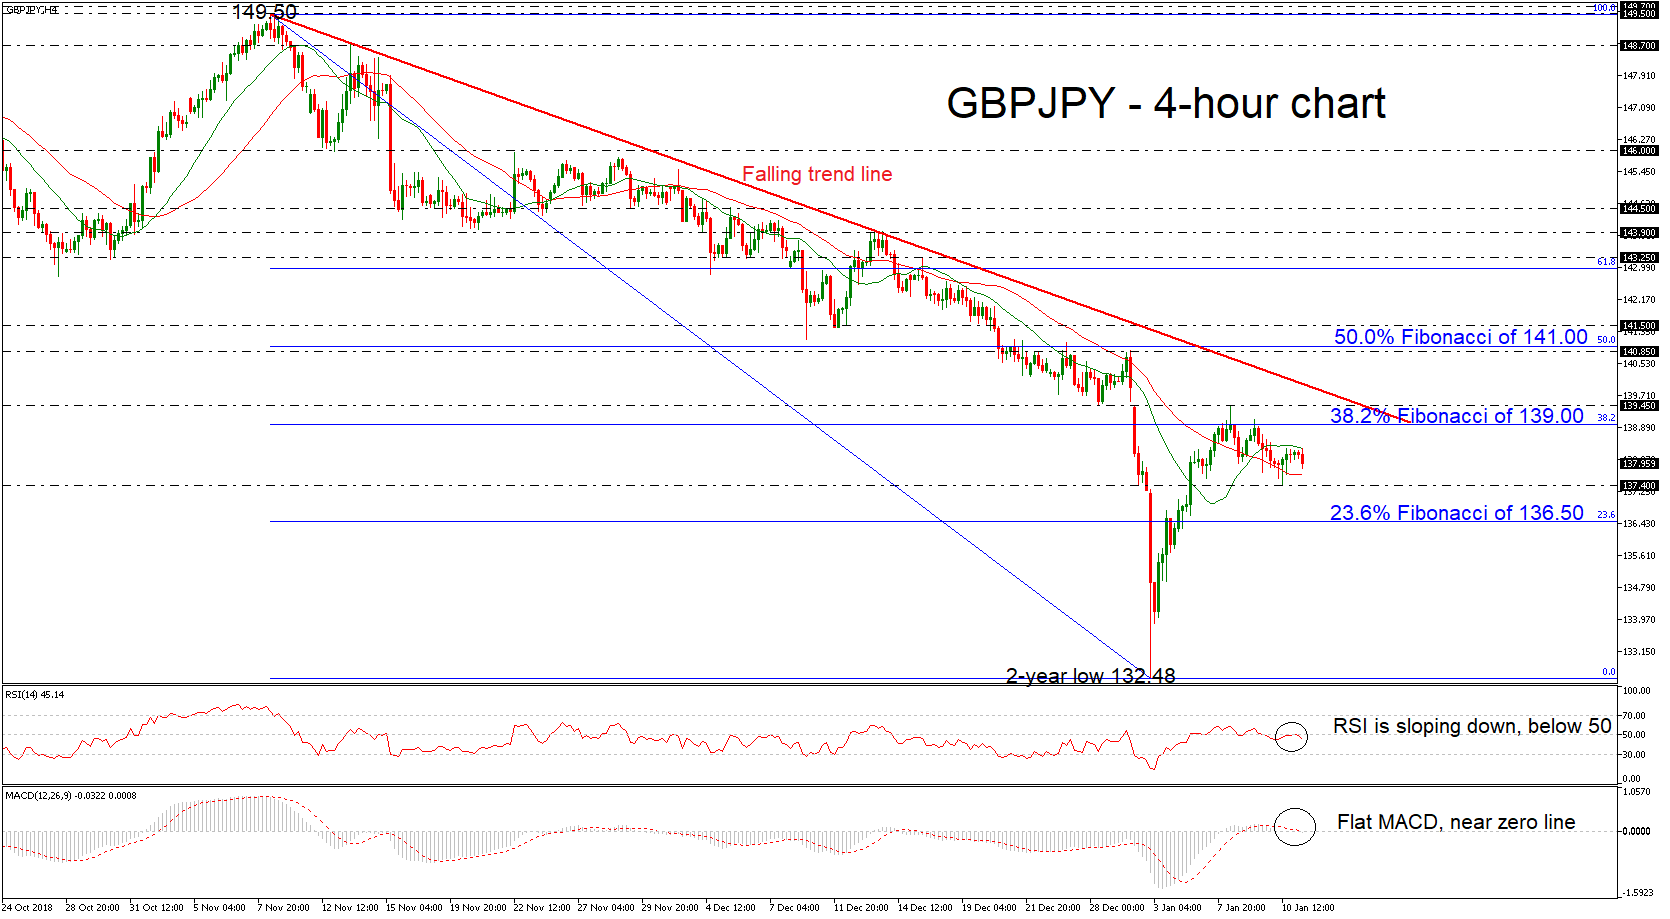
GBPJPY has been in a neutral mode after the price jump above the more than two-year low around 132.48. The technical indicators are turning lower as the price is losing momentum. The RSI indicator is sloping down, failing to surpass the 50 level, while the MACD oscillator is flattening near the zero line in the 4-hour chart. Also, currently, the price holds within the 20- and 40-simple moving averages (SMAs) lacking direction.
In case of bullish actions above the 38.2% Fibonacci retracement level of the downleg from 149.50 to 132.48, near 139.00, the price could find immediate resistance at the 139.45 barrier. Higher still, the pair could touch the 140.85 hurdle, which stands near the 50.0% Fibonacci level.
Alternatively, should the price break the floor around the 137.40 support, then the price could open the way towards the 23.6% Fibonacci of 136.50. If the latter proves a weak obstacle, then the next stop for investors to have in mind is the two-year low of 132.48.
Having a look at the bigger structure, GBPJPY has been developing in a descending movement since November 2018, creating lower lows and lower highs.
JP225 Stock Index Stalls Downtrend At 15-Month Lows
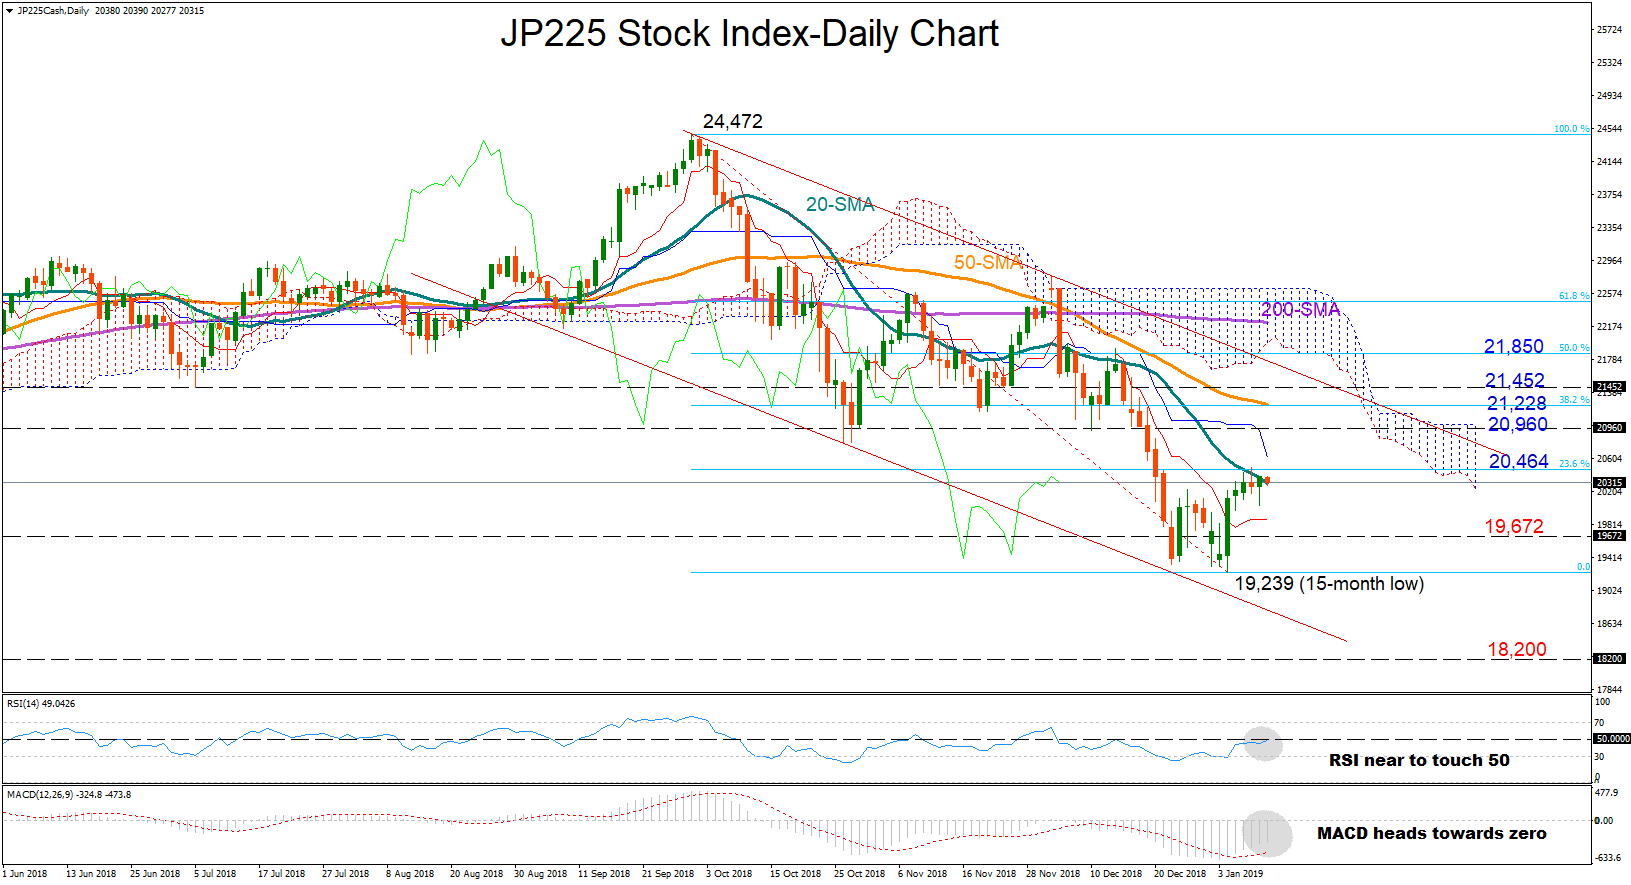
Japan's 225 stock index (Nikkei 225) gained some ground after dropping to a 15-month low of 19,239 in the first week of the year and is now looking for a cross above the 20-day simple moving average. In the short term the index could consolidate as the RSI is ready to touch its 50-neutral mark, while the MACD continues to improve towards the zero line. The red Tenkan-sen line is flattening after a small rebound, supporting this view as well.
An extension lower may pause around 19,672, taken from the tops registered during the first quarter of 2017. Below that point, the bears will push hard to break the 19,239 bottom to allow more sellers to enter the market. If their efforts prove successful, the price will probably head further down to the 19,000-18,200 area.
On the upside, the 23.6% Fibonacci of 20,464 of the downleg from 24,472 to 19,239 could act as a barrier as it did two days ago, while above it, resistance could be found near 20,960. Moving further up, the way could open towards the 21,228-21,452 region where the 50-day MA and the 38.2% Fibonacci are located. Steeper increases may also touch the 50% Fibonacci of 21,850.
In the bigger picture the outlook remains negative as long as the price holds below 21,452.
AUD/CHF Counter Trend Move Below D H3 – 0.7106
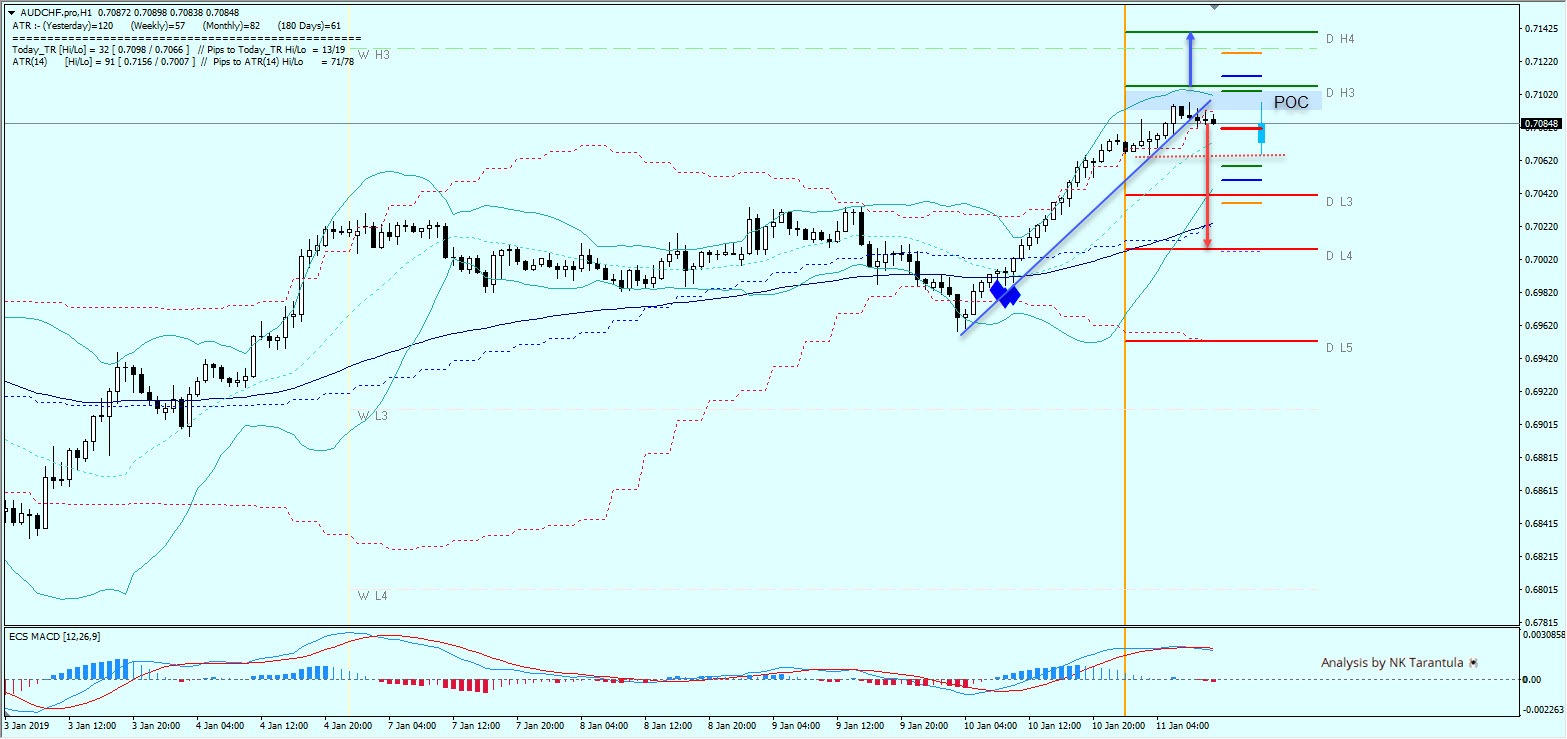
The AUD/CHF has made a bounce following a positive correlation with the AUD/USD as I already show you in my previous AUD analysis.
The AUD/CHF has reached D H3, double BB confluence and ATR pivot. Today it’s Friday so we might see a counter trend move that might happen as a profit taking. Rejections from 0.7085-0.7100 could provide additional momentum towards 0.7065 and if the price goes below it, we should see 0.7035 and 0.7010.
However, a close above 0. 7010 could prove additional bullish momentum towards 0.7140.