Sample Category Title
GBPJPY Surpasses 23.6% Fibonacci, Continuing Bullish Correction
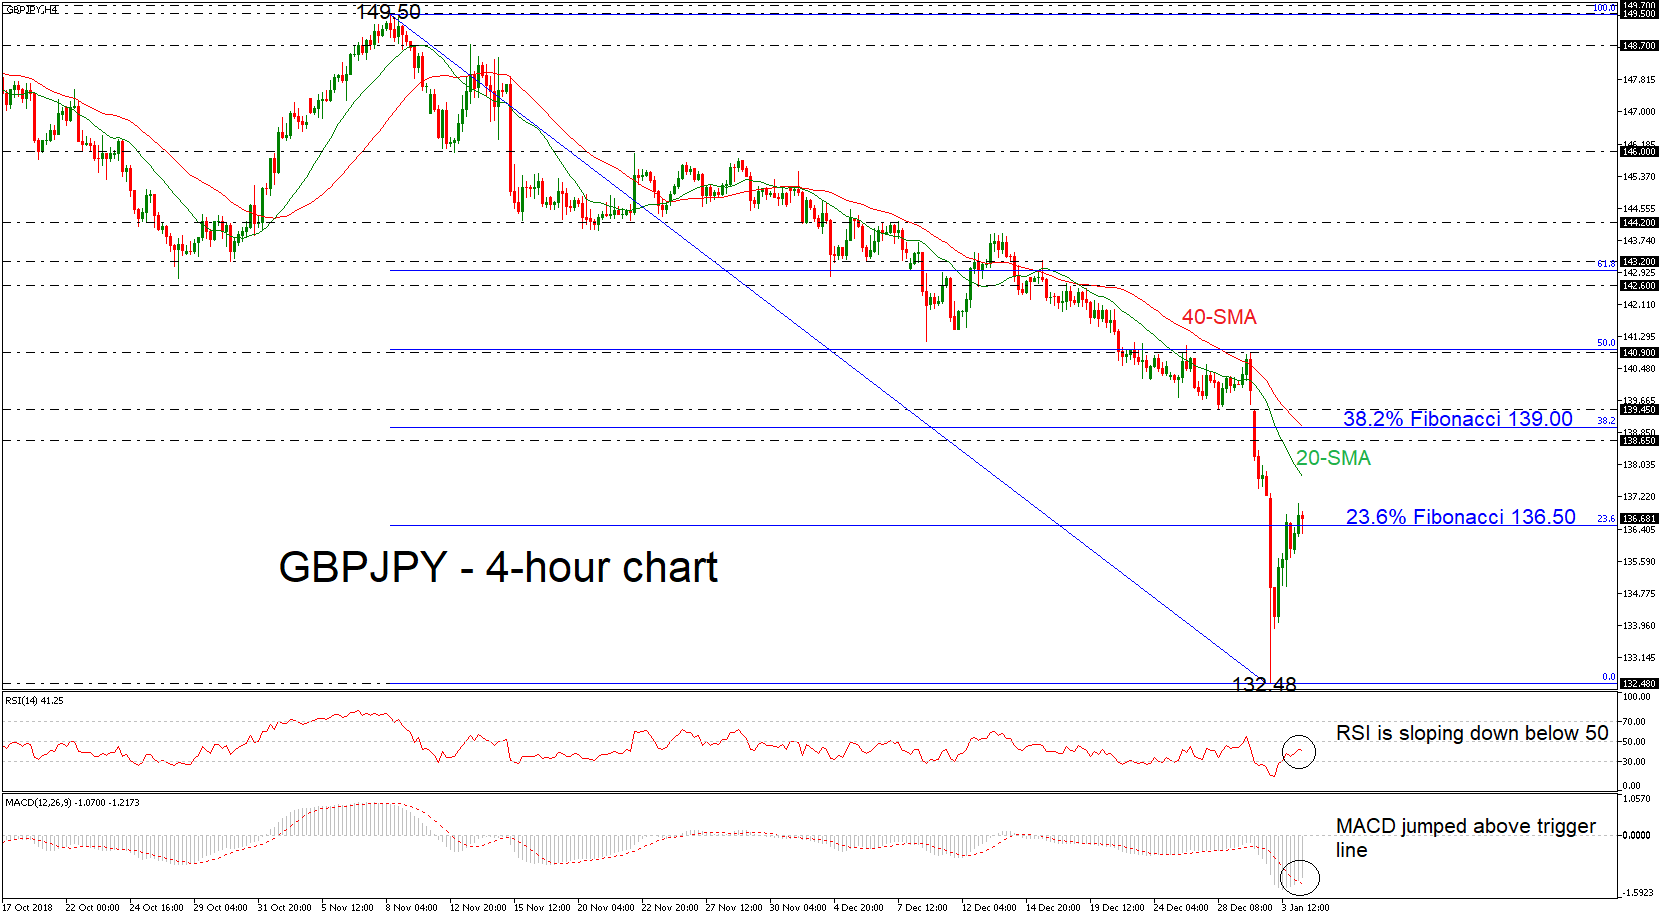
GBPJPY is seeing a pause in the selling pressure after reaching a more than two-year low around 132.48 on Thursday, with the MACD hinting a continuation of the rebound, fluctuating above trigger line in the 4-hour chart. However, the RSI indicator is sloping down in the negative territory, despite the latest upside pullback in the market.
Further bullish actions above the 23.6% Fibonacci retracement level of the downleg from 149.50 to 132.48, near 136.50, could find immediate resistance at the 20-simple moving average (SMA) around 137.70. Higher, the pair could touch the 138.65 resistance, while a climb above this barrier could hit the 38.2% Fibonacci, which overlaps with the 40-SMA of 139.00 at the time of writing.
Alternatively, should the price break the floor around the 23.6% Fibonacci, support could appear at 132.48. If the latter proves a weak obstacle, then the next stop for investors to have in mind is the 129.00 psychological level, taken from the highs on December 2016.
Overall, GBPJPY is still in a downward movement but upside risks are rising in the very short-term.
US Futures Up Ahead Of US NFP | UK’s Housing Sector Suffer From Brexit
Today is the day when we will see the most important set of economic data. The US NFP is the most significant economic number for traders and they are likely to dissect this number into smaller pieces in order to better appreciate the health of the labour market. The dollar index is set for a weekly drop ahead of this critical report. YTD it is up by 0.9 percent.
The weekly drop in the dollar price is mainly due to some qualms that hiring may have eased off over in the U.S. But, we do think there may be more weakness on the cards for the dollar from here and the greenback may start to consolidate around its current level (trading range between 94-97). Year-to-date the dollar index performance is far stronger than any other equity market in the developed countries.
The ADP data usually sets the tone for the US NFP number and it confirmed that the private payrolls number rose 271K last month beating the forecast of 179K. The ISM manufacturing PMI released earlier this month painted a less optimistic picture as it missed the forecast (actual 54.1 vs forecast 57.1).
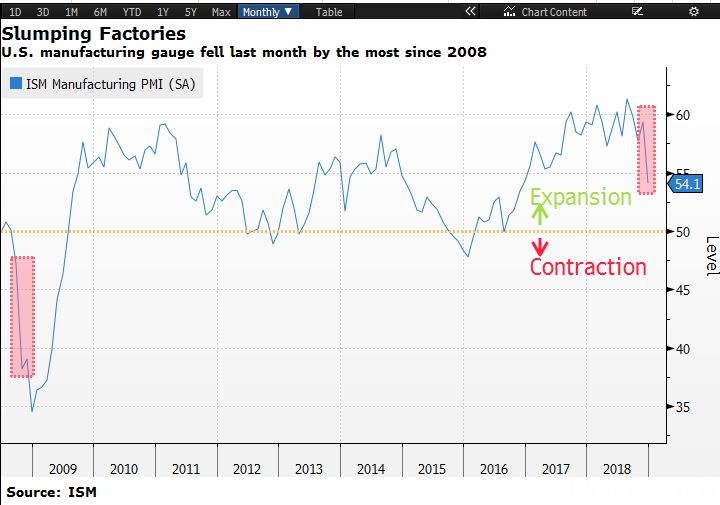
Clearly, there is an influence of the ongoing trade war between the US and China which has damped the outlook. These trade talks are expected to resume on Monday and perhaps there could be some resolution which can reduce the pain of the current bite.
If we see an improvement in the average hourly number, traders are likely to push the dollar index higher. The forecast for the average hourly number is 0.3% while the previous number came in at 0.2%. The unemployment rate is expected to remain as the same time which is 3.7%.
EU withdrawal deadline is coming soon for Brexit and the house prices have been the biggest victim of this chaos. During the month of December, the UK’s house prices experienced sharp decline again and investors are sceptical if they should park their money in brick and mortar, an asset class which is considered as the most place to park your money.
All eyes are on the upcoming parliamentary vote which is taking place on the 14th January and it is widely expected that Theresa May may not have enough support. That could trigger a general election and the volatility for Sterling would spike. During the last 28- 48 hours, sterling has been a winner in term especially when we have seen the Japanese yen, Aussie and Turkish lira going wonky.
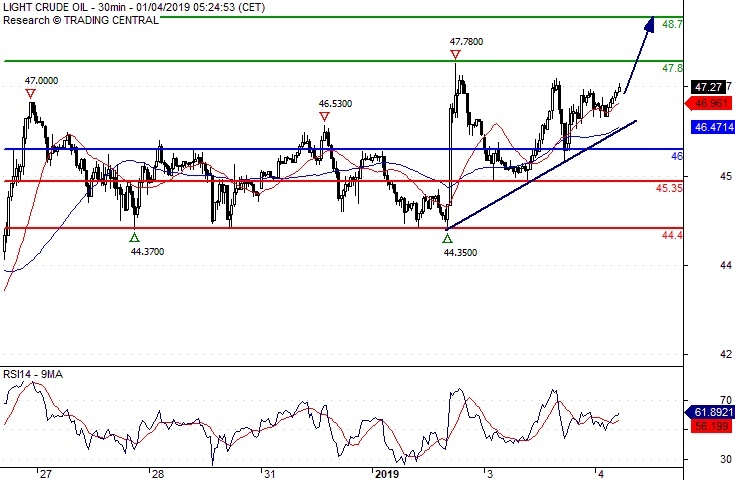
Crude Oil Further Advance
Pivot (invalidation): 46.00
Our preference Long positions above 46.00 with targets at 47.80 & 48.70 in extension.
Alternative scenario Below 46.00 look for further downside with 45.35 & 44.40 as targets.
Comment The RSI is mixed to bullish.
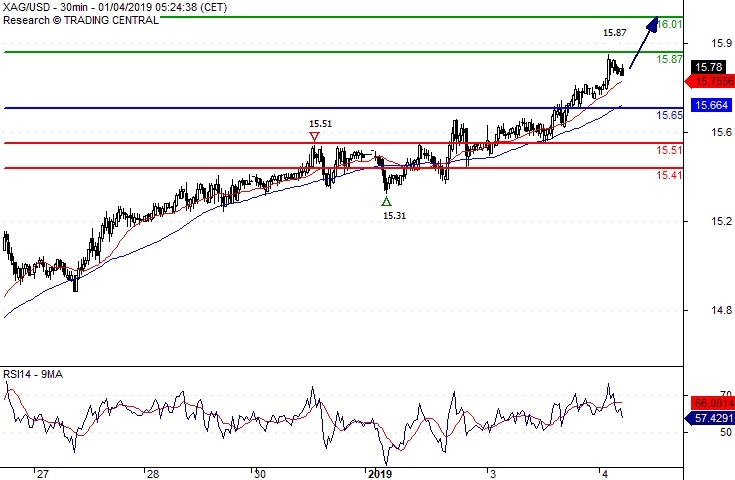
Silver Spot Further Advance
Pivot (invalidation): 15.6500
Our preference Long positions above 15.6500 with targets at 15.8700 & 16.0100 in extension.
Alternative scenario Below 15.6500 look for further downside with 15.5100 & 15.4100 as targets.
Comment The RSI is mixed to bullish.
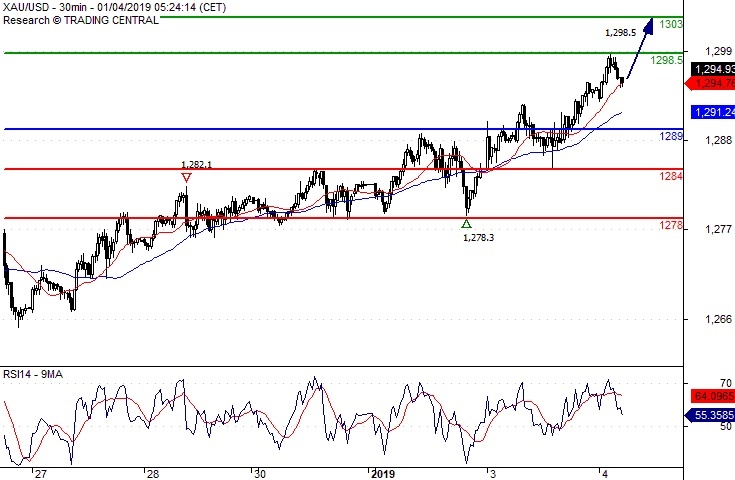
Gold Spot Further Advance
Pivot (invalidation): 1289.00
Our preference Long positions above 1289.00 with targets at 1298.50 & 1303.00 in extension.
Alternative scenario Below 1289.00 look for further downside with 1284.00 & 1278.00 as targets.
Comment The RSI is mixed to bullish.
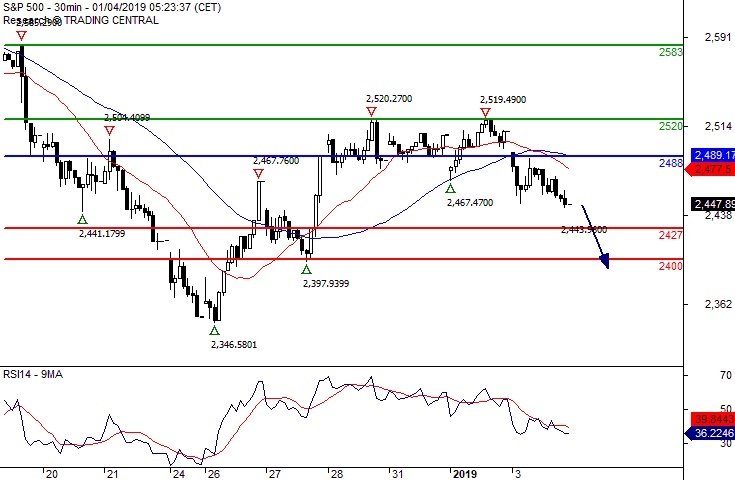
S&P 500 Under Pressure
Pivot (invalidation): 2488.00
Our preference Short positions below 2488.00 with targets at 2427.00 & 2400.00 in extension.
Alternative scenario Above 2488.00 look for further upside with 2520.00 & 2583.00 as targets.
Comment The RSI is bearish and calls for further decline.
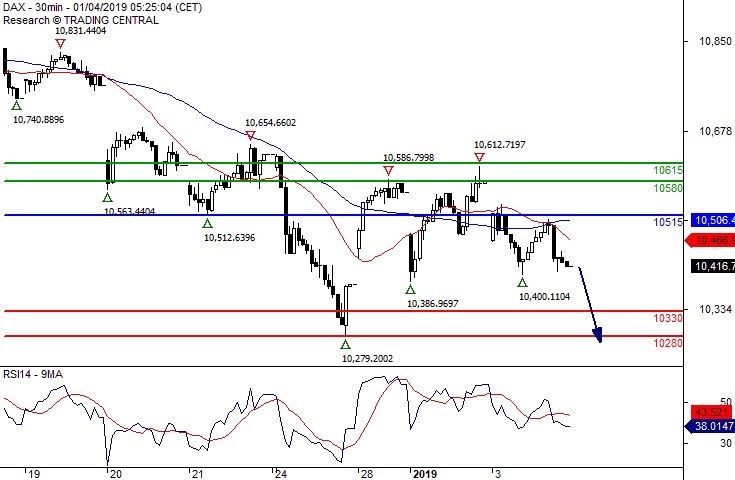
DAX Consolidation In Place
Pivot (invalidation): 10515.00
Our preference Short positions below 10515.00 with targets at 10330.00 & 10280.00 in extension.
Alternative scenario Above 10515.00 look for further upside with 10580.00 & 10615.00 as targets.
Comment The RSI is mixed.
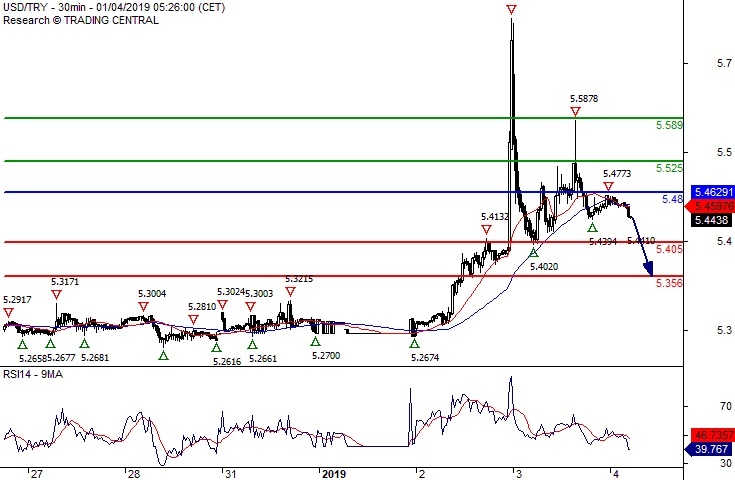
USD/TRY Under Pressure
Pivot (invalidation): 5.4800
Our preference Short positions below 5.4800 with targets at 5.4050 & 5.3560 in extension.
Alternative scenario Above 5.4800 look for further upside with 5.5250 & 5.5890 as targets.
Comment The RSI is bearish and calls for further downside.
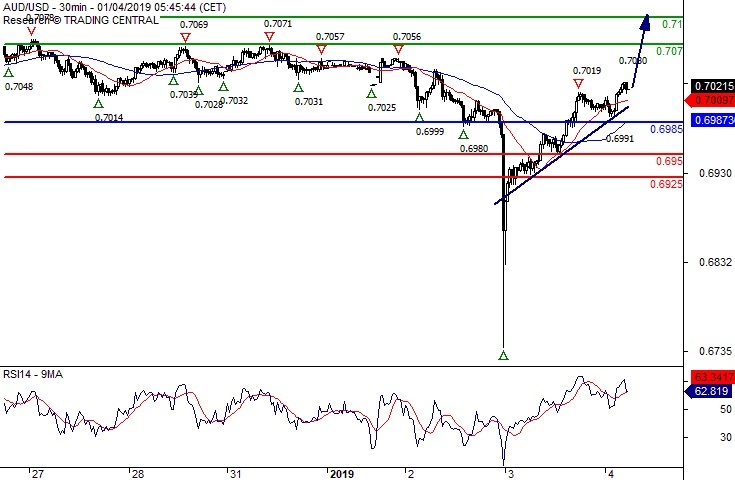
AUD/USD Aim @ 0.7100
Pivot (invalidation): 0.6985
Our preference Long positions above 0.6985 with targets at 0.7070 & 0.7100 in extension.
Alternative scenario Below 0.6985 look for further downside with 0.6950 & 0.6925 as targets.
Comment The RSI calls for a new upleg.
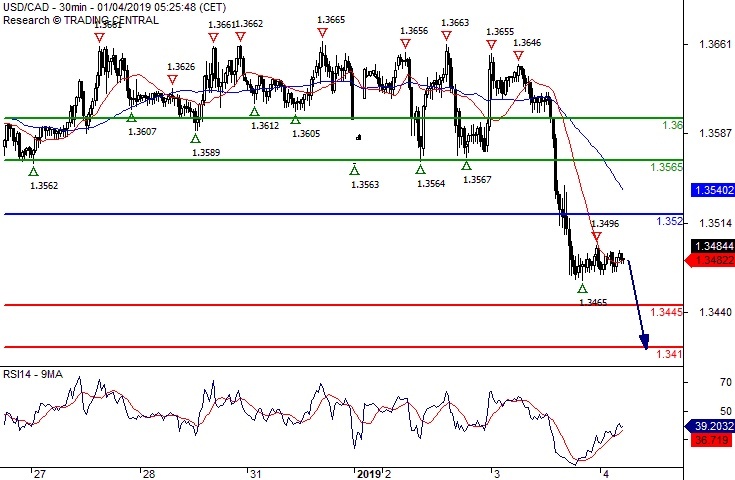
USD/CAD The Downside Prevails
Pivot (invalidation): 1.3520
Our preference Short positions below 1.3520 with targets at 1.3445 & 1.3410 in extension.
Alternative scenario Above 1.3520 look for further upside with 1.3565 & 1.3600 as targets.
Comment The break below 1.3520 is a negative signal that has opened a path to 1.3445.