Sample Category Title
EURUSD 1.1430 Level Is Key For Bulls
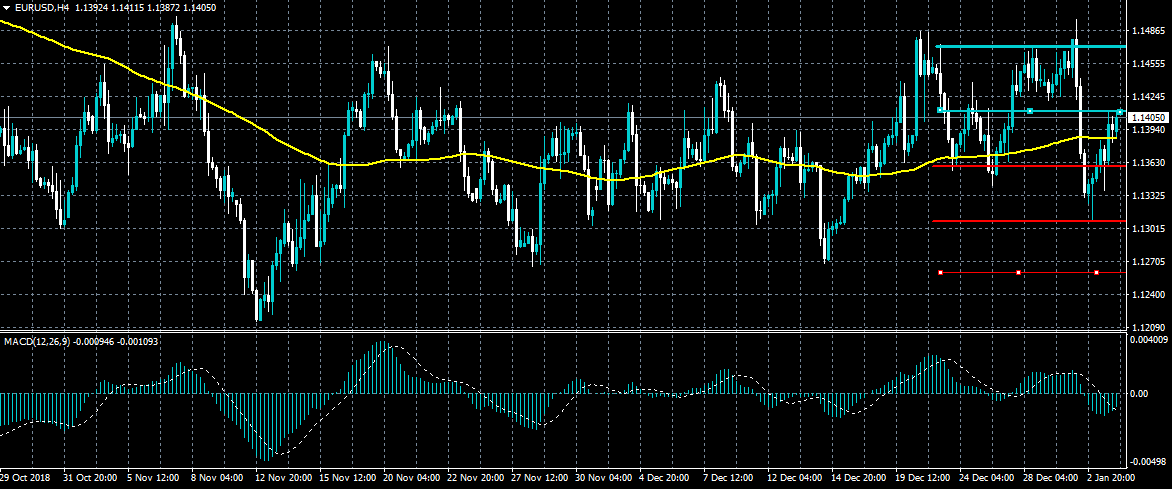
The euro currency has continued to advance higher against the US dollar, with the pair now testing above the 1.1400 resistance level. Bulls now need to break above the pivotal 1.1430 level, in order to encourage further technical buying towards the weekly trading high. To the downside, a strong move under the 1.1360 support level is currently needed for sellers to regain control of price action.
The EURUSD pair is bullish while trading above the 1.1430 level, key technical resistance is found at 1.1470 and 1.1500 levels.
If the EURUSD pair moves under the 1.1360 support level, further losses towards the 1.1300 and 1.1260 levels remain possible.
Reflections On Cryptocurrencies As Bitcoin Turns 10
Ten years ago, the world was still going through the worst financial crisis since the Great Depression. The mighty Lehman Brothers had just collapsed, Bear Stearns was purchased for a pittance and corporate juggernauts like AIG, General Motors, and General Electric were all in trouble. The unemployment rate was rising fast. At the same time, Satoshi Nakamoto was finalizing his white paper on Bitcoin. This week, the cryptocurrency that started it all is turning ten years.
The rise of Bitcoin was fueled by the lack of confidence in official government regulators who had ‘allowed’ the financial crash to happen. At the same time, dark web marketplaces such as Silk Road were rising in prominence. A key problem for these marketplaces, however, was that the money-transfer methods back then were not anonymous and transactions were not encrypted. Bitcoin, the digital currency that allowed anonymous shopping was a blessing for these marketplaces where everything illegal was being sold.
As the popularity of Bitcoin grew, so did its price. In the next decade, the price gained from below $1 to a high of almost $20,000. It also led to the creation of thousands of copycat cryptocurrencies that had a market cap of almost a trillion. The cryptocurrency became an asset class in itself.
A key factor in the cryptocurrency industry is that they have not been widely accepted. Today, no major retailer accepts cryptocurrencies as a means of exchange. This is because traders are concerned about the volatility of the currencies and their security. Initially, a number of companies such as Microsoft did accept the currencies.
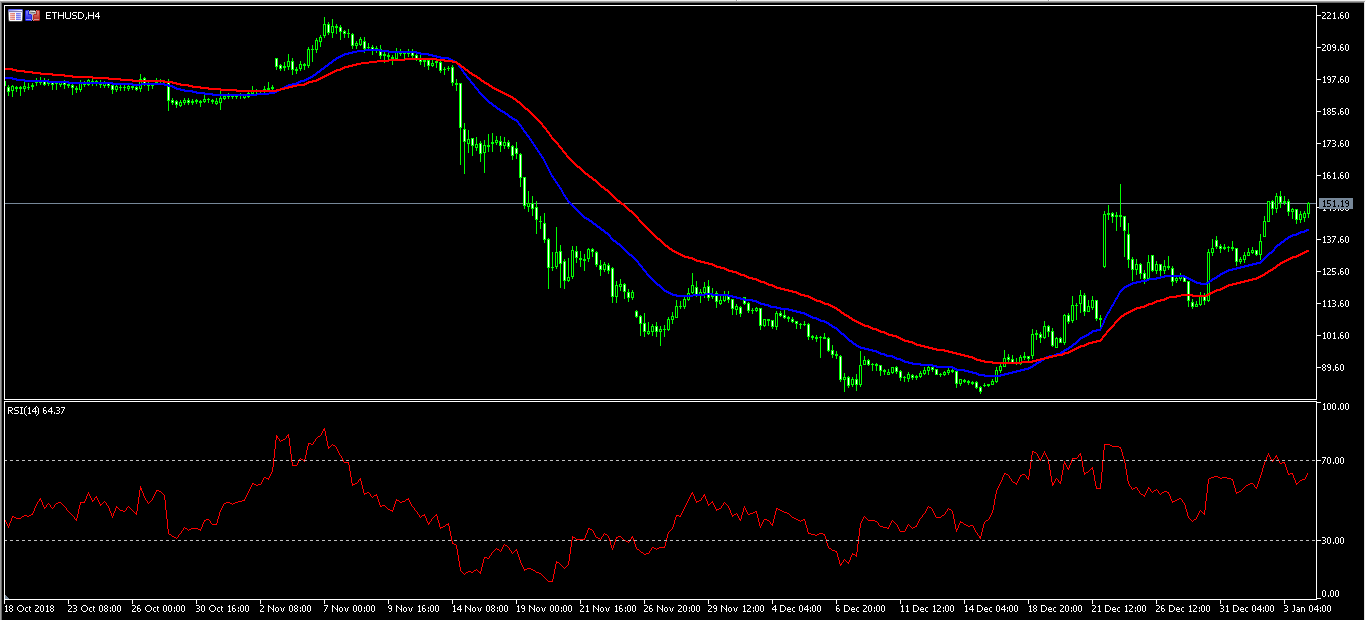
Today, the industry is at a crossroad. While a number of earlier backers are still bullish, the overall sentiment in the market has fallen. This has seen demand decrease, which has in turn led to a sharper decline. For example, Bitcoin is currently trading at $3785, which is more than 70% lower than its peak. The same is true among other cryptocurrencies such as Ethereum, which is trading at $151. On the hourly chart, the ETH price is above the 50-day and 25-day EMA while the RSI has moved almost to the 80 level. This upward trend could continue in the coming days although there is a likelihood that it could also come down.
US Futures Rise Ahead Of NFP Data And Speech Bu Powell
Wall Street declined sharply in yesterday's trading led by Apple's 9% slide. The Dow declined by more than 600 points while the S&P declined by 62 points. This decline came after a letter from Apple's Tim Cook that lowered the previous guidance for the first quarter results. He blamed the decline on the Chinese economy and lower demand. While this was a surprise letter, there were a number of red signs. For example, in the past earnings release, the company said that it would stop releasing the number of devices that it sold. In the Asian session, markets were mixed with China's A50 index gaining by 192 points while Japan's TOPIX declined by 25 points. US futures point to a higher increase today with the Dow gaining by 80 points.
The biggest news today will be the US non-farm payroll numbers. Investors expect the numbers to show that the economy added 178K jobs, up from the November's 155K. The unemployment rate is expected to remain at 3.7% while the manufacturing employment is expected to decline by 20K. Average hourly wages are expected to increase by 0.3% from November's 0.2%. These numbers come a day after ADP released jobs numbers that showed an unexpected increase of 279K people.
Other important news will come from Europe. Investors expect the CPI numbers for the European Union to have remained unchanged at an annual rate of 1.0%. The core CPI that excludes food and key items is expected to move by 1.8%. This will be a point lower than that of November. The PPI for the region is expected to have expanded by 4.1%, which will be lower than the consensus estimate of 4.9%. Data from Canada is expected to show employment numbers. Traders will also listen closely to a speech by Jerome Powell.
EUR/USD
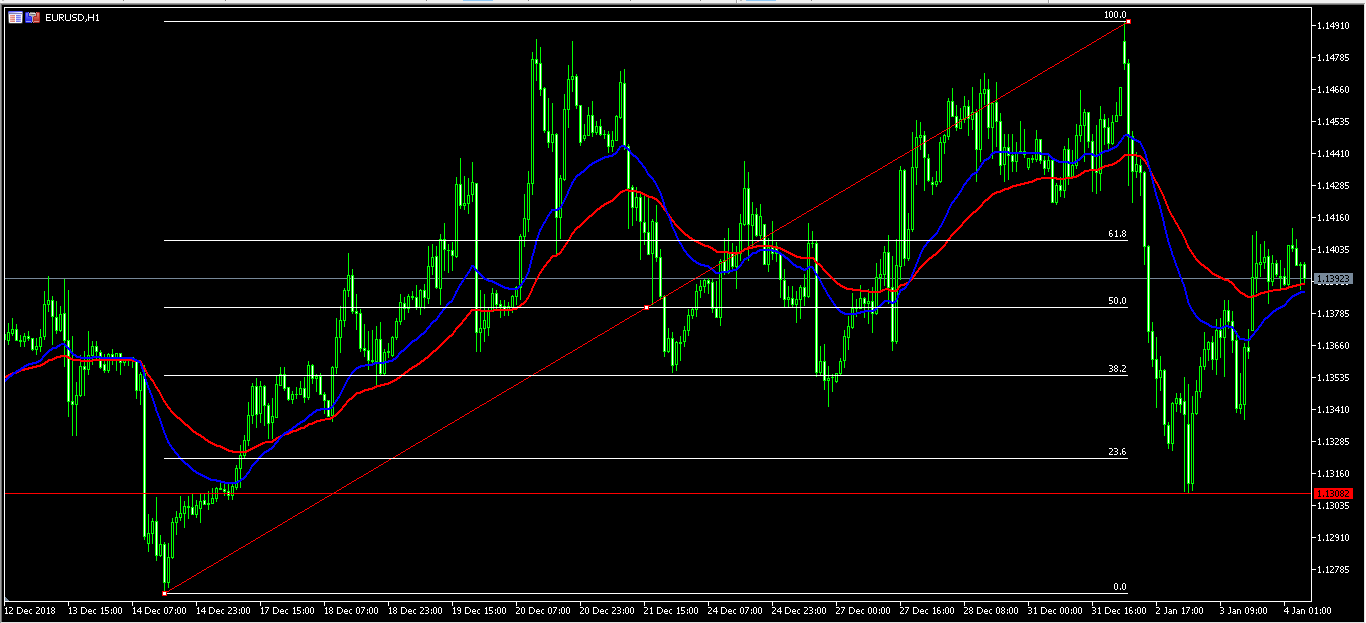
After dropping sharply on Wednesday, the EUR/USD pair recovered to a high of 1.1412. This level was along the 61.8% Fibonacci Retracement level. As of this writing, the pair is trading at 1.1390, which is between the 61.8% and 50% Fibonacci levels. On the hourly chart, the price is along the 50-day and 25-day exponential moving averages (EMA). This will be a key pair to watch today as traders focus on the employment numbers, CPI numbers from the EU, and a speech by Powell.
USD/CAD
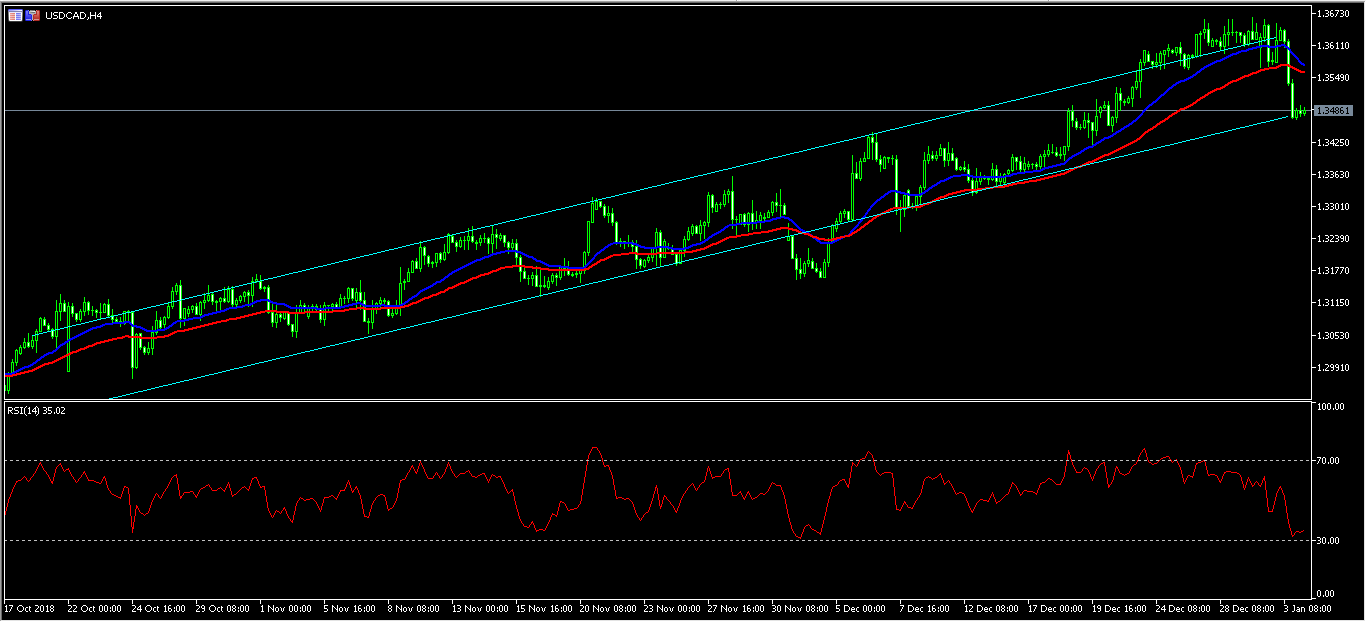
After months of consistent increases, the USD/CAD declined sharply yesterday and landed at a low of 1.3446. As shown below, this level was along the important equidistance channel. It was also below the 50-day and 25-day EMA on the hourly chart. The RSI dropped from the overbought level of 70 to the current 35. Today, this will be an important pair because of US and Canadian data.
XTI/USD
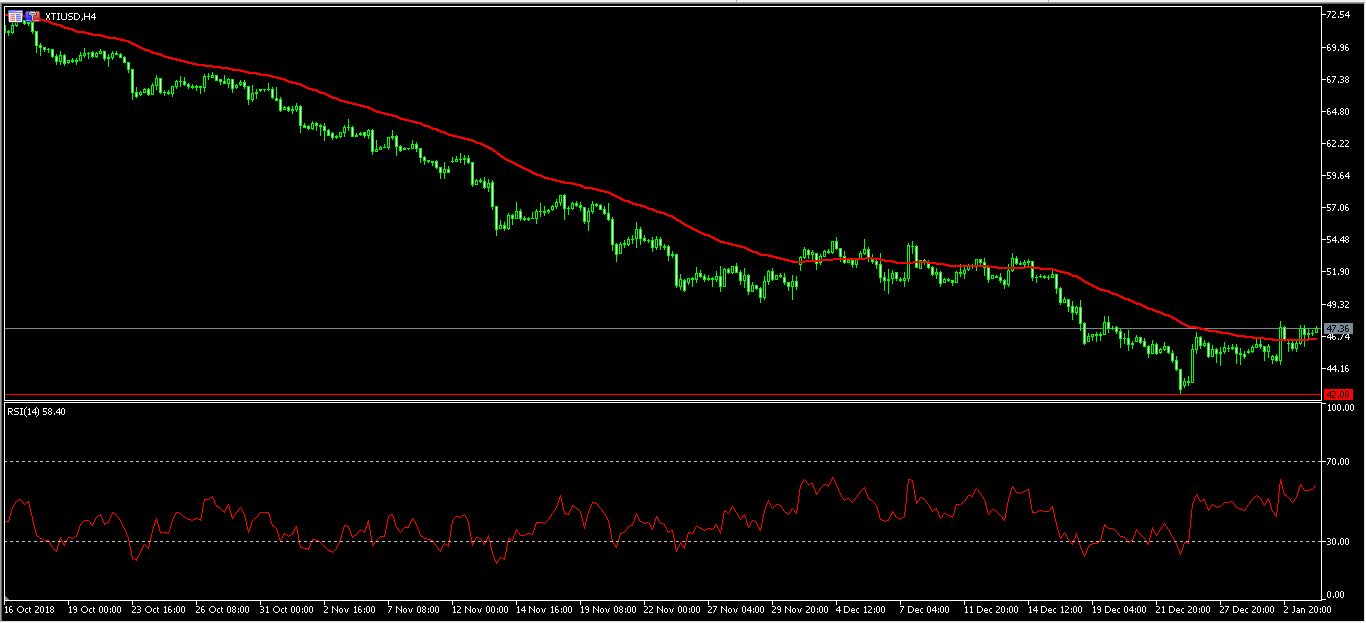
The price of US crude oil has stabilized this year. The XTI/USD pair is trading at 47.26. This is higher than the December low of 42. On the four-hour chart, the price is above the 50-day exponential moving average. Still, the pair is trading near 15-year lows. It is also off by almost 40% since the peak in October. The pair could continue moving higher as sentiment in the market improves.
USDCAD Retreats Below 19-Month High, Tendency Still Bullish
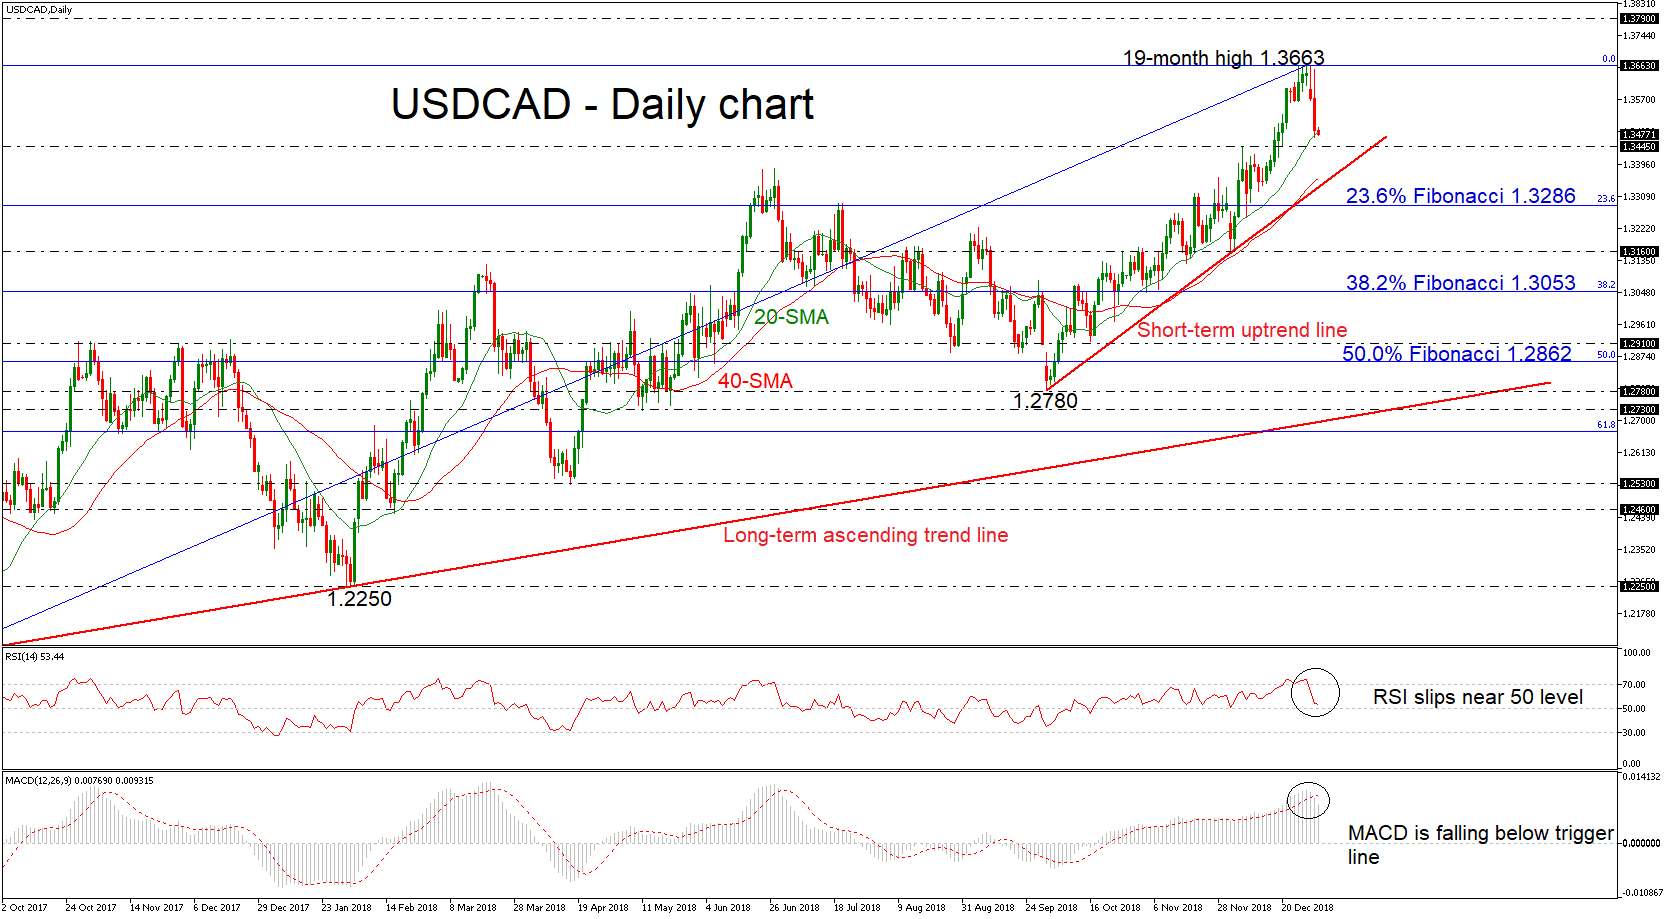
USDCAD changed direction, heading to the downside, in the very short term over the last couple of daily sessions after finding strong resistance on the new 19-month high of 1.3663 last week. However, currently, the price remains above the near-term ascending trend line, which has been in place since October 10 and holds around the 20-day simple moving average (SMA).
The technical indicators are still located in bullish area, with the MACD is slipping below its red signal line and the RSI is approaching the neutral area with strong momentum. Both are suggesting that the upside rally may be overdone, and negative corrections are taking place.
More negative movements could send prices towards the immediate support zone around 1.3445 before challenging the short-term uptrend line around 1.3355, which stands near the 40-day SMA. Moving lower, the focus would shift to the 23.6% Fibonacci retracement level of the upleg from 1.2060 to 1.3663 near 1.3286. A penetration of the diagonal line could turn the upside tendency to a more bearish one turning the attention to the 1.3160 support.
On the other side, the market could rebound on the 20-day SMA and send prices until the multi-month high of 1.3663. If bullish forces appear even stronger, 1.3790 should be another resistance to keep in mind.
Overall, in the bigger view, USDCAD has been trading in an ascending movement since September 2017 following the bounce off the bottom of 1.2060.
Currencies: Dollar To Ease On ‘Softer’ Powell?
- Rates: Room for profit taking on stretched core bond rally?
US Treasuries significantly outperform Bunds in US dealings yesterday following a huge negative surprise of the manufacturing ISM and as stock markets lost up to 3%. Risk sentiment improved overnight on trade developments. Together with an expected strong payrolls report, it could provide the setting for some profit taking on the stretched core bond rally. - Currencies: Dollar to ease on 'softer' Powell?
FX markets were looking for a new equilibrium yesterday after the early morning 'flash crash'/yen rally. Later in the session, the dollar declined further as a poor ISM reinforced investor concerns on US growth. Today, the focus for USD trading will be on the US payrolls and on an interview of Fed's Powell. The combination of an easing in the risk-off trade and a 'softer' Powell might weigh on the dollar.
The Sunrise Headlines
- US equities dropped heavily yesterday with losses up to 3% after Apple's revenue warning and a disappointing ISM. Asian equities are trading mixed, with China outperforming on new trade hopes.
- The US and China confirmed to hold trade talks on Monday. A US delegation, led by Deputy Trade Representative Jeffrey Gerrish, will visit Beijing for a first face-to-face negotiation since both countries agreed to a 90-day truce.
- The US House of Representatives, now lead by Democrats, passed funding bills yesterday aimed to end the partial shutdown of the government. US President Trump already signalled to veto the bills as it doesn't include wall funding.
- Italy is weighing its options to rescue the latest endangered lender, Banca Carige, to shield small savers and taxpayers from losses. A larger bank to take over Carige or a capital increase are the options currently under consideration.
- China's Caixin PMI Services increased modestly in December to 53.9, up from 53.8. The Composite PMI rose to 52.2, up from 51.9 in November. Meanwhile, the Chinese government continues to support small business financing.
- Ireland booked its first surplus in 2018 since the economic crisis in 2008. PM Varadkar said they are now well-prepared for a no-deal Brexit. However, the surplus mainly depends on corporate tax receipts from multinationals.
- Today's economic calendar contains US Payrolls, Average Hourly Earnings and the Unemployment Rate, while for the EMU we receive inflation data. Ex-Fed giants Yellen, Bernanke and current chair Powell speak
Currencies: Dollar To Ease On 'Softer' Powell?
Dollar the ease on more dovish tone from Powell?
FX markets were looking for a new equilibrium in the wake of the sharp rally of the yen early in Asia yesterday. The yen gradually reversed part of the gain acquired during the FX flash crash. Risk sentiment remained fragile but initially core/US yields stabilized after the recent decline. USD showed no clear direction. US data were mixed with strong ADP private job growth, but the manufacturing ISM tumbled sharply from 59.3 to 54.1 and rekindled investor fears on US/global growth. US yields, equities and the USD started a new downleg. EUR/USD rebounded to the 1.14 area. Remarkably, USD/JPY held rather 'strong' despite a further decline in US interest rates and equities. EUR/USD finished the day at 1.1394. USD/JPY rebounded after the flash-crash to close the day at 107.68 (from 108.88). Overnight, Asian equities show a mixed picture. Japan shows losses of 1.50%/2.25% as they return from the New Year holidays, but the Japan manufacturing PMI (52.6) wasn't too bad. The Chinese Caixan services/composite PMI's also surprise on the upside, easing growth fears. Chinese equities are rebounding. EUR/USD stabilizes just below 1.14. USD/JPY (108.15 area) gains a few ticks as the risk-off trade is losing some traction. Later today, the final EMU PMI's, EMU inflation and German labour data will be published. Inflation will probably be soft, but the impact on the euro might be modest. In the US, the payrolls take centre stage. Solid job growth (184K) is expected. However, labour data are a lagging indicator. So, the impact might be less than e.g. of the ISM's. There is probably also an asymmetrical risk with the dollar more sensitive to a negative rather than to a positive surprise. Last but not least, markets will keenly monitor a scheduled interview of Fed's Powell together with his predecessors Yellen and Bernanke. Some dovish concessions (data dependence and taking into account financial conditions) might weigh on the dollar. EUR/USD recently held in the 1.12/15 consolidation pattern. EMU and US data might be mixed, but we continue to see modest downside risk for the dollar in case of an easing of the risk-off trade or in case of some 'soft' concessions of Fed's Powell. EUR/USD might drift a bit further north.
Sterling was mainly driven by technical considerations yesterday. EUR/GBP returned back to the low 0.90 area after an initial spike higher due to the flash crash. We expect more wait-and-see trading. The UK services PMI proably will only be of intraday significance. A less negative risk context might be slightly GBP-supportive.
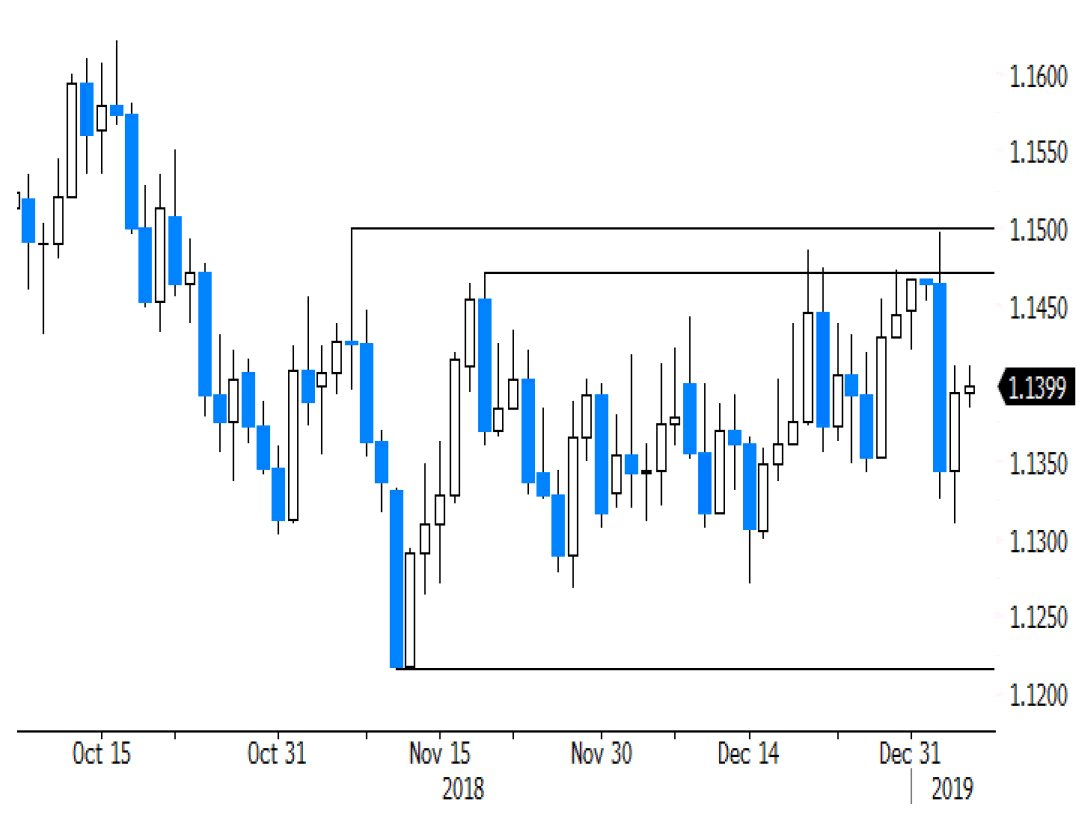
EUR/USD: drifting higher in the 1.12/1.15 trading range
GBP/JPY Daily Outlook
Daily Pivots: (S1) 132.88; (P) 135.09; (R1) 138.26; More...
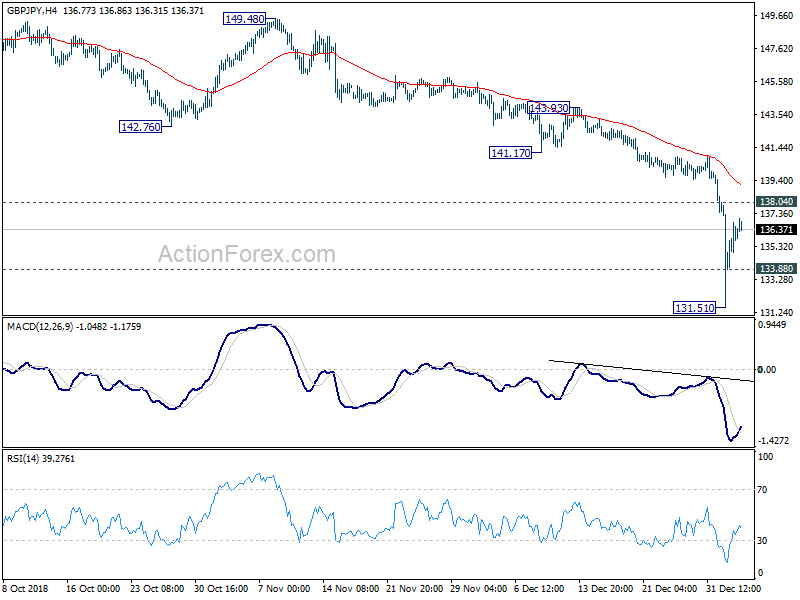
Intraday bias in GBP/JPY is neutral for some consolidations. But upside should be limited by 138.04 resistance to bring fall resumption. Below 133.88 minor support will turn bias to the downside for 131.51 low first. Break will pave the way back to 122.36 (2016 low). Nevertheless, touching of 138.04 will confirm short term bottoming and bring lengthier consolidation first, before staging another fall.
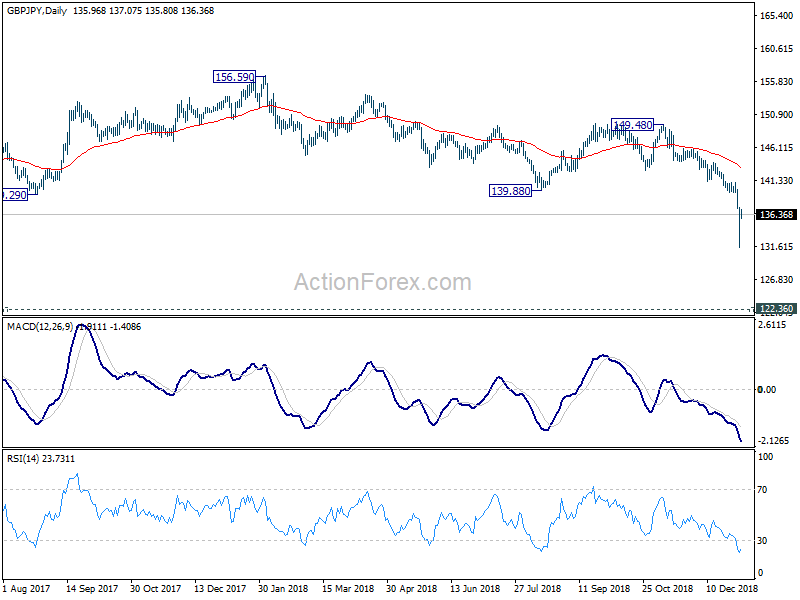
In the bigger picture, corrective medium term rise from 122.36 (2016 low) has completed at 156.69 already. That came after failing to break through 55 month EMA. Fall from 156.69 (2018 high) is seen as resuming the long term down trend from 195.86 (2015 high). Break of 122.36 will target 116.83 low first (2011 low). And this will now remain the preferred case as long as 139.88 support turned resistance holds.
EUR/JPY Daily Outlook
Daily Pivots: (S1) 119.82; (P) 121.75; (R1) 124.59; More....
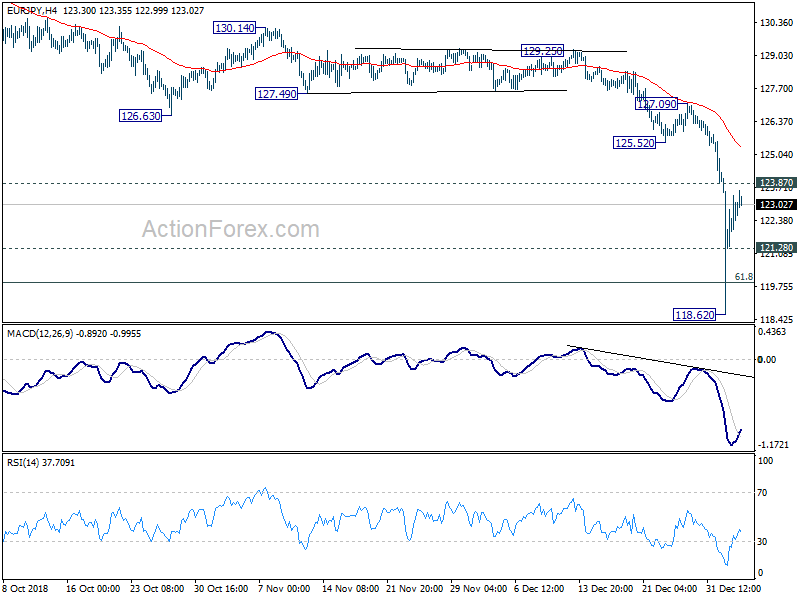
Intraday bias in EUR/JPY stays neutral for some consolidations first. But near term outlook remains bearish with 123.87 resistance intact. On the downside, below 121.28 minor support will turn bias back to the downside for 118.62 first. Break will extend the larger down trend to next projection level at 112.28. Nevertheless, on the upside, touching of 123.87 will indicate short term bottoming and bring lengthier consolidation before staging another fall.
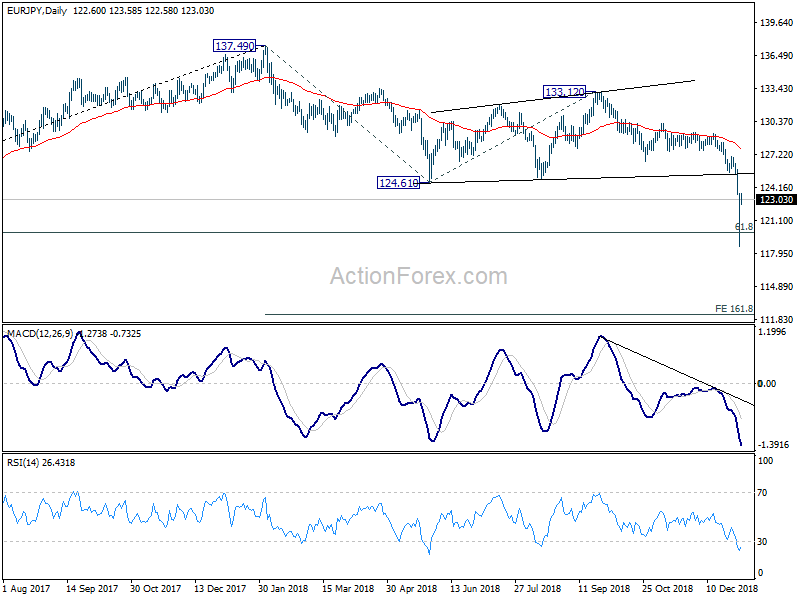
In the bigger picture, the strong break of 124.08 key support suggests that medium term rebound from 109.03 (2016 low) has completed at 137.49 already, with corrective structure. Fall from 137.39 is seen as a medium term fall, resuming the decline from 149.76 (2014 high). Such decline should break through 109.03 low next. This will remain the preferred case as long as 124.61 support turned resistance holds.
EUR/GBP Daily Outlook
Daily Pivots: (S1) 0.8971; (P) 0.9041; (R1) 0.9087; More...
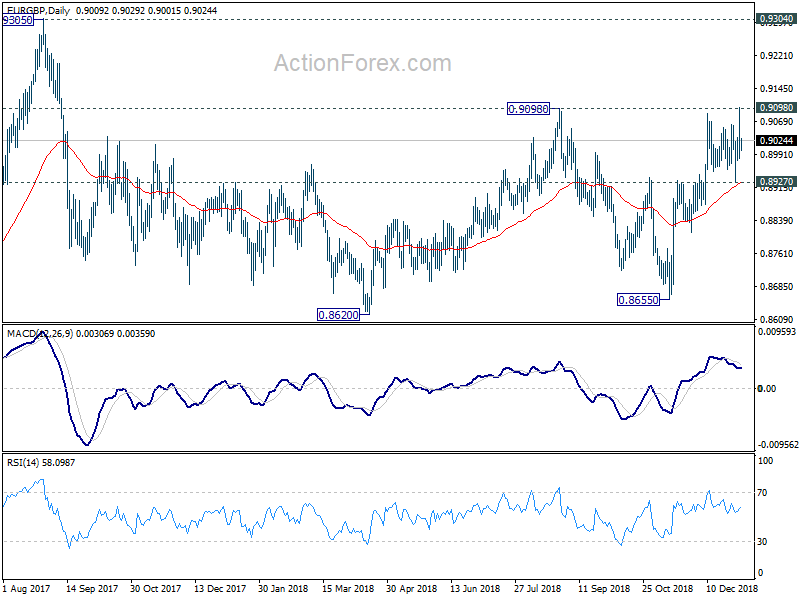
Intraday bias in EUR/GBP remains neutral at this point. On the upside, firm break of 0.9098 resistance will extend the whole rise from 0.8655 to 0.9304 key resistance next. In any case, near term outlook will remain bullish as long as 0.8927 support holds.
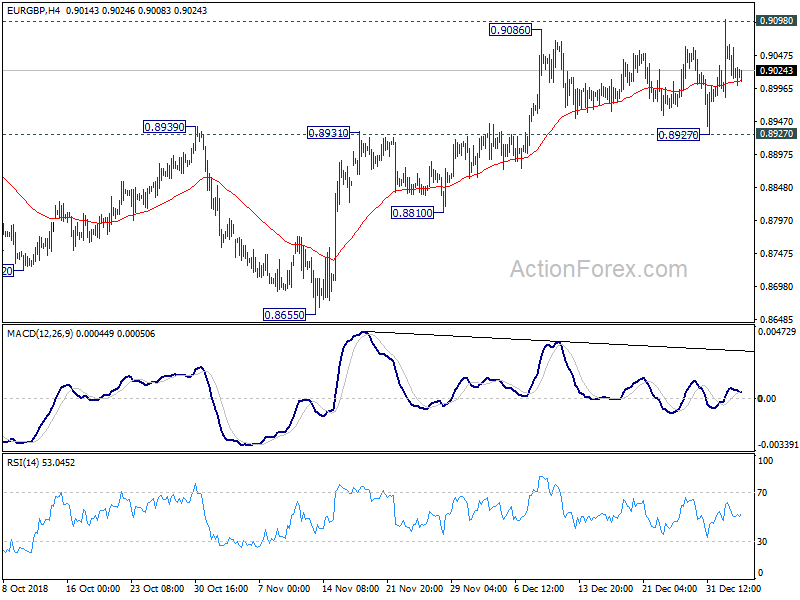
In the bigger picture, EUR/GBP is seen as staying in long term range pattern started at 0.9304 (2016 high). It should be in medium term rising leg for 0.9304. Meanwhile, in case of another fall, down side should be contained by 0.8620/55 support zone to bring rebound.
EUR/AUD Daily Outlook
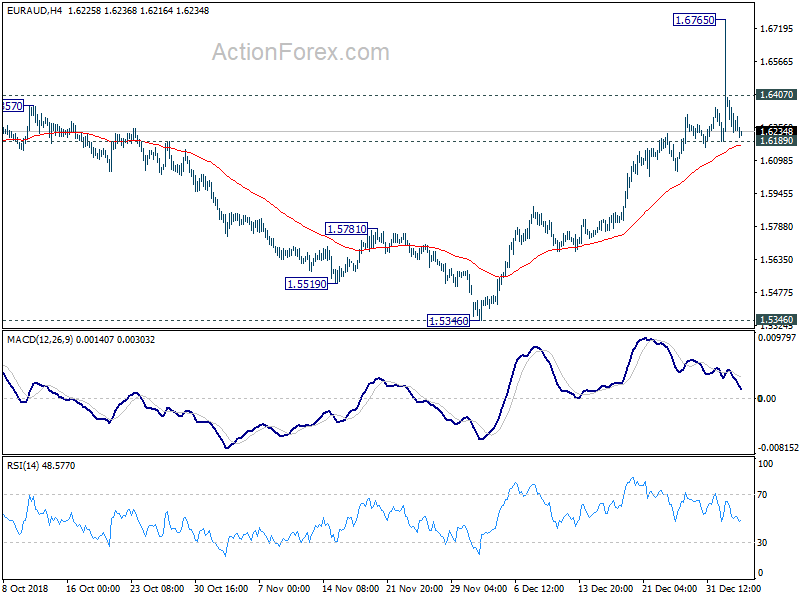
Daily Pivots: (S1) 1.6091; (P) 1.6406; (R1) 1.6581; More....
Intraday bias in EUR/AUD is neutral for consolidations. As long as 1.6189 support holds, further rise is still expected. Above 1.6407 minor resistance will turn bias back to the upside for 1.6765 resistance first. However, break of 1.6189 will indicate short term topping and bring lengthier consolidation before staging another rally.
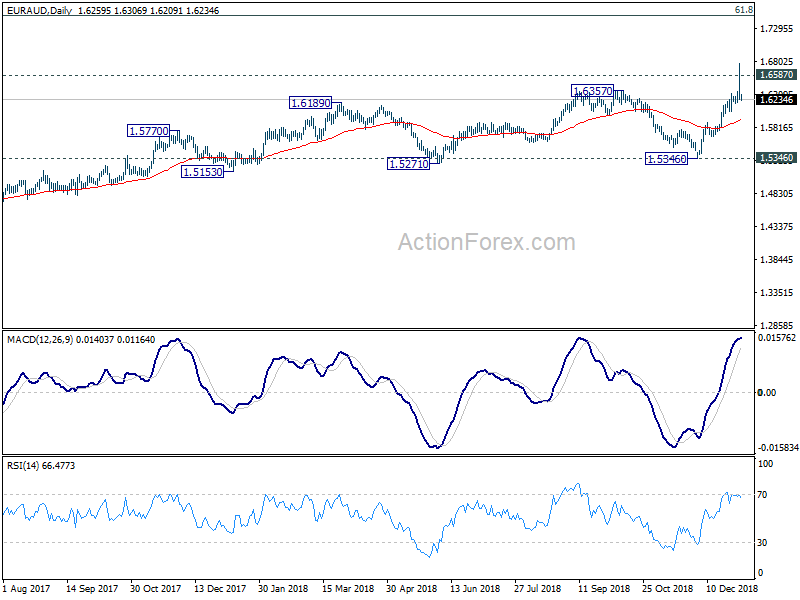
In the bigger picture, medium term rise from 1.3624 (2017 low) should be resuming. Such rise is part of the up trend from 1.1602 (2012 low). Sustained break of 1.6587 will target 61.8% retracement of 2.1127 (2008 high) to 1.1602 at 1.7550. For now, in any case, medium term outlook will stay bullish as long as 1.5346 support holds, even in case of deeper pull back.
EUR/USD: Bearish Pullback Challenges 61.8% Fib At 1.1350
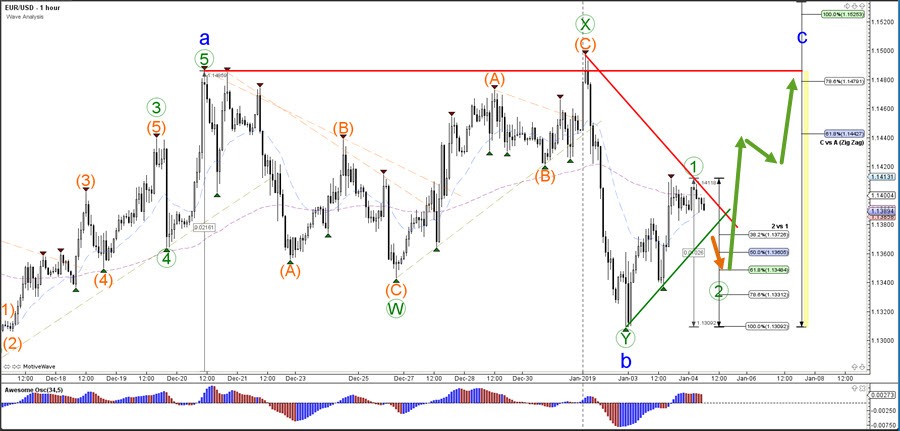
The EUR/USD has bounced at the support trend line (blue), which might complete a wave B (blue) correction. If price manages to stay above the support zone (blue), then price might eventually move up as part of a wave C (blue) towards the Fibonacci targets.
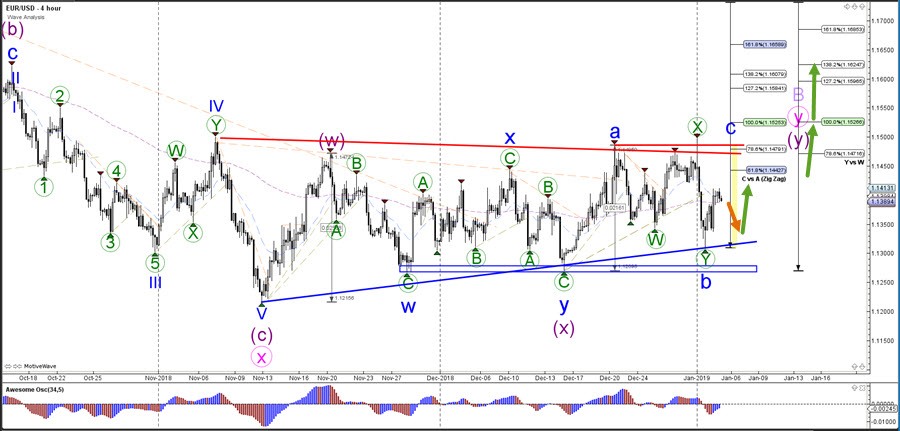
The EUR/USD bearish momentum could have completed a wave B (blue) if price manages to stay above the 100% Fibonacci level of wave 2 vs 1. A bullish bounce at the Fibonacci levels could confirm the development of a wave 2 (green) whereas a break above the resistance trend line (red) indicates a potential wave3 (green).