

Sample Category Title
Chinese stocks rebound as Premier Li pledged to step up countercyclical measures
Stocks in China and Hong Kong buck the global trade and rebounds notably today. At the time of writing, China Shanghai SSE is up 1.35%. Hong Kong HSI is up 1.34%.
Sentiments are apparent lifted by news that the Chinese government is going to provide more stimulus to the economy. The State Council noted in a brief statement in its website that Premier Li Keqiang pledged to step up "countercyclical adjustments" of macro policies.
The comments were made when Li at a meeting with officials of the country's banking and insurance regulator after visiting Bank of China, Industrial and Commercial Bank of China and China Construction Bank. Measures will include tax cuts, targeted lowering of reserve requirements to help small and private companies.
Crude Oil: Oil Trading Higher, Ahead Of EIA’s Weekly Crude Oil Inventories Data And Baker Hughes Weekly Rig Count
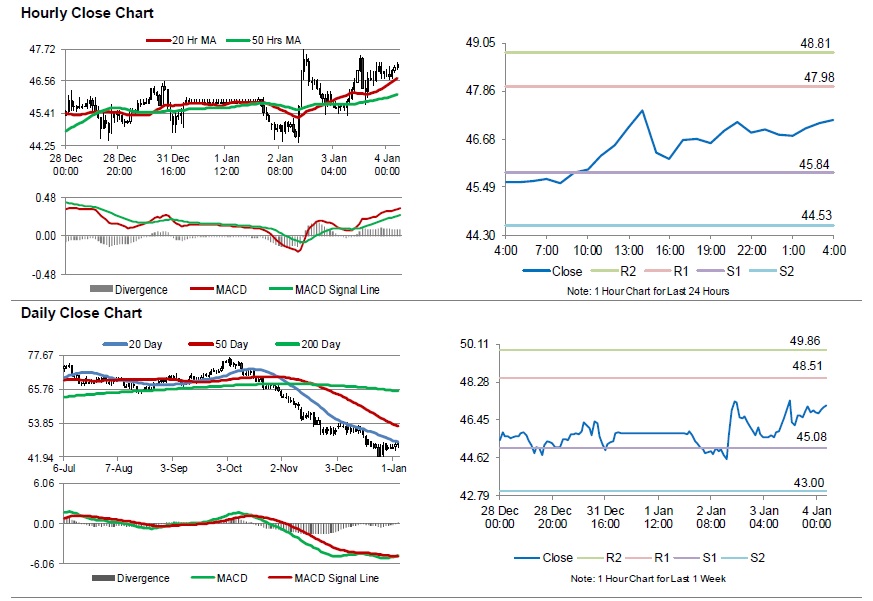
For the 24 hours to 23:00 GMT, Crude Oil rose 2.58% against the USD and closed at USD46.91 per barrel, after the American Petroleum Institute (API) reported that US crude oil inventories fell by 4.5 million barrels to 443.7 million barrels in the week ended 28 December.
In the Asian session, at GMT0400, the pair is trading at 47.16, with oil trading 0.53% higher against the USD from yesterday's close.
The pair is expected to find support at 45.84, and a fall through could take it to the next support level of 44.53. The pair is expected to find its first resistance at 47.98, and a rise through could take it to the next resistance level of 48.81.
Crude oil is trading above its 20 Hr and 50 Hr moving averages.
AUD/USD And NZD/USD Approaching Crucial Resistance
AUD/USD fell significantly and declined below the 0.6800 support, but later recovered nicely above 0.6940. NZD/USD also declined heavily before buyers appeared near the 0.6580 support.
Important Takeaways for AUD/USD and NZD/USD
- The Aussie Dollar fell heavily below 0.6900 and 0.6800 before buyers appeared near 0.6740 against the US Dollar.
- There was a break above a key bearish trend line with resistance at 0.6955 on the hourly chart of AUD/USD.
- NZD/USD tested the 0.6580 support area and later bounced back above 0.6610.
- There is a major bearish trend line formed with resistance at 0.6710 on the hourly chart.
AUD/USD Technical Analysis
The new year opening was super bullish for the US Dollar, resulting in a sharp decline below the 0.7000 support in the Aussie Dollar against the US Dollar. The AUD/USD pair declined below the 0.6900 and 0.6800 support levels.
The pair even broke the 0.6750 support and settled below the 50 hourly simple moving average. A low was formed at 0.6733 on FXOpen and later the pair started a solid upward move.
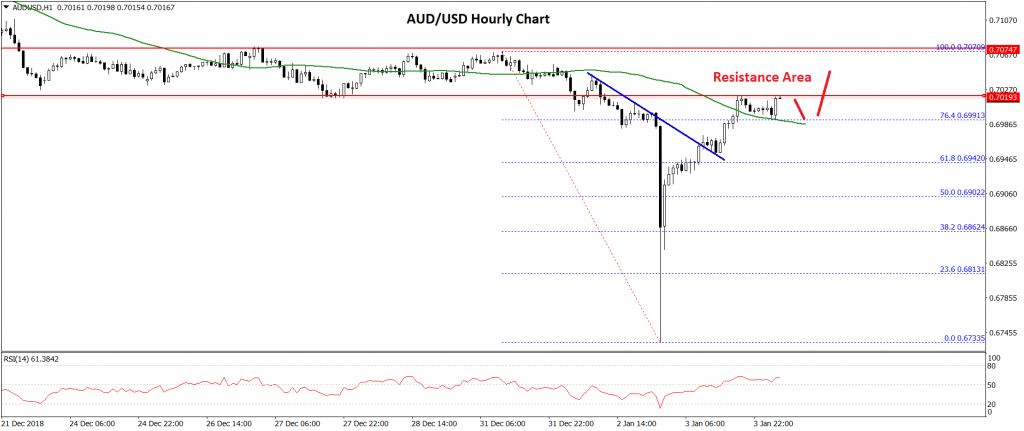
Buyers pushed the price above the 0.6800 and 0.6900 resistance levels. There was also a break above the 50% Fib retracement level of the recent decline from the 0.7070 high to 0.6733 low.
Besides, there was a break above a key bearish trend line with resistance at 0.6955 on the hourly chart of AUD/USD. The recovery was strong as there was a break above the 0.6950 resistance and the 61.8% Fib retracement level of the recent decline from the 0.7070 high to 0.6733 low.
Should there be a proper close above the 0.7000 and 0.7025 resistance levels, there could be more gains towards the 0.7070 level.
On the downside, an initial support is near the 0.6900 level, below which the pair may move back in a bearish zone towards the 0.6850 and 0.6820 support levels in the near term.
NZD/USD Technical Analysis
The New Zealand Dollar also declined sharply and broke the 0.6700 and 0.6650 support levels against the US Dollar. The NZD/USD pair even cleared the 0.6600 support and settled below the 50 hourly simple moving average.
A low was formed at 0.6585 and later the pair recovered sharply. It broke the 0.6640 resistance and the 50% Fib retracement level of the recent decline from the 0.6724 high to 0.6585 low.
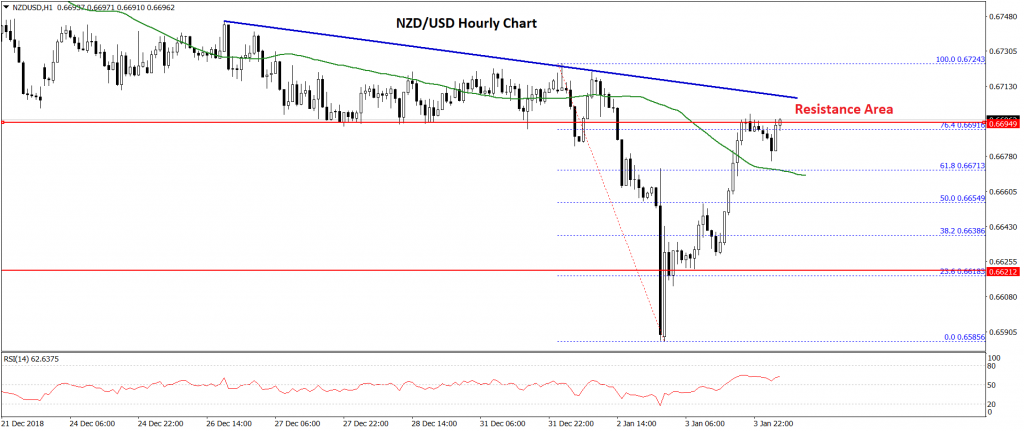
The pair is currently trading with a positive bias, but there is a strong resistance waiting near the 0.6700 level. Moreover, there is a major bearish trend line formed with resistance at 0.6710 on the hourly chart.
Finally, the 76.4% Fib retracement level of the recent decline from the 0.6724 high to 0.6585 low is also near the 0.6690 level to prevent more gains. Therefore, buyers need to push the pair above the 0.6690 and 0.6700 resistance levels to initiate a decent upward move.
On the downside, an initial support is placed near the 0.6620 level, below which the NZD/USD pair could decline towards the 0.6600 support area. Any further gains will most likely set the pace for a fresh low below the 0.6585 in the near term.
64% UK Conservatives prefer no-deal Brexit to May’s deal
According to a survey by YouGov funded by Economic and Social Research Council, many more Conservative Party members opposed to Prime Minister Theresa May's Brexit deal than supported it.
The survey was conducted Dec 17-22, on 1215 Tories. 59% percent opposed May's deal while only 38% were in favor. If there is another referendum, 64% would opt for no-deal Brexit while 29% would pick May's agreement.
Only 11% thought the Irish backstop made sense. 23% thought it's a bad idea but worth to be included to secure the deal. 40% rejected the backstop arrangement.
China MOFCOM confirmed trade meeting with US in Beijing on Jan 7-8
China's Ministry of Commerce confirmed in a brief statement that there will be US-China vice ministerial level trade talks in Beijing on Jan 7-8. The date is confirmed in a phone call today. There will be "positive and constructive discussions" in following up to the agreement of Xi and Trump in Argentina. Deputy U.S. Trade Representative Jeffrey Gerrish will lead the team on the US side.
No further detail is provided at this point.
China PMI services rose to 53.9, employment gauge slipped further into negative territory
China Caixin PMI services rose to 53.9 in December, up from 53.8 and beat expectation of 53.1. PMI composite also rose from 51.9 to five-month high of 52.2.
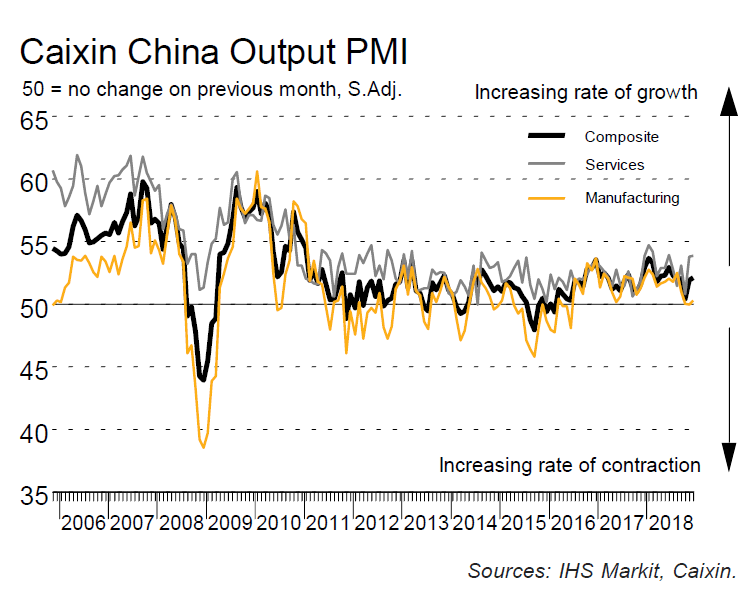
Commenting on the China General Services PMI™ data, Dr. Zhengsheng Zhong, Director of Macroeconomic Analysis at CEBM Group said: "The Caixin China General Services Business Activity Index rose to 53.9 in December after a big jump the previous month.
"Among the gauges included in the survey, the one for new business dipped slightly in December after a rebound the month before, suggesting steady demand across the services sector. The employment measure stayed in positive territory but edged down further, indicating that the employment absorption capacity of the services industry weakened mildly. The gauges for prices charged by service providers and input costs both edged up. The measure for business expectations also rose, reflecting service providers' strengthening confidence in their prospects.
"The Caixin China Composite Output Index picked up marginally to 52.2 in December, reflecting easing downward pressure on China's economic growth.
"Although the index for new export business rose, the one for overall new orders dropped, reflecting weakening domestic demand. The employment gauge slipped further into negative territory, implying increasing challenges to stabilizing employment, which was the broader context of December's central government policies to increase jobs. The gauges for input costs and output charges continued to drop, pointing to easing inflationary pressures. The measure for future output, which reflects business confidence, edged up marginally, although it remained on a downtrend."
Japan PMI manufacturing: Demand pressures relatively subdued
Japan PMI manufacturing is finalized at 52.6 in December, up from November's 15-month low of 52.2. Markit noted "solid output expansion on average over Q4, but demand pressures remain subdued". Also, "business optimism at lowest since November 2016"
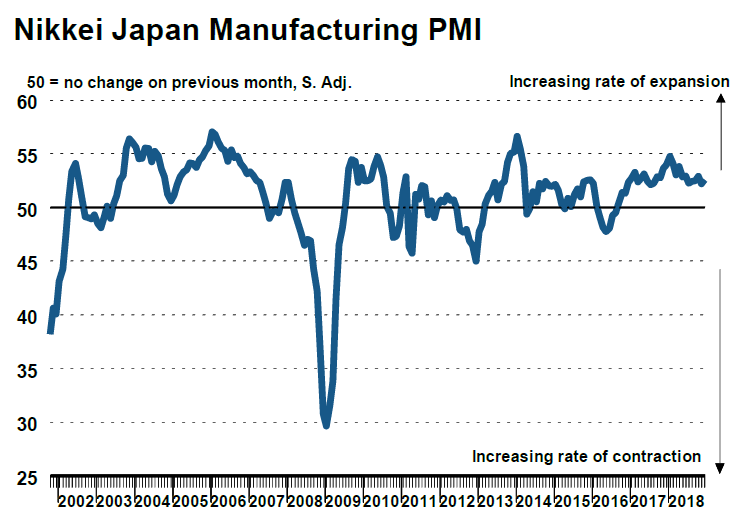
Commenting on the Japanese Manufacturing PMI survey data, Joe Hayes, Economist at IHS Markit, which compiles the survey, said:
"The final print of the December Manufacturing PMI showed that Japan's goods-producing economy looks set to contribute to a bounce-back in GDP growth for Q4. Output increased at the strongest rate since April last year, while new order growth also improved.
"Nonetheless, the survey data provide reason to remain cautious on growth prospects. Most notably, demand pressures were relatively subdued. Exports also declined on the month amid reports of sluggish sales to Europe and China. The fall in confidence, the seventh time this has been the case in as many months, also suggests that companies are becoming increasingly less bullish on the year-ahead outlook. With the sales tax increase set to come into play, fears over the durability of demand conditions are worrying."
Japan MoF to monitor FX closely after flash crash, BoJ may downgrade inflation outlook
After yesterday's spike in Yen, Masatsugu Asakawa, Japan's Vice Finance Minister for International Affairs, said the ministry will "monitor the situation for speculative moves in the foreign exchange market." He noted that "volatility remains quite high high during Sydney trading." And, "currency markets are trading in extremely thin liquidity, exacerbating price movements." For for now, the MoF is not considering to call a meeting with the BoJ on the issue yet.
Talking about the BoJ, Nikkei Asian review reported that BoJ board is considering to lower inflation outlook again due to lower oil prices. For fiscal 2019, core inflation forecast could be lowered to 1%, down from October projection of 1.4%. For fiscal 2020, however, there might be just slight revision to current forecast of 1.5%.
Market Morning Briefing: Aussie Has Important Weekly Support At 0.70
STOCKS
Overall, Global indices have all seen a bit of fall over the last couple of days, but the Eastern hemisphere could be nearing Supports, readying for a bounce.
Contrary to expectation of a rise to 24000, the Dow Jones(22686.22, -660.02, -2.38%) has fallen from near 23400 itself, pushed down by the 21-MA on daily line chart at 23457 and pulled down by the nasty drop in Apple. Some more dip towards 22000 is likely in the near term, which might/ might not turn out to be an important/strong Support.
The Dax (10416.66, -163.53, -1.55%) too fell yesterday. Important Support seen near 10300. That needs to hold to trigger a bounce towards 10900. Else, a break thereof could push could push the Dow down towards 10000 in the medium term.
Nikkei(19407.40, -607.37, -3.03%) plays catch up with the rest of the market, opening lower. But it possibly has a strong Support near the current level on the Weekly Line chart.
Shanghai(2483, +0.73%) dipped below 2450 to a low of 2440, but has moved back up, possibly on good hopes of a US-China resolution. In any case, we note that 2450-00 is a strong long-term Support.
Although the Sensex (35513.71,-1.05%) & Nifty (10672.25, -120.25, -1.11%) saw a dip yesterday, they have Supports coming up at 35250 and 10600 respectively, which could potentially produce a bounce.
COMMODITIES
Precious metals are trading higher and could rise for a couple of more sessions before hitting respective resistances. Copper continues to trade in the Red while Crude prices are attempting to move higher and looks bullish for the near term.
The US government plans to release its weekly oil and product inventory report today (2 days later than normal) because of the New Year’s holiday.
Brent (55.89) and Nymex WTI (47.12) are trading at resistance levels on the daily candles. A break above 56 and 48 respectively is required to turn bullish towards 58 and 50 respectively for the near term. For now, we watch price action near current levels and if the crude prices manage to break above immediate trend resistances.
Gold (1298.90) has risen sharply and is almost to test immediate resistance zone of 1300-1320 from where a short corrective dip is possible in the near term towards 1270. Above 1320, there is scope for a rise towards 1350 as seen on the weekly line charts. Near term looks bullish while the US Dollar does not seem to be impacted and remains ranged.
Silver (15.89) is trading higher as well, breaking above the immediate resistance on the 3-day chart. Note that 16.50 is a decent resistance on the weekly candles and may hold, pushing the price back towards 15within the corrective dip.
Copper (2.5810) has some hope of taking support at 2.55 and bouncing back towards 2.60 and higher but if the price fails to sustain above 2.55, it could turn further bearish towards 2.50. The fall came in after the Apple sales forecast was cut owing to decrease in Chinese demand and lower China manufacturing PMI came in for Dec’18.
FOREX
Currencies that saw a flash crash yesterday have recovered a bit but could again turn bearish in the longer run. We could see some weakness in the major currencies while the US Dollar may strengthen a bit in the near term. Yen, Aussie, Pound and Rupee continue to remain volatile. Weakness in Copper is a concern for weakness in Aussie and other commodity-currencies for the near term as continued fall in Copper could make them bearish.
Dollar Index (96.27) is trading lower and has scope of re-testing 95.75-95.60 on the downside. Overall broad down-channel is holding on the daily candles within 97.25-95.50 in the near term. View remains bearish while below 97.25.
Euro (1.14) has bounced from 1.13 as expected and could be headed towards 1.1450-1.1500 in the next few sessions.
Dollar Yen (108.02) has recovered a bit after the sharp fall seen yesterday. Yesterday’s low near 104.78 has been the Mar’18 low and could hold as a strong support as seen on the 3-day candle chart. While above 108, the currency pair could again head back towards 110.0-110.5 levels. Also see immediate trend support on the 3-day and weekly line charts. A fall below 108-107 levels if seen could make it bearish in the medium to long term (less preferred).
Euro-Yen (123.17) could head towards 125.20 in the near term. Thereafter, if there is a rise above 125.20, we may turn bullish towards 128; else a fall from 125.20 could make it vulnerable to another fall towards 122.80-122.00 levels in the longer run.
Pound (1.2638) is trading in the middle of the channel down trend on the daily chart. While near term could see a rise towards resistance at 1.2700-1.2750, a dip back towards 1.25 is possible thereafter in the medium term. Near term could be bullish while long term looks bearish.
Aussie (0.7021) has important weekly support at 0.70 just now and lower support at 0.69-0.6850 which could be tested in the medium term before a bounce back towards 0.71 or higher is seen. A rise above 0.71 if seen next week could turn the currency bullish towards 0.73 by the end of this month. Fall in copper prices if seen could turn bearish for Aussie in the near term.
Dollar Rupee (70.20) came off to test 70 yesterday before closing the session at slightly higher levels. Resistance mentioned near 70.30/40 seems to have held well and while that continues to hold, we could possible see trade within 70.40-69.90 today followed by a dip below 70 next week. A break above 70.40, if seen could take it higher towards 70.60.
INTEREST RATES
Sharp fall in US yields, as the fall in US stocks possibly drives money into Bonds. Importantly, the US 5Yr (2.38%, down from 2.46%) could be breaking below the important support at 2.40%, coming up from 2016, that was mentioned yesterday.
The market, it is reported, is now pricing in a rate cut in 2019, a sharp reversal from the prospect of a 50 bp hike. It is quite possible that the positions of the Market and the Fed are a little extremes and the ultimate reality may lie somewhere in the middle.
In India, the 10Yr GOI moved back up to 7.4257% (up from 7.3546%) yesterday, but we still look for a dip towards 7.10-00%.
Time To Press Pause? Financial Conditions & The FOMC
Executive Summary
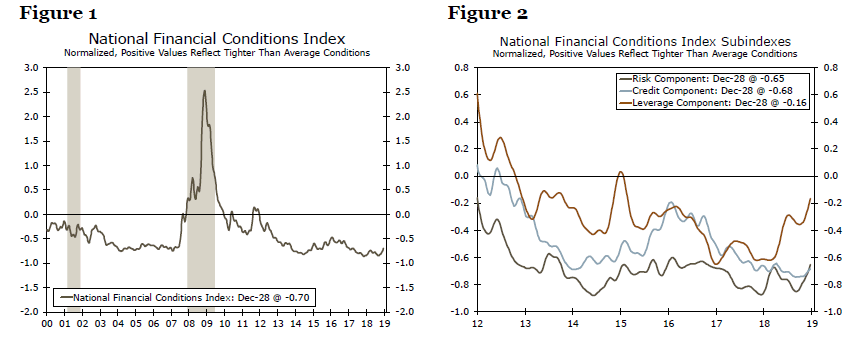
Financial conditions have tightened in recent months, prompting speculation that the Federal Open Market Committee (FOMC) may need to alter its current expectation of raising the fed funds rate two more times this year. The Chicago Fed’s National Financial Conditions Index (NFCI) increased 13 bps between the FOMC’s September and December meetings—the largest increase between FOMC rate hikes since 2000—implying that overall financial conditions have tightened. Yet financial conditions are easier today than when the FOMC began raising rates in December 2015. So is the FOMC likely to look through the recent moves?
It is not unusual to see financial conditions ease while the FOMC is tightening policy—both are responding to the stronger economy. Controlling for the macroeconomic environment, however, shows that financial conditions have tightened more than the NFCI implies, and are tighter in total than when the FOMC first raised rates in late 2015. While financial conditions do not seem overly restrictive at present, the FOMC may decide that a wait-and-see period may be appropriate given the speed of recent tightening in financial conditions and current expectations for growth to slow toward its longer-run trend. Our most recent forecast, which was compiled in early December, looks for the Fed to hike rates 25 bps in March and another 25 bps in September. But we readily acknowledge that the risks are skewed to a longer pause in the first half of the year than we thought just a month ago due to the recent tightening in financial conditions.
Financial Conditions Have Tightened
Financial markets deteriorated sharply at the end of 2018. The S&P 500 fell more than 10% in the fourth quarter, while the yield on the 10-year Treasury security slid about 30 bps as investors flocked to safer assets. Given the forward-looking nature of markets, the tumult raised concerns about growth in the new year and was even seen as a reason the FOMC might hold off on its widely telegraphed rate hike in December. Chairman Powell stated numerous times in his post-meeting press conference that the Committee was not looking solely at financial markets, but broad financial conditions. So how have financial conditions—not just markets—evolved recently, and what does it mean for economic growth and the future path of FOMC policy?
For a wide-ranging view of financial conditions, we turn to the Chicago Fed’s National Financial Conditions Index (NFCI). The index includes 105 variables, capturing leverage, risk and credit conditions. Since the index is constructed to average zero over time (with a standard deviation of one), negative readings indicate historically loose financial conditions, while positive readings indicate historically tight conditions. Therefore, higher values of the index are indicative of tighter financial conditions.
The NFCI rose 14 bps over the fourth quarter of 2018 (Figure 1). The move was the largest quarterly increase since the start of 2016—a point at which the FOMC hit pause on rate hikes. Specifically, risk-related measures, like the VIX index and TED spread, have risen over the past few months. At the same time, indications of leverage, like weakening corporate debt issuance, have pointed to more restrictive financial conditions (Figure 2). Credit conditions, which reflect the willingness to borrow and lend at prevailing prices, have been little changed. But the overall NFCI generally remains at a low level, indicating that general financial conditions are not overly restrictive at present.
Financial Conditions: The Transmission Channel between FOMC Policy and the Real Economy
Financial conditions per se are not an objective for the FOMC, but they are taken into account due to their indirect effects on the Fed’s two policy goals: “price stability” and “maximum employment.” The committee’s aim in tightening policy is to prevent the economy from overheating to the point that it risks significantly overshooting its inflation target, which it defines as PCE inflation of 2%. However, the FOMC’s primary policy tools, the fed funds rate and the balance sheet, have little direct effect on the Fed’s two policy objectives.
Instead, the FOMC’s tools affect the economy by influencing other interest rates and risk taking. In that way, financial conditions capture the transmission of FOMC policy to the real economy. Businesses and households will modify investment and saving plans depending on the relative ease or tightness of financial conditions. Tighter conditions, reflecting the availability and cost of credit, may reduce the ability and/or willingness to take on debt, which, all else equal, could weigh on growth in investment and consumption and thereby on the overall rate of real GDP growth. In contrast, easier conditions could stoke up growth in consumption and investment.
Behind the Starting Line after Three Years of FOMC Tightening
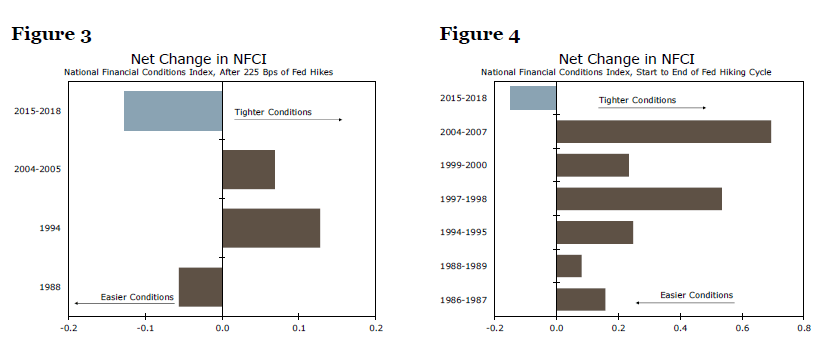
Given that financial conditions are influenced by FOMC policy, it is not unexpected to see broader financial conditions tighten as the Fed normalizes policy. In other words, tighter financial conditions are an anticipated byproduct of FOMC rate hikes. But monetary policy decisions and broad financial conditions do not always move in tandem. Despite the FOMC raising its target range for the fed funds rate 225 bps since late 2015, financial conditions as measured by the NFCI have eased on net over the period (Figure 3). The easing has primarily come in terms of credit, with, for example, corporate bond spreads narrower and bank lending standards looser. The overall easing in financial conditions since late 2015 stands in contrast to the previous two tightening cycles in which the FOMC raised rates by the same amount. As noted previously, general financial conditions do not appear to be overly restrictive at present.
With financial conditions still easy relative to when the Fed first began to normalize policy, does that mean there is more tightening in store? In each of the previous six rate-hiking cycles, the FOMC did not stop until financial conditions had tightened on net (Figure 4). This historical record suggests that the FOMC may very well have a few more rate hikes to go in this cycle, at least at first glance.
Does the FOMC Need to See Financial Conditions Tighten Further?
The traditional NFCI does not take into account underlying economic conditions. All else equal, it makes sense for investors to take on more risk, for households to take on more debt and for lenders to ease standards in an improving economic environment. As a result, financial conditions and economic conditions are often closely correlated. Therefore, it is not unusual to see financial conditions ease, at least for a time being, at the same time the FOMC is raising rates—both are responding to a stronger economy.
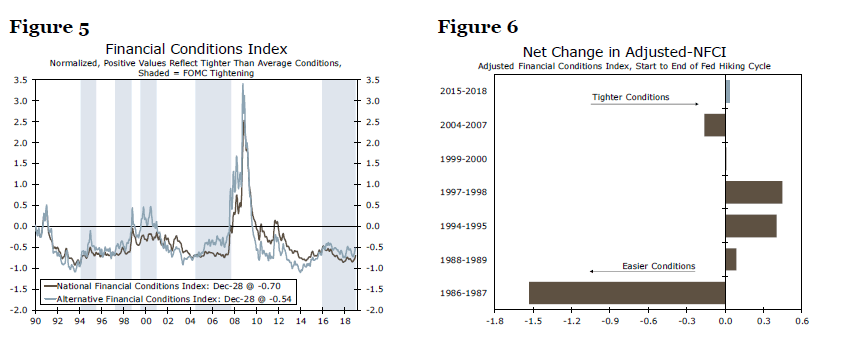
To isolate financial conditions only, the Chicago Fed also calculates an Adjusted National Financial Conditions Index (ANFCI).1 The ANFCI controls for the macroeconomic environment, and thus it is more telling in regard to how underlying financial conditions have evolved. By this measure, financial conditions have tightened more in recent months than implied by the NFCI alone (Figure 5). Specifically, the ANFCI has increased about 20 bps since late September, which is about twice as much as the increase in the NCFI. Although the ANFCI remains low in a historic context, the rise in the index implies that financial conditions are a bit tighter in total than when the Fed first began raising rates in late 2015 (Figure 6).
The degree to which financial conditions have tightened over a rate-hike cycle helps quantify how far—or short—the FOMC has come. Yet there is no set amount by which financial conditions need to tighten, or a threshold to cross, before the FOMC stops raising rates. If the economy is showing few signs of overheating, looser financial conditions relative to the start of a tightening cycle are not necessarily a problem. The same can be said for an economy where growth is slowing back toward its longer-run trend, as is the case today.
How financial conditions impact the stability of the overall financial system may, however, be of concern. If a prolonged period of loose financial conditions stokes instability via greater risk taking, more leverage and questionable credit, then those factors may affect policymaking. That said, the primary means of addressing financial instability are likely to be targeted regulatory (macro-prudential) policies by the Federal Reserve and other federal banking agencies rather than the blunter tool of changes in interest rates by the FOMC. At present, the Fed generally does not seem to be unduly concerned with financial stability. The Federal Reserve Board’s inaugural Financial Stability Report released in November found that while valuations are elevated, private sector credit risks are moderate and leverage and funding risks are low.2
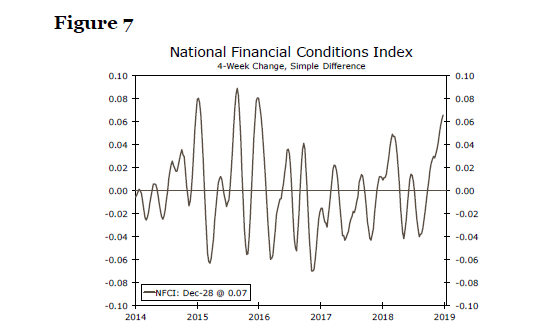
Moreover, the cumulative amount of tightening in financial conditions may not be as much of an issue as the speed. Over the past month, the financial conditions indices rose faster than at any time since the start of 2016 (Figure 7). Given that it takes time for financial conditions to effect the real economy, the FOMC could perceivably hold off on subsequent rate hikes in the near term as it waits to see how financial conditions have affected growth prospects
Conclusion: The FOMC Might Revisit the Pause Button
The last time financial conditions tightened as sharply as this past December was at the start of 2016. Back then, the FOMC had just raised the fed funds target rate for the first time since the crisis. However, signs of slower growth in China caused volatility in financial markets to spike and overall financial conditions tightened. Following its initial rate hike in December 2015, the FOMC subsequently remained on hold until December 2016.
Our most recent forecast, which was compiled in early December, looks for two 25 bps rate hikes in 2019, first in March and again in September. But we readily acknowledge that the risks are skewed to a longer pause in the first half of the year than we thought just a month ago. Overall financial conditions do not appear to be overly restrictive at present, but they clearly have tightened in recent weeks. Consequently, the FOMC may decide that a period of wait-and-see is again appropriate, especially with the fed funds target rate already close to many committee members’ estimates of “neutral” and with inflation showing few signs of significantly exceeding the Fed’s target of 2%. We will be watching incoming data and making changes to our Fed call, as appropriate