Sample Category Title
U.S. Manufacturing Activity Expanded at a Materially Slower Pace in December
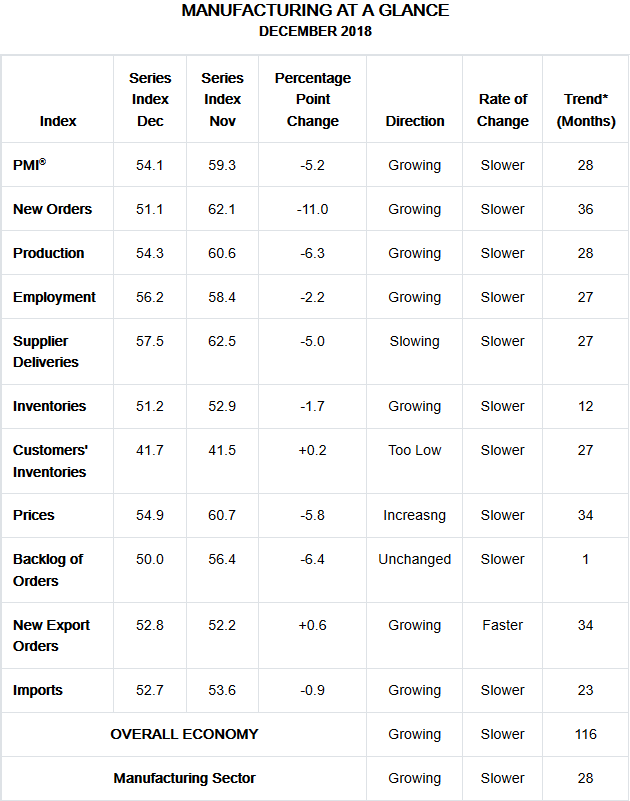
The Institute for Supply Management (ISM) manufacturing index fell 5.2 percentage points to 54.1 in December. Markets were expecting less of a deceleration, with a move down to 57.5 from November's 59.3 value. This marks the slowest pace of expansion in the U.S. manufacturing sector since November 2016.
All of the five subcomponents that comprise the headline figure declined in December. New orders fell 11 points to 51.1, production fell 6.3 points to 54.3, and employment fell 2.2 points to 56.2. Supplier deliveries fared no better, falling 5 points to 57.5, while inventories fell 1.7 points to 51.2.
The trade components of the report registered a slight improvement in export orders (+0.6 to 52.8), and a slight deceleration in import order growth (-0.9 to 52.7). Nevertheless, these levels remain well below those recorded at the time the U.S. administration levied tariffs on steel and aluminum imports this past March. Notably, import orders in December were growing at the slowest pace since May 2017 (52.3).
Although volatile and not seasonally adjusted, both the decline in prices paid and the order backlog components are worth noting. Prices paid shed 5.8 points to 54.9, the slowest reported pace of price increases since June 2017. Reduced price pressures are a result of declines in aluminum and steel products, while crude oil/gas prices also fell. The backlog of new orders didn't grow in December (-6.4 points to 50), the first time this has occurred since January 2017.
Eleven of eighteen manufacturing industries reported growth in December, down from thirteen in November. Six industries reported contraction: printing and related support activities, fabricated metal products, nonmetallic mineral products, petroleum and coal products, paper products, and plastics and rubber products.
Key Implications
After months of manufacturing activity moving sideways, with a slight downtrend from cyclical highs reached this past summer, manufacturing activity in the U.S. appears to be catching down to its global peers. Although one month of a dramatic slowdown does not imply a trend, there is little indication that the dramatic declines in the pace of expansion of the major components were driven by temporary factors. Comments by survey respondents suggest that demand has slowed, and is most evident in the fall in the growth of new orders. Tariffs were cited as contributing to uncertainty and hence the slowdown in demand, while also being blamed for spurring higher prices for inputs. What's more, both production and new orders for December may be somewhat inflated as firms pulled forward purchases in advance of announced price increases slated to take effect at the start of 2019. Although the pace of U.S. manufacturing activity has slowed, capacity, labor, and component shortages still remain.
After a strong showing in the first half of 2018, global manufacturing surveys continue to signal a broad economic slowdown beginning in the second half of 2018. With few exceptions, the pace of expansion in manufacturing activity trended lower in December across the world, with France joining China, Turkey, and Taiwan in contraction. A broad-based slowdown in global manufacturing is consistent with the trend of weakening growth in trade volumes, commodity prices, and global growth more broadly. Overall, slowing foreign demand is likely to remain a headwind to U.S. manufacturers through the first half of 2019. That said, trade talks between the U.S. and China could yet prove fruitful this quarter, and if a deal is reached should help alleviate much of economic policy uncertainty while also working to restore confidence in the global economy.
Equities Year ahead 2019: Grim Outlook Weighs on Earnings But is the Gloom Justified?
After a year that saw the S&P 500’s bull run become the longest in history and then abruptly end, giving way to a steep correction, investors are increasingly nervous that 2019 may be an even more challenging period as the US economic cycle appears to be nearing its final stages. Global central banks are withdrawing stimulus at a time when growth is moderating to more normal levels and geopolitical risks linger. Hence, volatility is set to remain elevated, and while stock markets may still be able to eke out some late-cycle gains, caution among participants is definitely on the rise.
Slowdown looming
Although very few pundits are calling for an outright recession in 2019, almost everyone agrees that some ‘cracks’ are starting to show in the global economy, and growth will most likely slow to a more normal pace going forward. In the US, such softness is evident in the housing market, which due to its sensitivity to interest rate hikes vis-a-vis rising mortgage rates is typically considered the “canary in the coal mine”, in the sense that it leads the broader economy in weakening. Europe may be in a more critical stage as growth is already bleeding momentum, while Japan’s economy contracted in the most recently-reported quarter. Likewise, China signalled it will ease both monetary and fiscal policy further in the coming months amid decelerating growth.
Global indices suffer heavy losses
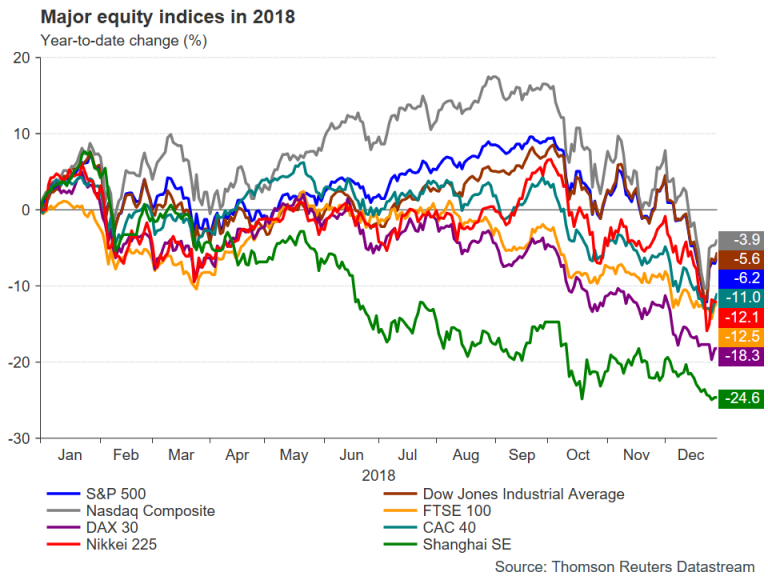
The bleaker outlook for global growth cannot be good news for share prices as it can only translate to a drop in corporate earnings growth. After an outstanding year for corporate America that saw a record number of companies in the S&P 500 index beating their earnings forecasts, the 9-year bull market may be coming to an end, with the benchmark now officially in correction territory, having fallen more than 10% from its record high. The Dow Jones and the Nasdaq Composite are also more than 10% below their all-time highs, with the tech-heavy Nasdaq being the closest to entering a bear market (losses exceed 20%) as it has fallen almost 18% from its record level scaled in October.
For the year as a whole though, the three main indices were down only moderately, falling between 4% and 6%, and losses in other parts of the world were more pronounced, particularly in China. A slowing Chinese economy, brought about by deleveraging reforms and worsened by the trade war with the US, dragged the Shanghai Composite and the CSI 300 indices down by around 25% in 2018. Japan’s Nikkei 225 index lost about 12% as exports struggled amid global trade tensions, while major European bourses were down by between 11% and 18% on disappointing economic performance and political uncertainty.
Early tests for traders at start of 2019
As 2019 gets underway, there is little for investors to get excited about as the risks for equities are seemingly to the downside. The US economy is losing steam as the effects of the 2018 fiscal stimulus fade, China is slowing faster than anticipated as higher US tariffs start to bite, the odds of a disorderly Brexit remain uncomfortably high less than three months before the UK departs from the EU, and a pick up in Eurozone growth is still looking elusive.
The first big test for the markets could come as early as mid-January when the UK Parliament will get to vote on Theresa May’s hugely unpopular Brexit deal. Mrs. May needs to secure further assurances by EU leaders that the UK would not get trapped inside the customs union should the Irish backstop ever be initiated in order to stand a good chance of winning the vote. If lawmakers vote down the deal, hopes for a smooth Brexit would dissipate and market turmoil could ensue.
The next danger for investors will be the March 1 deadline for the US and China to make meaningful progress in the negotiations for a new trade accord. Failure for the two sides to reach some sort of a preliminary agreement could trigger a new wave of stocks sell-off.
US stocks cheaper, but cheap enough?
However, while new headwinds and negative developments would almost certainly lead to global equities extending their losses into 2019, the rout is unlikely to be as deep as the worst-case predictions and a recovery could come far more quickly than what analysts would expect.
The main reason for that is that stock valuations are already looking much more attractive than they did only a couple of months ago. The S&P 500 is currently trading at 14.3 times its one-year forward earnings. That’s below its one-year historical level of 17.75 and less than the 5-year average of 15.7. The Dow Jones and the Nasdaq Composite are also trading below their 12-month historical price/earnings ratios.
It’s worth pointing out though that those valuations would start to look not so cheap if the outlook for corporate earnings started to deteriorate beyond what has been priced into the markets and stocks would need to fall further to remain attractive.
Will Fed come to the rescue?
Another factor that could limit the downside scope for stocks is if the Federal Reserve steps in to counter a steep downturn with rate cuts. The Fed has so far not appeared overly concerned by the growing market pessimism and turmoil and plans to raise rates two more times in 2019. Markets are not convinced by the Fed’s hawkishness and do not think the US central bank will be able to hike at all this year. Should policymakers signal an end to the rate hike cycle and message their willingness to respond to the tightening financial conditions by possibly cutting rates, stocks would receive a major boost and could be set for a sustained upside reversal.
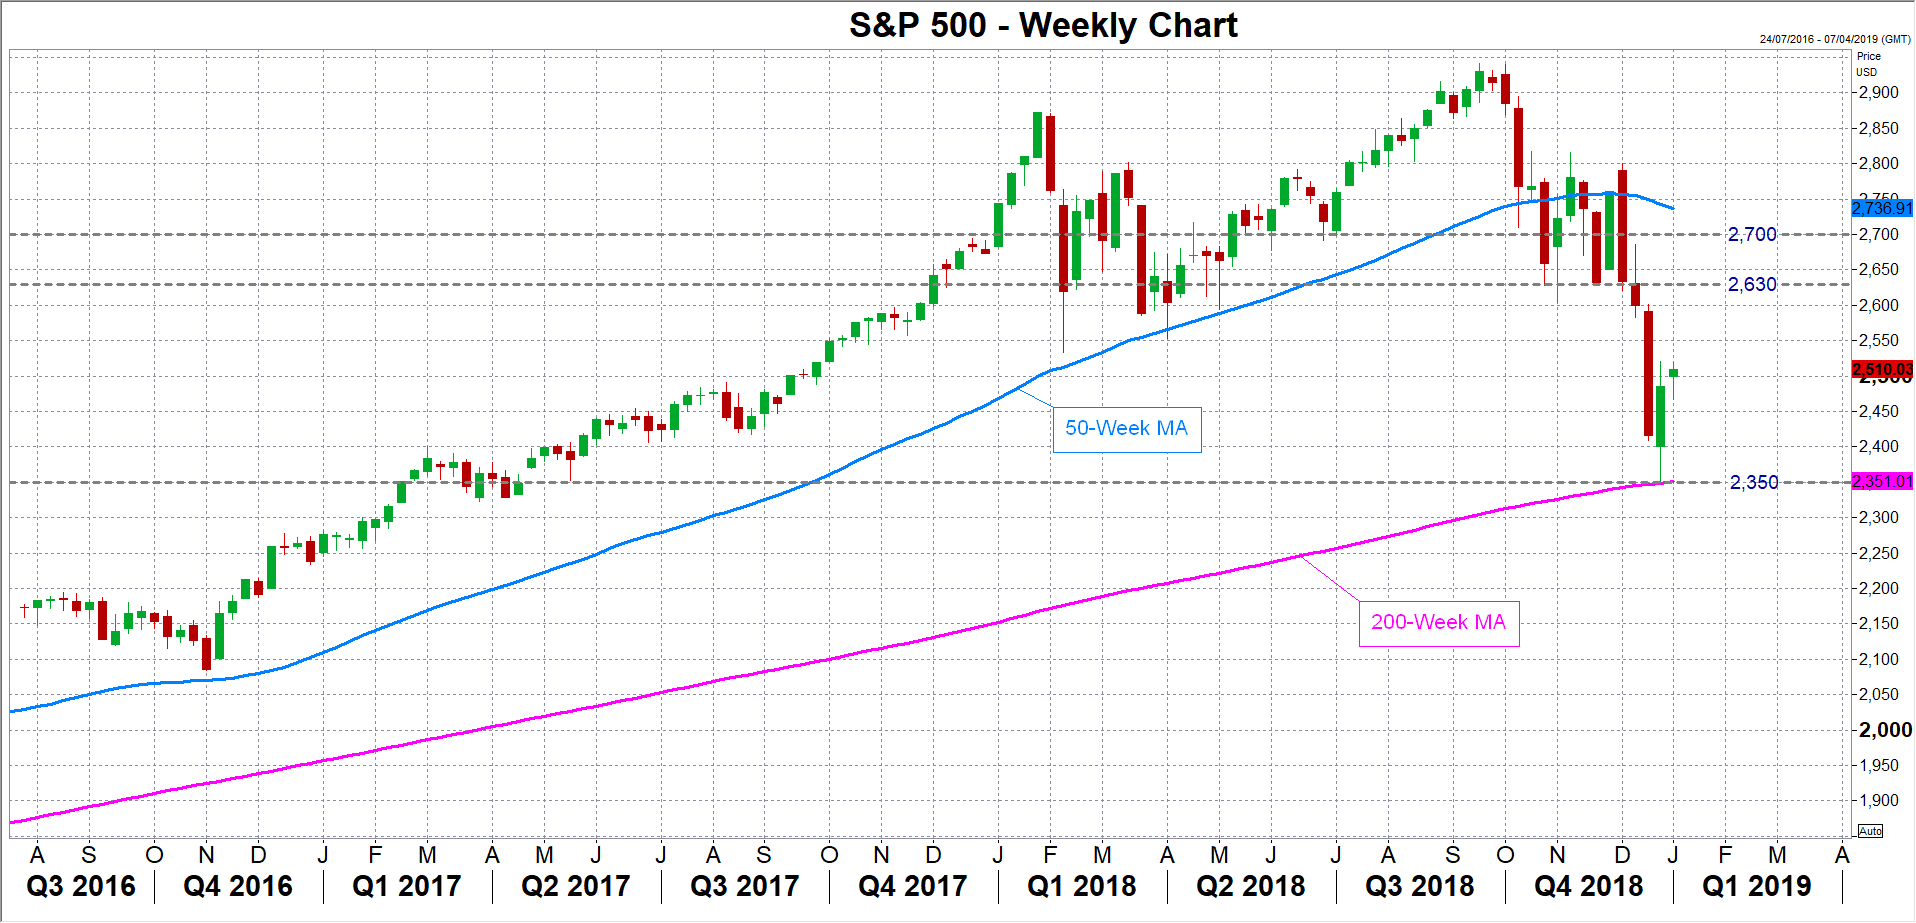
A key level to watch for the S&P 500 that could determine whether the index is bottoming out or if it’s headed for further losses is the 200-week moving average around 2,350. A breach of this support could signal the start of a bear market. However, if this support holds, the index could move sideways until some of the uncertainties surrounding the growth outlook, trade frictions and Brexit have been lifted.
Fears of recession overdone?
It is wildly possible of course that none of the risks worrying traders materialize, or even if they do, they are successfully contained by policymakers and the fallouts do not live up to the worst-case scenarios. The single-most positive development that could alter the outlook for 2019 is an end to the trade spat between the US and China, or at the least, some concrete steps in achieving that.
But even if the US and other major economies are hit with some strong headwinds, investors may be underestimating the underlying fundamentals of the global economy and the negative impact to growth may not prove to be so great. After all, you could argue that the US and Europe are only returning to trend growth after a spell of above-average growth and that rising employment levels should sustain healthy domestic demand, preventing a deeper downturn.
An eventual realisation of this by the markets could lead to a gradual recovery in stocks as investors adjust their earnings forecasts. The S&P 500 could initially rebound towards the recently congested area of 2,630 before attempting a break above the 2,700 level.
Risk of overtightening
There is a danger, however, that in the absence of significant downside risks, the Fed and others such as the ECB would stick to their current policy path of raising borrowing costs in 2019. This means any rebound in equities would likely have limited room to run as investors could once again find themselves on edge as fears that central banks are tightening too fast would return to the fore.
At the moment, markets are not expecting the Fed to raise rates at all this year. Should traders start to price in a rate rise again, this could derail any stock market recovery (or deepen the rout if there is no turnaround) if renewed Fed hawkishness is not supported by a notable improvement in the global growth momentum.
Navigating 2019 – 9 Big Insights for the Year Ahead
In this report we set out here to examine some of the trends that will unfold in the year ahead – the risks to watch for and the opportunities to be had.
Coming into 2019, the U.S. economy was on firm ground, with growth projected to slow mildly, to 2½%. Canada enjoys several advantages, including strong population growth, an increasingly dynamic economy and our continued embrace of free trade, though we also face pressure from lower-than-expected oil prices and tightening financial conditions.
Add all this together, and we still believe it’s premature to say this year will mark the end of the expansion. So what will keep growth going? After years of ultra-low interest rates, it will have to be more than the consumer.
In 2019, the economy may finally have to stand on its own.
UK Services PMI Expected to Nudge Up But Unlikely to Lift Battered Pound
The Markit/CIPS services PMI for the UK will be watched on Friday at 09:30 GMT for evidence that the dominant sector of the British economy remained in expansionary mode amid the increasing strain of the Brexit uncertainty. However, without an end to the Brexit impasse at Westminster, sterling will struggle to find much upside momentum even if the data doesn’t disappoint.
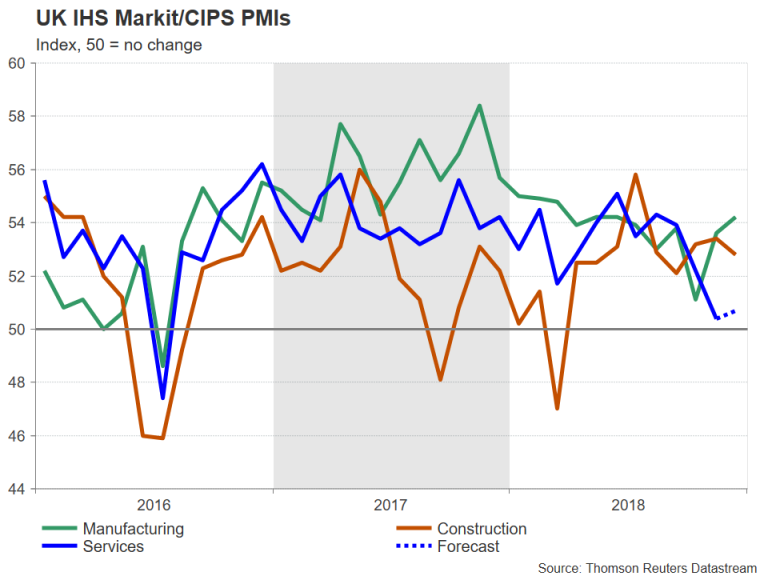
The past week has already seen the release of the manufacturing and construction PMIs for December, both of which suggested that the UK economy is not doing too badly compared to its European peers. The manufacturing PMI beat even the top estimates to surge to a 6-month high of 54.2 last month, while the construction PMI was slightly below forecasts at 52.8. However, looking at the details of the data, the jump in manufacturing activity was mainly attributed to stock piling by companies in preparation for a possible disorderly Brexit, which could create long border checks and delays.
Meanwhile, the services sector, which is seen as the engine of UK growth, is expected to underperform both the manufacturing and construction industries for the second month in-a-row in December. The services PMI is forecast to rise slightly from 50.4 for 50.7, staying just above the 50 level that separates expansion from contraction.
An unexpected drop in services activity could pull the pound below the near 21-month low of $1.2436 it touched earlier today, as it would point to stagnating growth in the world’s fifth largest economy. Sterling has already been under heavy selling pressure in recent weeks as Parliament remains split as to how to proceed with Brexit. Prime Minister Theresa May is hoping she can win further reassurances from the EU on the Irish backstop issue before her Brexit deal is put to the vote during the week commencing January 14 so that it can pass through Parliament and avert a crash exit from the EU.
In the meantime, the lack of progress on the Brexit front will limit any potential short-term gains that could come from a data beat. The $1.26 handle is the first major resistance for cable if there is a positive surprise in the services PMI as it’s close to the 61.8% Fibonacci retracement of the upleg from $1.2475 to $1.2814. A break above could see the next test come in the $1.2680-85 region where the 50-period moving average is converging with the 38.2% Fibonacci in the 4-hour chart.
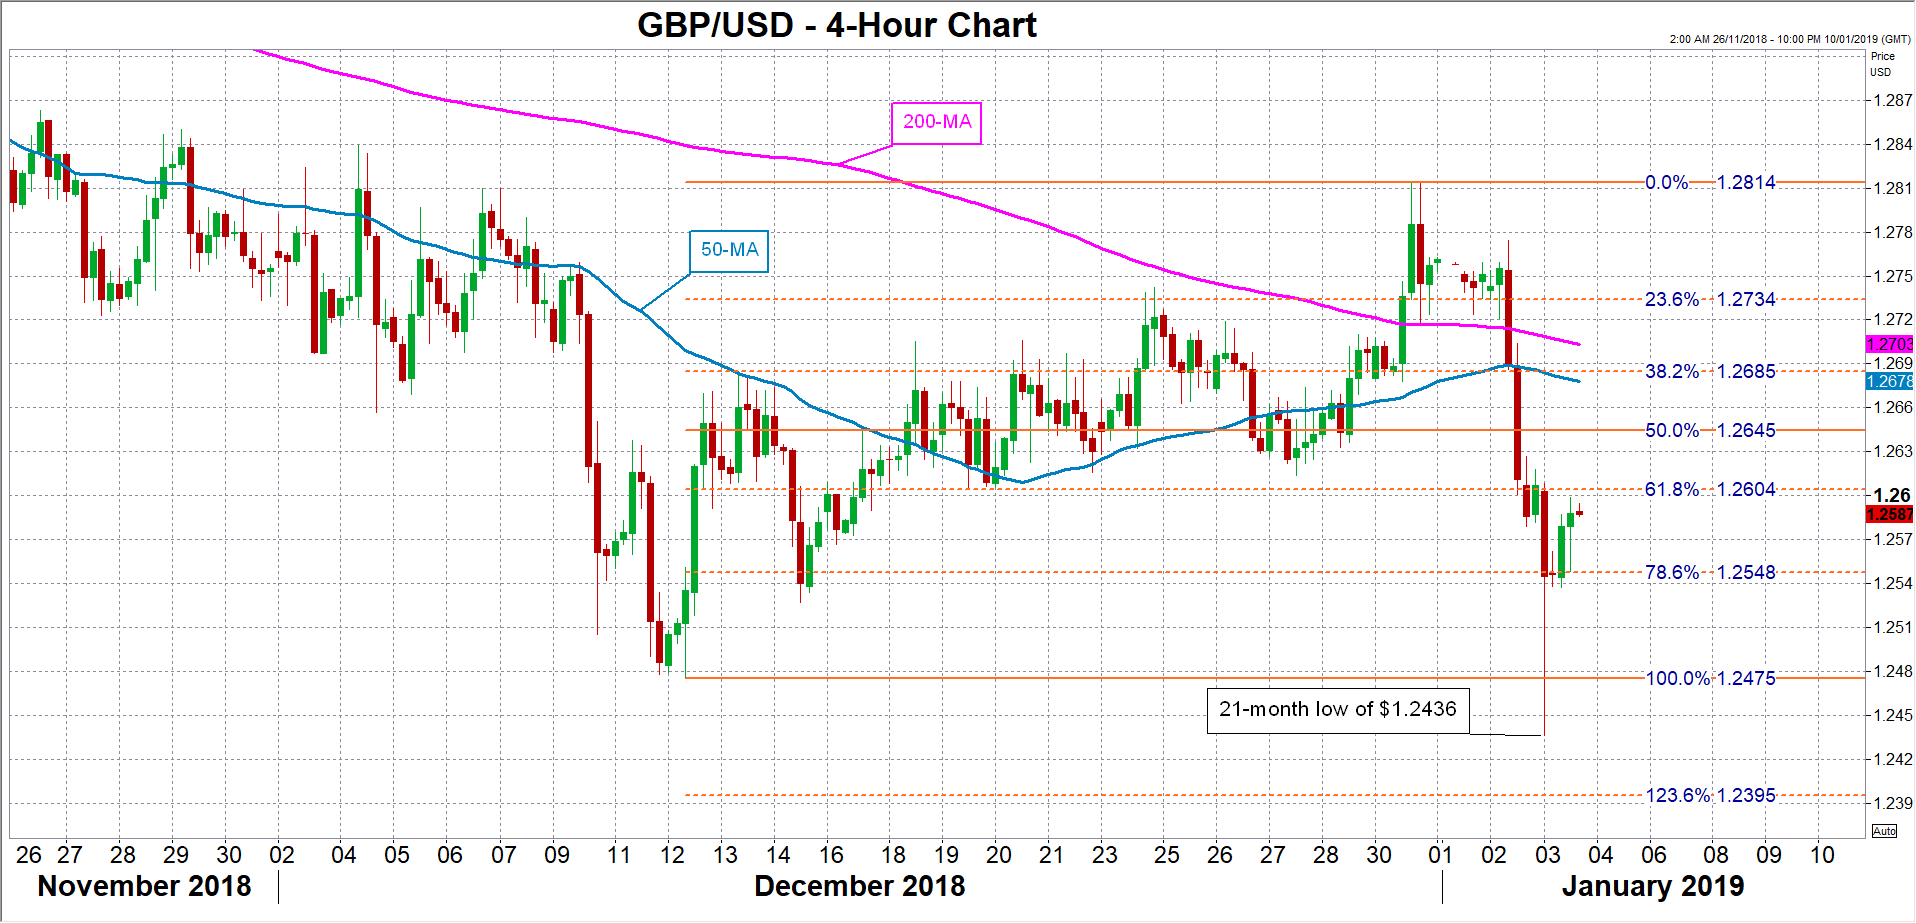
However, if the services gauge adds to concerns of a major slowdown, the pound could slip below immediate support around the 78.6% Fibonacci at $1.2548 and head back towards the 21-month trough. A breach of that low would open the way for the $1.24 handle, which is just above the 123.6% Fibonacci extension.
DAX Slides as Apple Warning Spooks Investors
The DAX has posted sharp losses in the Thursday session, wiping out the gains seen on Wednesday. Currently, the index is at 10,437, down 1.35% since the Wednesday close. On the release front, eurozone monetary data was within expectations. On Friday, the eurozone releases Flash CPI estimates.
Any hopes for a positive start to the New Year were quickly dashed, as Asian and European stock markets declined sharply on Thursday. Investors responded negatively after Apple cut its quarterly sales forecast. The revenue warning, which was released after the close of North American markets on Wednesday, caught the markets by surprise. Apple blamed the downturn on weaker iPhone sales in China, which has been hit by an economic slowdown due to the ongoing tariff battle with the United States. Will the downturn continue? Last week, the DAX dropped to 10,279, its lowest level since November 2016, and investors are sorely in need of some positive news to shore up their badly-shaken confidence.
The ongoing global trade war has dampened economic growth and hurt investor confidence. With investors reading in their morning newspapers that equity markets suffered their worst year since 2008, risk apprehension remains high as we begin the New Year. However, one positive development in December was the announcement that U.S. and Chinese delegations are set to meet next week and tackle the trade issues that have sparked a serious rift between the world’s two largest economies. The talks are critical, as the U.S. has said that it will impose heavy tariffs on Chinese products on March 1, but agreed to suspend the move while talks are ongoing. Earlier in the week, President Trump said that ‘big progress’ had been made with China, but with the sides yet to meet face-to-face, the markets are not putting much stock in Trump’s remarks.
US ISM manufacturing dropped to 54.1, biggest monthly fall since 2008
US ISM manufacturing index dropped sharply from 59.3 to 54.1 in December, well below expectation of 58.4. The -5.2 pts decline is the largest one-month drop since 2008. Looking at the details, new orders tumbled -11 pts to 51.1, production dropped -6.3 to 54.3, employment dropped -2.2 to 56.2. ISM noted that "comments from the panel reflect continued expanding business strength, but at much lower levels." Also, only 11 districts of out 18 reported growth in December.
GBP/USD Mid-Day Outlook
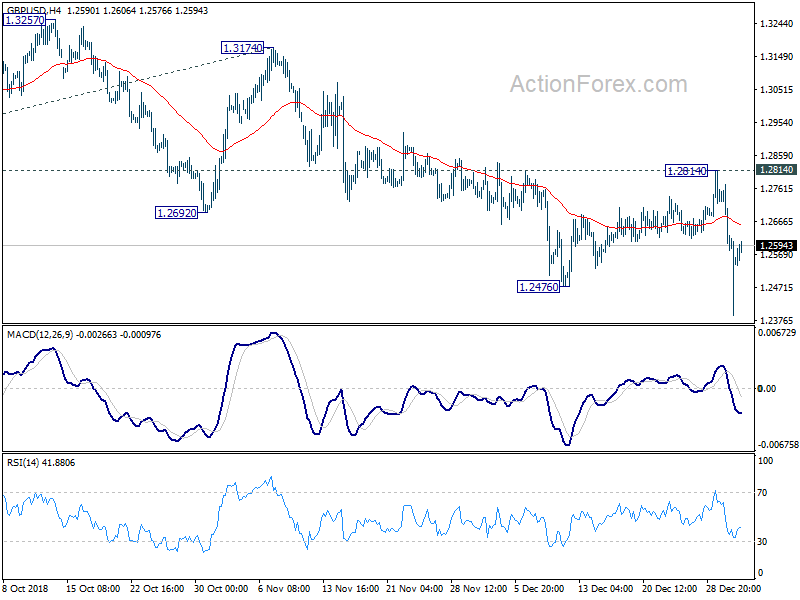
Daily Pivots: (S1) 1.2536; (P) 1.2655; (R1) 1.2729; More....
Outlook in GBP/USD remains bearish with 1.2814 resistance intact. The down trend from 1.4376 has just resumed and should target 61.8% projection of 1.4376 to 1.2661 from 1.3174 at 1.2114 next. On the upside, break of 1.2814 resistance is needed to indicate trend reversal. Otherwise, outlook will remain bearish in case of recovery.
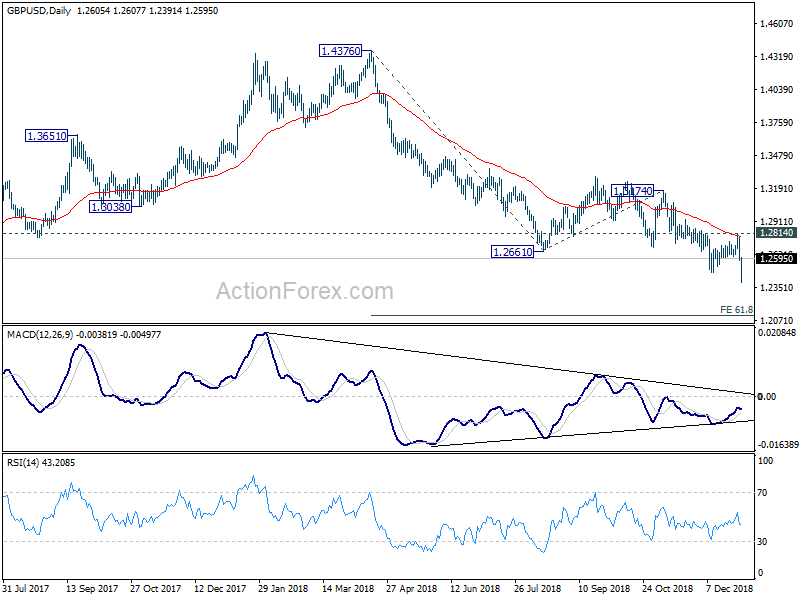
In the bigger picture, whole medium term rebound from 1.1946 (2016 low) should have completed at 1.4376 already, after rejection from 55 month EMA. The structure and momentum of the fall from 1.4376 argues that it's resuming long term down trend from 2.1161 (2007 high). And this will now remain the preferred case as long as 1.3174 structural resistance holds. GBP/USD should target a test on 1.1946 first. Decisive break there will confirm our bearish view.
EUR/USD Mid-Day Outlook
Daily Pivots: (S1) 1.1280; (P) 1.1388; (R1) 1.1452; More.....
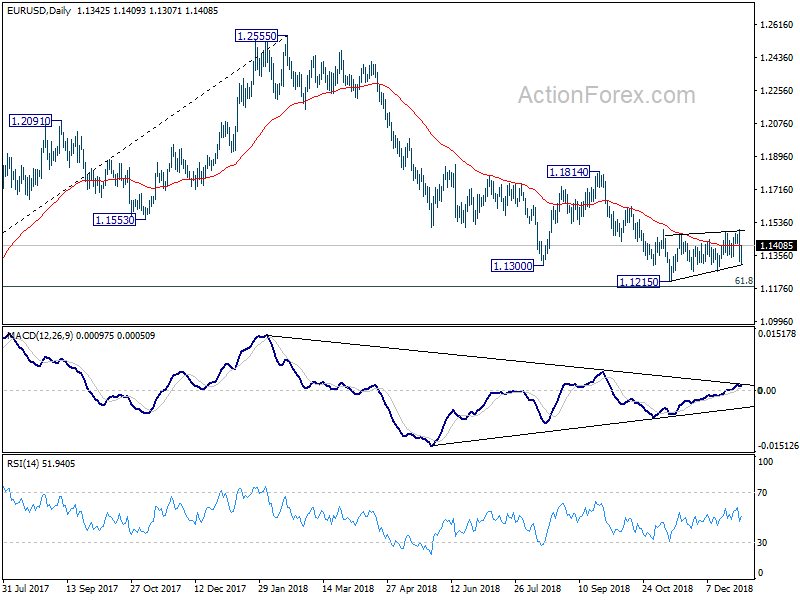
Intraday bias in EUR/USD remains neutral as it's staying in range of 1.1270/1496. On the downside, break of 1.1270 revive the bearish case that down trend from 1.2555 is still in progress. EUR/USD should then target 1.1186 key fibonacci level next. On the upside, however, sustained break of 1.1496 will revive the case of near term reversal, on bullish convergence condition in daily MACD. Bias will be turned back to the upside for 1.1621 resistance first. Break will target 1.1814 key resistance next.
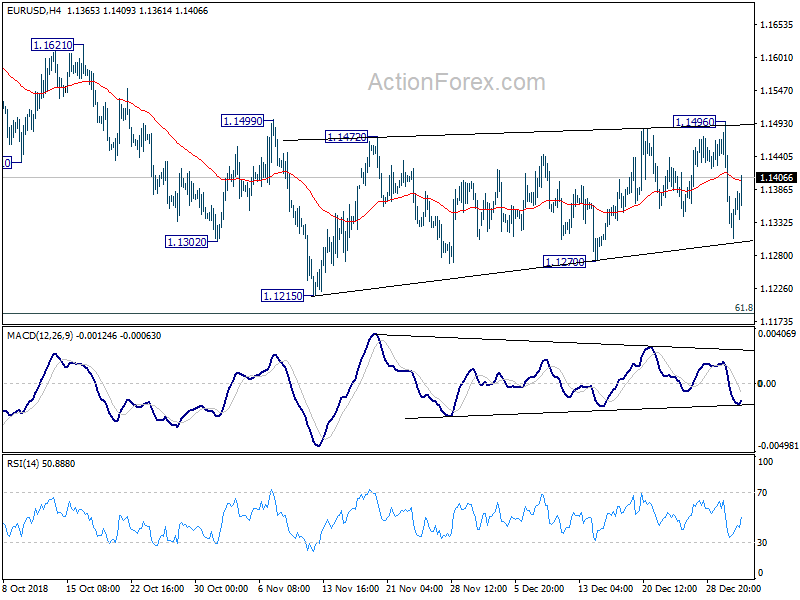
In the bigger picture, as long as 1.1814 resistance holds, down trend down trend from 1.2555 medium term top is still in progress and should target 61.8% retracement of 1.0339 (2017 low) to 1.2555 at 1.1186 next. Sustained break there will pave the way to retest 1.0339. However, break of 1.1814 will confirm completion of such down trend and turn medium term outlook bullish.
USD/CHF Mid-Day Outlook
Daily Pivots: (S1) 0.9824; (P) 0.9872; (R1) 0.9949; More...
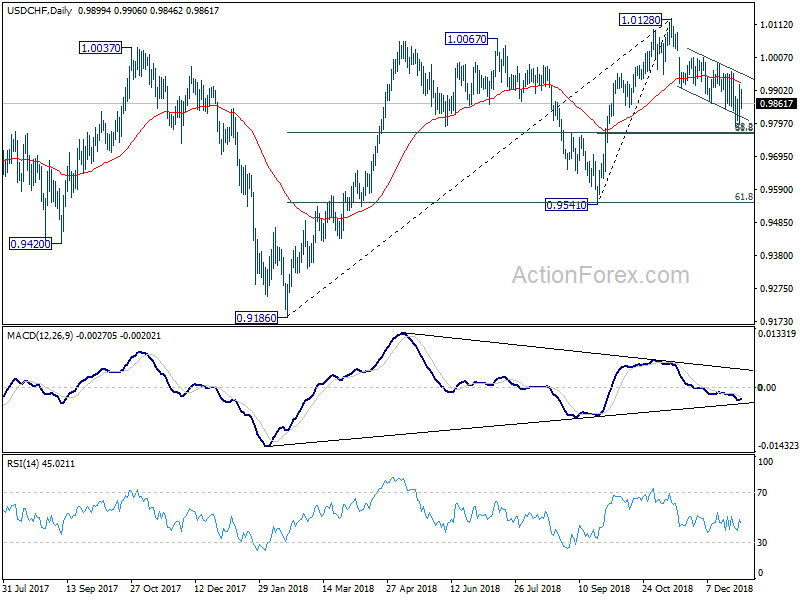
Intraday bias in USD/CHF remains neutral as it's bounded in range of 0.9789/9963. With 0.9963 resistance intact, another decline is mildly in favor. Below 0.9789 will target 0.9765/8 (61.8% retracement of 0.9541 to 1.0128 at 0.9765, 38.2% retracement of 0.9186 to 1.0128 at 0.9768). We'll look for bottoming signal again there. On the upside, break of 0.9963 will suggests that the pull back from 1.0128 has completed and will turn bias back to the upside for this resistance.
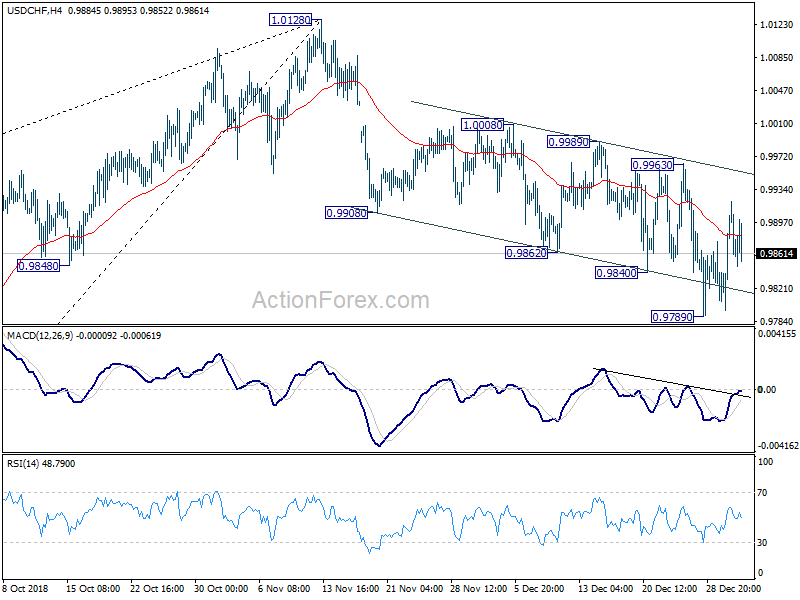
In the bigger picture, the deeper than expected fall form 1.0128 argues that medium term rally from 0.9186 might have completed at 1.0128 already, on bearish divergence condition in daily and weekly MACD. Break of 0.9541 key support will confirm this bearish case. More importantly, the corrective three wave structure will in turn argue that long term corrective pattern from 1.0342 (2016 high) is extending. In that case, 0.9186 will be the next target.
USD/JPY Mid-Day Outlook
Daily Pivots: (S1) 108.48; (P) 109.11; (R1) 109.52; More..
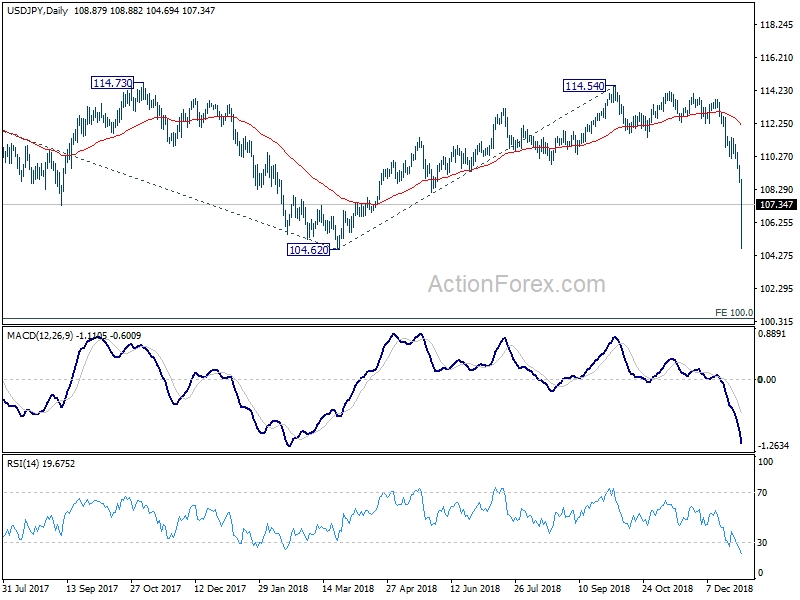
USD/JPY is now in consolidation above 104.69 spike low and intraday bias is turned neutral first. More consolidation would be seen but outlook will stay bearish as long as 109.36 minor resistance holds. On the downside, decisive break of 104.62 low will target 100% projection of 118.65 to 104.62 from 114.54 at 100.51, which is close to 100 psychological level.
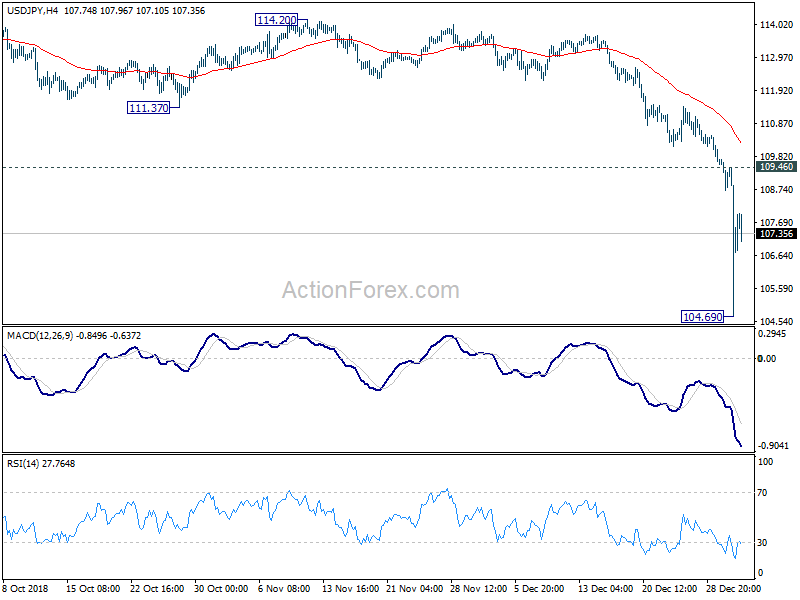
In the bigger picture, price actions from 125.85 (2015 high) are seen as a long term corrective pattern, no change in this view. Apparently, such corrective pattern is not completed yet. Fall from 114.54 is seen as another medium term down leg, targeting 98.97/104.62 support zone. For now, we'd expect strong support from there to contain downside to bring rebound.