Sample Category Title
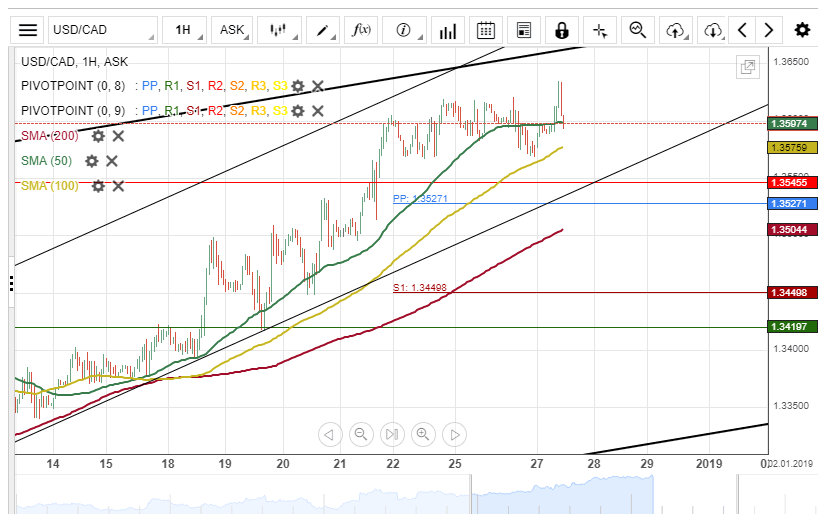
US initial jobless claims dropped -1k to 216k
US initial jobless claims dropped -1k to 216k in the week ending December 22, slightly below expectation of 220k. Four-week moving average on initial claims dropped -4.75k to 218k.
Continuing claims dropped -4k to 1.701M in the week ending December 15. Four-week moving average dropped -1k to 1.676M.
What’s Better, Forex or Stock Trading?
Many people often ask the question as to whether forex trading is better than stock trading or vice versa. The question is like comparing apples and oranges. Forex trading is very different to trading stocks and although price might look the same on a chart, there are some significant differences.
Just as some people apples while others prefer oranges, it is the same story with forex trading or stock trading.
Let's take a look at some significant differences between forex and stock trading in order to better understand the question.
Forex and stocks are two completely different markets
Forex or the currency markets are very different from trading equity markets or the stock markets. As a result, both these markets require a somewhat different approach.
It is important to understand that while the forex markets trade nearly 23 hours a day, the equity markets trade for just eight hours or during business hours. This means that if you are a day trader, you need to adjust your trading to suite the trading hours if you want to trade stocks.
While forex deals with currencies, the stock markets deal with equities. Therefore, the fundamentals that drive both these markets are very different. For example, a central bank rate hike which can bring a lot of volatility to the currency markets can see a muted response for the stock markets. Likewise, a company's earnings release has literally no impact on forex.
Leverage is different with forex and stock trading
Leverage, which is a big game changer plays an important role in forex trading. Without a 1:100 leverage or more, most retail forex traders would not be able to trade at all.
With stocks, the leverage can vary from one stock broker to another. However, you will not find stock trading with leverage of 1:100. That is unheard of. Of course, the exception here is stock CFD trading, which is completely different.
In forex, you can see many companies such as Forex broker JustForex which offers a fairly decent leverage to trade the currency markets.
While in forex, you can trade with micro lots, in stock trading, this is not the case. Buying one share of a stock is the bare minimum that you can buy. Most stock brokers also have a minimum limit on the number of shares you can buy which can further limit you.
Stock trading is mostly investing, forex trading is mostly speculation
Another major difference between the two is that stock trading often see’s big inflows into the market. Typically, you will find large pension funds, hedge funds and institutional banks trading in the equity markets.
Of course, there are some retail stock traders as well, but they are usually not the majority. One of the biggest reasons why one would trade the stocks is to invest in the long term. There are only a few subset of traders that trade the stock markets for the purpose of speculating.
With forex markets, especially the retail sector, you are only speculating. No retail trader would open a forex trading account in hopes to take physical settlement of the other currency they are buying or selling.
As a result, you can see that the way the forex markets and the stock markets behave are quite different.
Conclusion – Which is better? Forex or stock trading?
In conclusion, the best answer to this question is what your trading goal is. If you want to invest for the long term, then stock markets are your best choice. This will ensure that your capital grows steadily and you can make additional profits from dividends etc.
If you are a short term trader and a speculator, then trading in Forex makes for a better choice. Of course, bear in mind that the fundamentals that govern the forex and the stock markets are greatly different.
USDCAD Records a New Yearly High in Overbought Zone
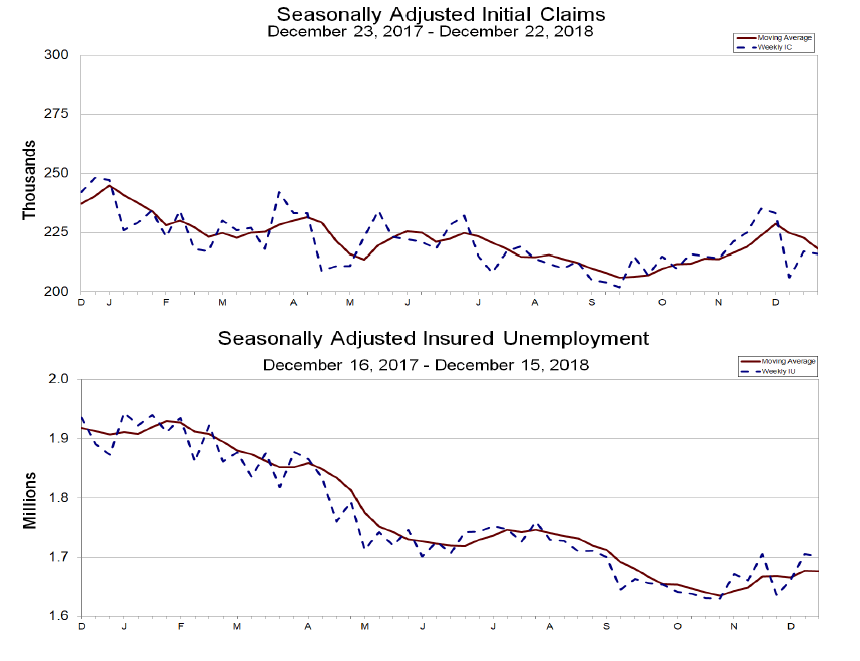
USDCAD had one of its best trading sessions for this year last week, gaining more than 1.5% to close at 1.36, while this week the pair continues to attract buying interest, with the price registering a fresh high for 2018 at 1.3631 on Thursday.
The technical indicators are still located in bullish area, with the MACD stretching further above its red signal line and the RSI moving above 70. Yet the latter could also be an indication that the rally is overdone and hence negative corrections should not be a surprise in coming sessions.
Should the price retreat, the 1.3560 level which the bears were unable to break this week could provide immediate support. Moving lower, the focus will shift to the 1.3450-1.3385 restrictive area, while lower still, a violation of July 20’s peak of 1.3289 would increase speculation that the bullish phase has ended and a downtrend is in progress.
In the alternative scenario, traders would be eagerly looking for a break above today’s top of 1.3631 to increase buying orders. If that’s the case, the rally could last until 1.3792, the highest level marked in 2017. If bullish forces appear even stronger, 1.40 should be another resistance to keep in mind.
The recent bullish action turned the bigger picture more positive as well and with the shorter-term moving averages (MA) increasing distance above the longer-term MAs we could expect further improvement in the market.
Into US session: Yen back in control as risk rebound falters, Aussie weakest
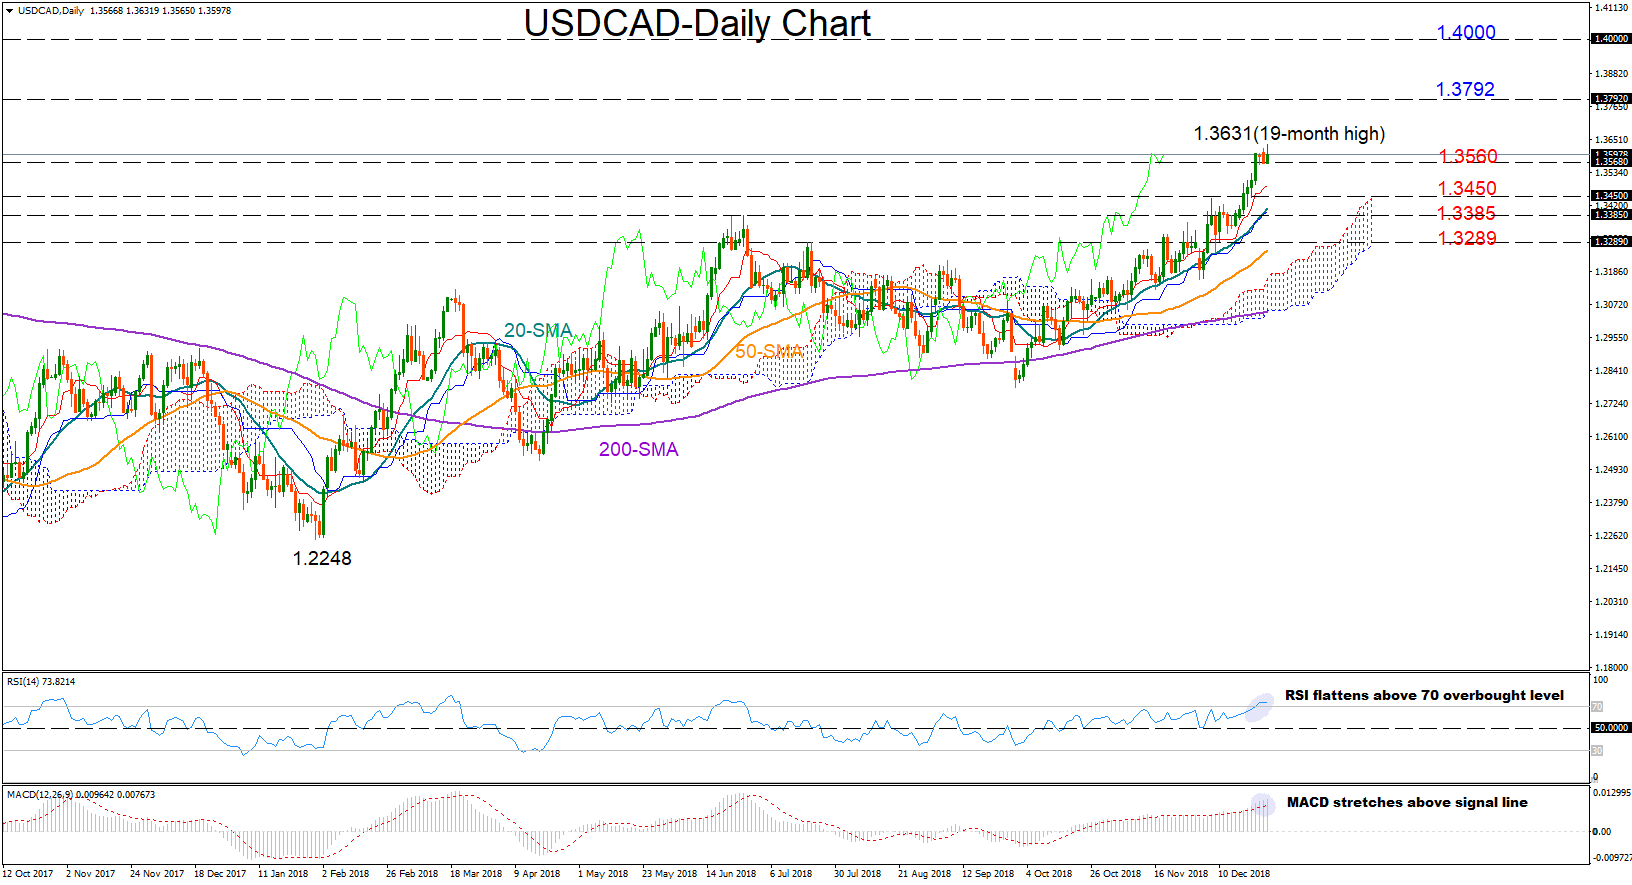
Yen and Swiss Franc are back in control today as risk appetite falters again. Major European indices opened higher but quickly reversed. US futures now also point to lower open. DOW rebounded more 1000pts yesterday but it's set to give back probably more than 400 at open. Today's US consumer confidence data could be a key to stocks.
Commodity currencies are back in pressure again with Australian leading the way down. Dollar is trading softer against Euro and Sterling.
In Europe, at the time of writing:
- FTSE is down -1.11%
- DAX is down -1.95%
- CAC is down -0.32%
- German 10 year yield is down -0.012 at 0.239. We'd like to point out again that excluding the one day spike low at 0.186 in May, it's now at the lowest level since July 2017.
- Italian 10 year yield is down -0.007 at 2.814
Earlier in Asia:
- Nikkei rose 3.88% to 20077.62, back above 20000
- Singapore Strait Times rose 1.12%
- But Hong Kong HSI dropped -0.67%
- China Shanghai SSE dropped -0.61% to 2483.09, now very close to 2449.19 low made in October.
- Japan 10 year JGB yield dropped -0.0039 to 0.023.
US 500 Stock Index Rebounds Sharply, But Outlook Still Negative
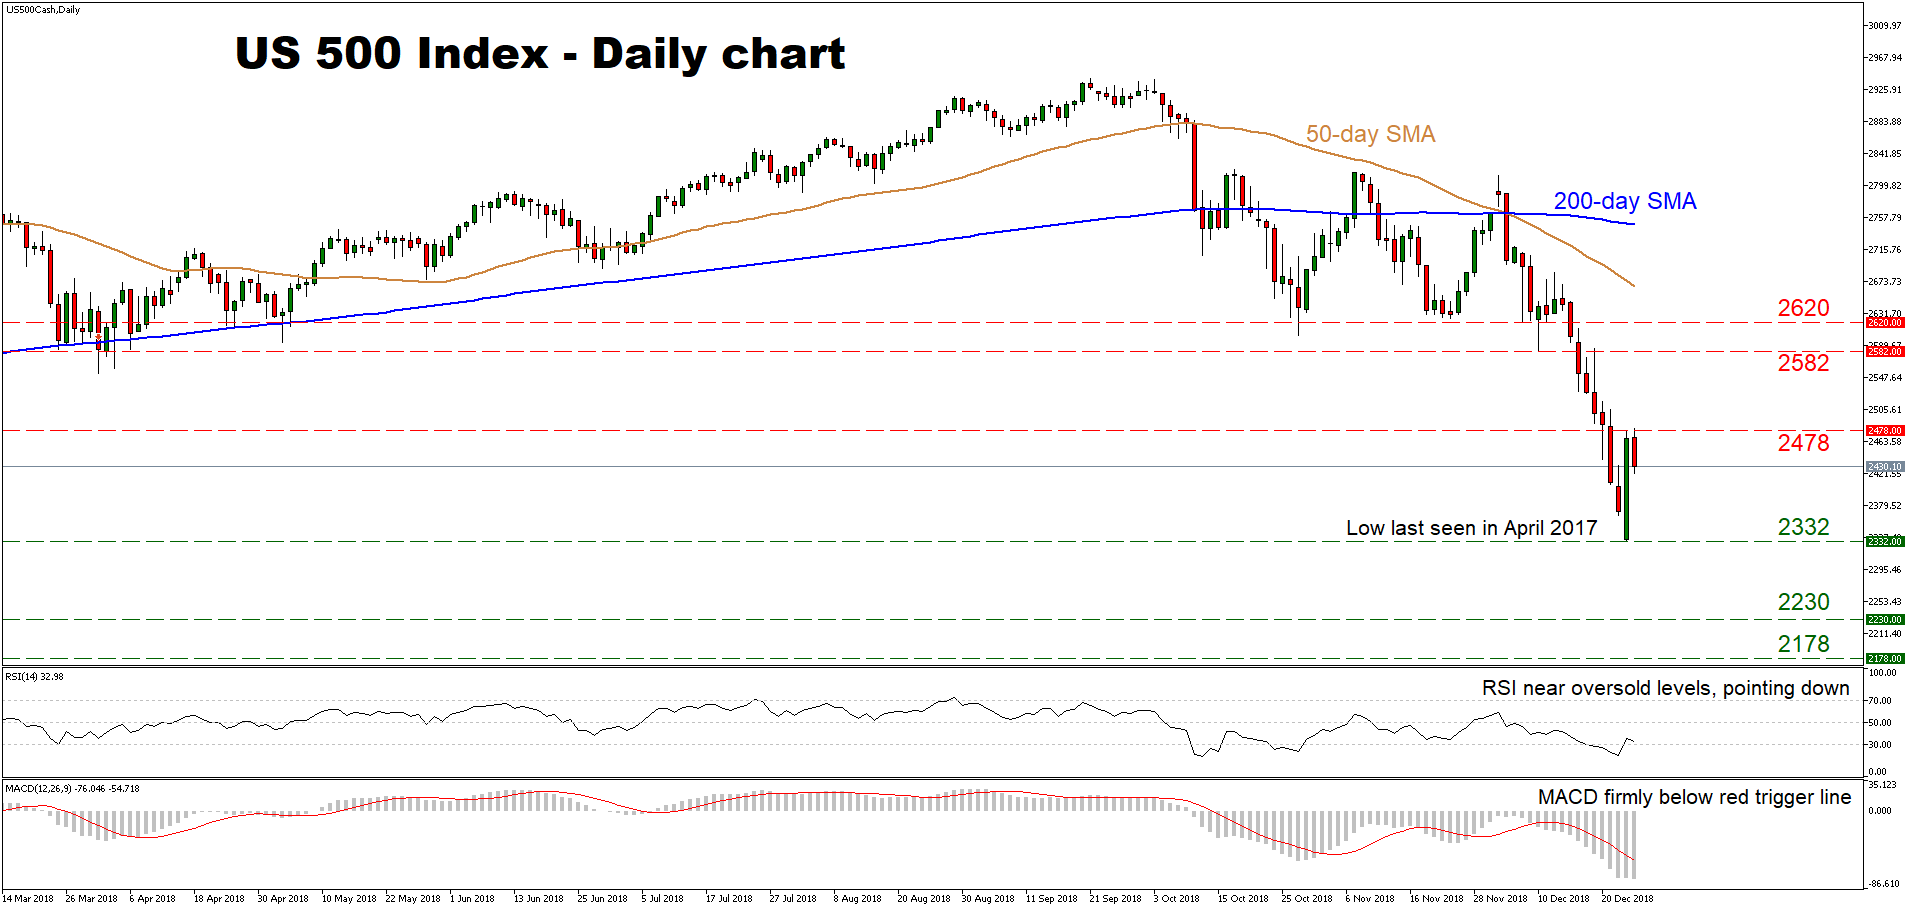
The US 500 stock index posted sizeable gains on Wednesday, after it touched its lowest level since April 2017. Notwithstanding the latest rebound, considering that the price structure on the daily chart consists of lower lows, and that the 50-day simple moving average (SMA) remains firmly below the 200-day one, the bigger picture is still negative.
Short-term oscillators support the notion, as the RSI is pointing down and looks to be headed for a test of its oversold 30 level soon, while the MACD – already negative – rests below its red trigger line.
A fresh wave of declines may stall initially near 2,332, the 1½-year low reached on December 26. A downside violation would mark a fresh low, possibly opening the way for a test of 2,230, this being the bottom of December 30, 2016. Even steeper bearish extensions may encounter support around 2,178, the trough of December 5, 2016.
On the upside, resistance to further recovery may come around the December 26 peak of 2,478. If the bulls pierce above it, the next obstacle could be the 2,582 zone, defined by the lows of December 10, before the December 6 trough of 2,620 comes into view.
Summarizing, the broader outlook still seems decisively bearish.
DAX Slides As U.S Stock Surge Fizzles In Europe
The DAX Index has posted sharp losses in the Thursday session. Currently, the index is at 10,452 down 1.7 percent. There are only a handful of eurozone events this week, with no data indicators on Thursday. The U.S. releases employment claims, which is expected to rise to 217 thousand. On Friday, Germany releases Preliminary CPI, which is expected to improve to 0.3 percent.
The roller-coaster ride for investors continues in the United States. After massive losses on U.S equity markets on Monday, the markets bounced back with sharp gains. The spike spread to Asian markets on Thursday, but has failed to ignite German markets, which have posted strong declines. The DAX is currently at its lowest level since December 2016 and has plunged 9.2 percent in December. This follows a drop of 6.67% in October, so it’s no surprise that risk appetite has dropped sharply.
The sole eurozone indicator on Thursday was the monthly ECB economic calendar. The prognosis was pessimistic, with the bank projecting that global economic activity would soften in 2019. As for the eurozone, the report found that GDP increased by just 0.2% in the third quarter, after growth of 0.4% in the prior two quarters. Weak growth in Europe and the ongoing global trade war has hurt the eurozone manufacturing and export sectors, and is likely to continue to weigh on European equities as we head into the New Year.
EUR/USD – Euro Gains Ground, Investors Eye U.S Jobless Claims
EUR/USD has posted gains in the Thursday session, bouncing back from the losses seen on Wednesday. Currently, the pair is trading at 1.1394, up 0.37% on the day. There are only a handful of eurozone events this week, with no data indicators on Thursday. The U.S. releases employment claims, which is expected to rise to 217 thousand. We’ll also get a look at CB Consumer Confidence, which is forecast to climb to 135.7 points. On Friday, Germany releases Preliminary CPI and the U.S. publishes Chicago PMI and Pending Home Sales.
The turmoil in European and the U.S. equity markets has continued this week, but the euro has remained largely unaffected, showing little net movement this week. The catalyst for the volatility in the markets was the Federal Reserve’s rate statement last week, which received a thumbs-down from investors for being more hawkish than expected. Fed policymakers indicated that the current stance of gradual and incremental rate hikes would continue in 2019, although the Fed dot plot lowered the rate forecast from three rate hikes to two rate hikes.
Investor risk appetite has improved, following reports that a U.S. delegation would travel to China to hold trade talks in the first week of January. The ongoing trade dispute between the world’s two largest economies has caused havoc in the equity markets and boosted the U.S dollar against its rivals. President Trump has agreed to suspend further tariffs on China while the sides are talking. A breakthrough might be to tall an order, but the fact that the sides are meeting face-to-face for the first time in months will likely improve the mood of jittery investors.
EUR/JPY Likely To Edge Lower
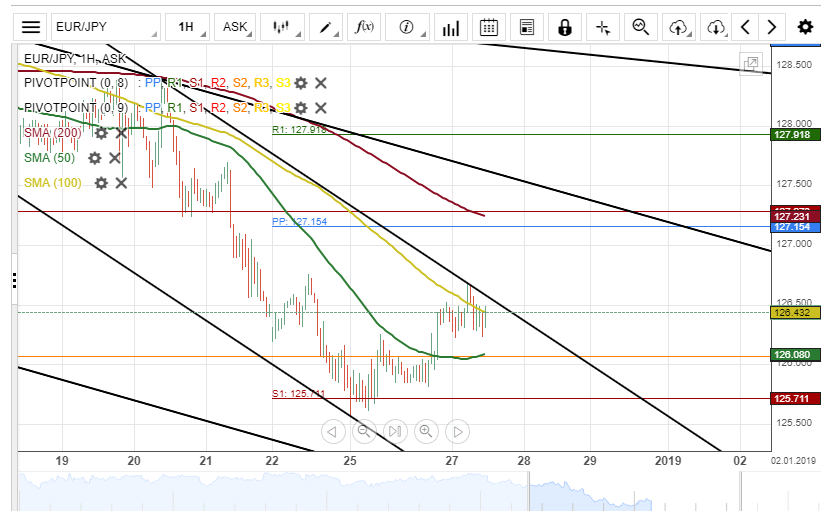
The common European currency appreciated about 70 base points against the Japanese Yen on Wednesday. The currency pair breached the 50– hour simple moving average at 126.05 during yesterday's session.
Everything being equal, it is likely that the currency exchange rate edges lower within this session. The potential downside targets will be near a swing low of 125.75.
Although, a support cluster formed by the combination of the monthly S1 and the 50-hour SMA at 126.05 could prevent the EUR/JPY currency pair from falling today.
AUD/USD Moving Sideways
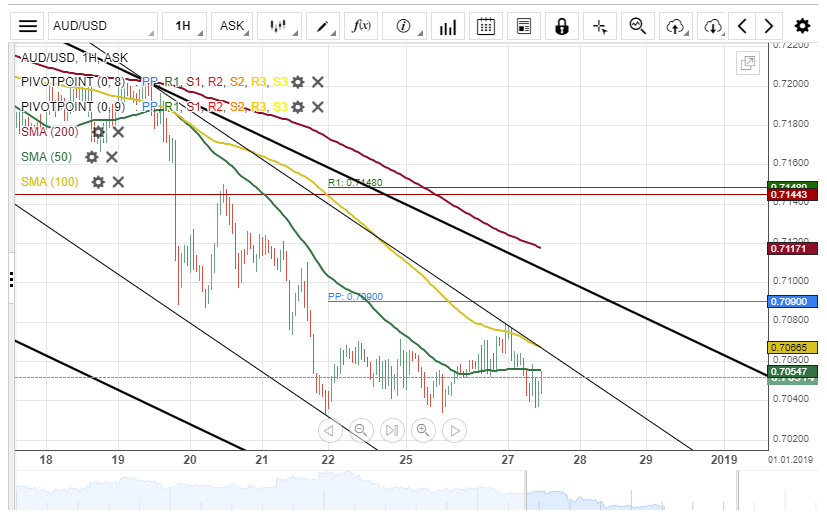
The Australian Dollar traded sideways movement against the US Dollar on Wednesday. The currency pair was moving within a trading range of 0.7077 and 0.7032 during the previous trading session.
Technical indicators suggest that the AUD/USD currency pair will continue its southern movement within this session. If the technical signals are right, the currency exchange rate is likely to dash through the one-week trading range during the following hours.
The possible downside targets will be near a support cluster formed by the weekly and the monthly PPs at 0.6980.
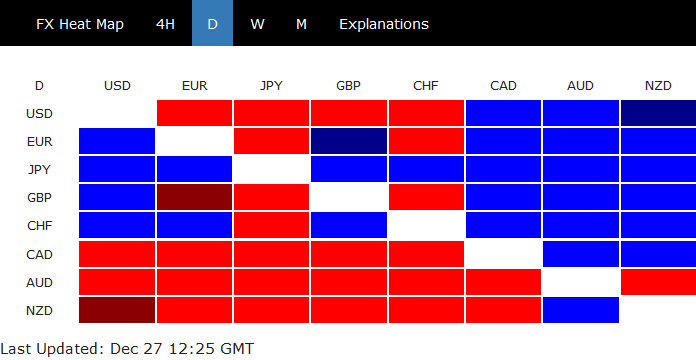
USD/CAD Targets At 1.3680
The US Dollar has been moving sideways against the Canadian Dollar since December 23. The currency pair continued its movement in the narrow range during Wednesday's trading session.
However, the exchange rate broke out from the four days trading range during the European session on Thursday.
As for the near future, it is likely that the currency exchange rate will continue moving in its one-month ascending channel pattern and potentially aim at the upper boundary at 1.3680.