

Sample Category Title
EUR/USD Daily Outlook
Daily Pivots: (S1) 1.1372; (P) 1.1413; (R1) 1.1475; More.....
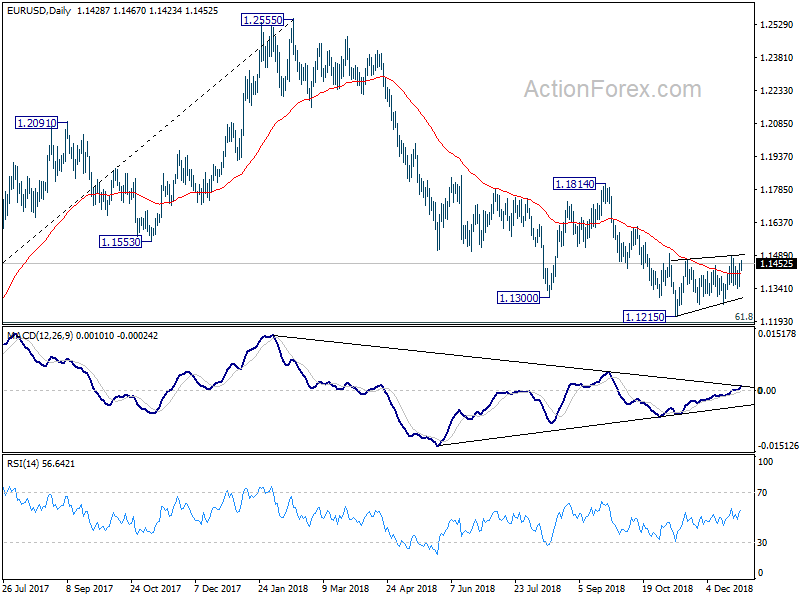
EUR/USD rebounds to as high as 1.1467 so far today but upside is limited below 1.1485 resistance so far. Intraday bias remains neutral first. On the upside, break of 1.1485 resistance will revive the case of near term reversal, on bullish convergence condition in daily MACD. Bias will be turned back to the upside for 1.1621 resistance first. Break will target 1.1814 key resistance next. On the downside, break of 1.1270 will, instead, revive the bearish case that down trend from 1.2555 is still in progress. Bias will be turned back to the downside for 1.1186 key fibonacci level.
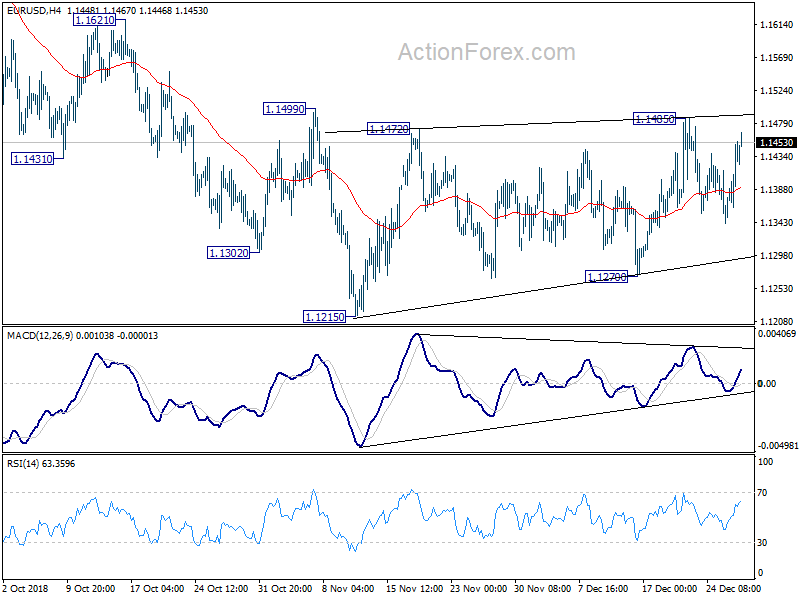
In the bigger picture, as long as 1.1814 resistance holds, down trend down trend from 1.2555 medium term top is still in progress and should target 61.8% retracement of 1.0339 (2017 low) to 1.2555 at 1.1186 next. Sustained break there will pave the way to retest 1.0339. However, break of 1.1814 will confirm completion of such down trend and turn medium term outlook bullish.
Asia Shrugs US Stock Rebound Again, Some Dollar Weakness Before Year End
Despite initial setback, US equities extended the post-Christmas historic rebound overnight. DOW ended up 1.14% to 23138.82. S&P 500 rose 0.86% and NASDAQ added 0.38%. But the improvement in sentiments isn't carried over to Asian session. Nikkei is currently down -0.39%. Hong Hong HSI is just up 0.09% while China Shanghai SSE is up 0.15%. Singapore Strait Times is the better performing one and is up 0.73%. In the currency markets, Dollar is trading as the weakest one for today, followed by Canadian. On the other hand, Yen is so far the strongest one, followed by Swiss Franc. But major pairs and crosses generally held in yesterday's range.
In the bond markets, despite rebound in stocks, US treasury yields weakened again overnight. 10-year yield closed down -0.054% at 2.743. 30-year yield dropped -0.018 to 3.030 after dipping to 3.003. It's still stubbornly holding on to 3% handle. Yield curve remains inverted from 1-year (2.602) to 2-year (2.572) and 3-year (2.562). It should also be noted that Japan 10 year JGB yield is also extending recent decline, down -0.0139 at 0.01 for now.
Technically, AUD/USD and USD/CAD extended recent move but are both losing momentum. Dollar might start to top against the two. Also, EUR/USD will possibly challenge 1.1485 resistance today. USD/CHF is pressing 0.9848 key support again. There is prospect of some Dollar weakness before year-end. Yen crosses, including USD/JPY, EUR/JPY and GBP/JPY are staying in consolidation, with EUR/JPY being the stronger one. But recent decline in these Yen crosses are still expected to resume sooner rather than later.
47% Americans blamed Trump for government shutdown
There is no end in sight to the partial US government shutdown as it enters in the the sixth day. Trump continued to blame the Democrats for "OBSTRUCTION of the desperately needed Wall". White House spokeswoman Sarah Sanders also said yesterday that "the president has made clear that any bill to fund the government must adequately fund border security," without specially mentioning the border wall.
According to a Reuters/Ipsos poll conducted between Dec 21-26, more Americans blamed Trump for the government shut down. 47% said Trump was responsible, 33% said Congressional Democrats and 8% said Congressional Republicans. Meanwhile, 49% said they opposed to funding for the border wall, and only 36% supported it.
BoJ: Global risks tiled to the downside, uncertainties heightened
As shown in the Summary of Opinions at the December 19/20 meeting, BoJ board members sounded more concerned with global developments. The summary noted that "regarding the outlook for the global economy, risks have been tilted to the downside on the whole amid heightening uncertainties and a prevailing view that such situation will be protracted."
Specially, it said "looking at the latest data on trade activities in China, both exports and imports marked negative growth on a month-on-month basis, which possibly indicates a deceleration in the Chinese economy". For Japan, " it cannot be said that the actual condition of restoration-related demand and production stemming from natural disasters has been strong". Also, "recovery in exports to China has been weak, and exports as a whole also have shown weak developments."
BoJ also maintained that "it is necessary to persistently continue with the current powerful monetary easing as the momentum toward 2 percent inflation is maintained." And it warned that "trying to normalize monetary policy prematurely before achieving the price stability target could adversely strengthen the side effects." The summary also noted that long-term yield should be allowed to "temporarily turn negative" and "move upward and downward more or less symmetrically from around zero percent".
On the data front
Japan Tokyo CPI core slowed to 0.9% yoy in December, matched expectations. Unemployment rate rose 0.1% to 2.5% in November. Industrial production dropped -1.1% mom in November versus expectation of -1.6% mom. Retail sales rose 1.4% versus expectation of 2.1%.
Looking ahead, Swiss KOF leading indicator, UK BBA mortgage approvals and Germany CPI flash will be released in European session.
Later in the day, due to partial government shutdown, only Chicago PMI and pending home sales will be release from the US.
EUR/USD Daily Outlook
Daily Pivots: (S1) 1.1372; (P) 1.1413; (R1) 1.1475; More.....
EUR/USD rebounds to as high as 1.1467 so far today but upside is limited below 1.1485 resistance so far. Intraday bias remains neutral first. On the upside, break of 1.1485 resistance will revive the case of near term reversal, on bullish convergence condition in daily MACD. Bias will be turned back to the upside for 1.1621 resistance first. Break will target 1.1814 key resistance next. On the downside, break of 1.1270 will, instead, revive the bearish case that down trend from 1.2555 is still in progress. Bias will be turned back to the downside for 1.1186 key fibonacci level.
In the bigger picture, as long as 1.1814 resistance holds, down trend down trend from 1.2555 medium term top is still in progress and should target 61.8% retracement of 1.0339 (2017 low) to 1.2555 at 1.1186 next. Sustained break there will pave the way to retest 1.0339. However, break of 1.1814 will confirm completion of such down trend and turn medium term outlook bullish.
Economic Indicators Update
| GMT | Ccy | Events | Actual | Forecast | Previous | Revised |
|---|---|---|---|---|---|---|
| 23:30 | JPY | Jobless Rate Nov | 2.50% | 2.40% | 2.40% | |
| 23:30 | JPY | Tokyo CPI Core Y/Y Dec | 0.90% | 0.90% | 1.00% | |
| 23:50 | JPY | BOJ Summary of Opinions | ||||
| 23:50 | JPY | Industrial Production M/M Nov P | -1.10% | -1.60% | 2.90% | |
| 23:50 | JPY | Retail Trade Y/Y Nov | 1.40% | 2.10% | 3.50% | 3.60% |
| 08:00 | CHF | KOF Leading Indicator Dec | 98.8 | 99.1 | ||
| 09:30 | GBP | BBA Mortgage Approvals Nov | 38.9K | 39.7K | ||
| 13:00 | EUR | German CPI M/M Dec P | 0.30% | 0.10% | ||
| 13:00 | EUR | German CPI Y/Y Dec P | 2.00% | 2.30% | ||
| 14:45 | USD | Chicago PMI Dec | 61.2 | 66.4 | ||
| 15:00 | USD | Pending Home Sales M/M Nov | 1.10% | -2.60% | ||
| 15:30 | USD | Natural Gas Storage | -141B | |||
| 16:00 | USD | Crude Oil Inventories | -0.5M |
Rebound Extends Amid Mixed Signals
Another wild day on Wall Street ended with an impressive rebound in stock markets but a concerning dip in consumer confidence. It was the biggest intraday market gain since 2010. The FX market had a more risk-averse takeaway with the Swiss franc leading and Australian dollar lagging. US trade balance is the data point to watch on Friday.
The rollercoaster in US equity markets at what's usually a quiet time of year continued on Thursday. The S&P 500 fell by nearly 3% late in the day then stormed back to close nearly 1% higher. Importantly, Thursday was the final day to settle US equity trades before year-end, meaning that anyone selling for tax reasons needed to do so Thursday. That paradigm may have signaled the 'all clear' for dip buyers, at least for the moment. A hint came earlier in the day as European equities had a late surge to pare losses.
While this was a second small victory for the bulls, there are some fresh concerns about the economy. December consumer confidence fell to 128.1 from 135.7. the consensus was for a dip to 133.7. It's the second data point this week (following the Richmond Fed) that's badly missed estimates.
Still, the picture remains mostly positive in the hard data with initial jobless claims and the FHFA both matching estimates Thursday.
One number to watch on Friday is the US November advance goods trade balance report due at 1330 GMT. The consensus is for a $76.0B deficit and economists are rarely more than $3 billion off the mark but this is an unusual time as tariffs hit. A miss would raise fresh questions about the impact of the trade war.
FX 2019 – USD Peaks, But Not Necessarily Sharply Lower
The consensus forecast that USD’s rally, which began in February this year, is coming to an end hinges on the theses of overvaluation and stretched FX market longs, the slowdown in US economic growth and the end of current tightening cycle. While we are also of the view that the value of the greenback is probably peaking, we do not anticipate a sharp selloff in the coming year. Rather we expect it to fluctuate around high levels as the above-mentioned downside risks are partly offset by the upside risks. The factors supporting the greenback we identified include: above-trend US economic growth despite moderation. Fed’s rate high cycle remains intact despite slower pace and decision more data-dependent, USD’s risk-adjusted return remains attractive to risk averse investors, alongside Japanese yen and Swiss franc.
Market Consensus - USD Weakens Across the Board in 2019
| 4Q18F | 1Q19F | 2Q19F | 3Q19F | |
| EURUSD | 1.1400 | 1.1484 | 1.1708 | 1.1885 |
| GBPUSD | 1.2900 | 1.3201 | 1.3449 | 1.3601 |
| AUDUSD | 0.7285 | 0.7300 | 0.7333 | 0.7434 |
| NZDUSD | 0.6800 | 0.6758 | 0.6804 | 0.6892 |
| USDCAD | 1.3100 | 1.2999 | 1.2867 | 1.2766 |
| USDCHF | 1.0000 | 0.9966 | 0.9867 | 0.9766 |
| USDJPY | 113.00 | 111.83 | 111.09 | 109.82 |
Source: Thomson Reuters (as of Dec 5, 2018)
1. USD’s Overvaluation and Stretched Longs
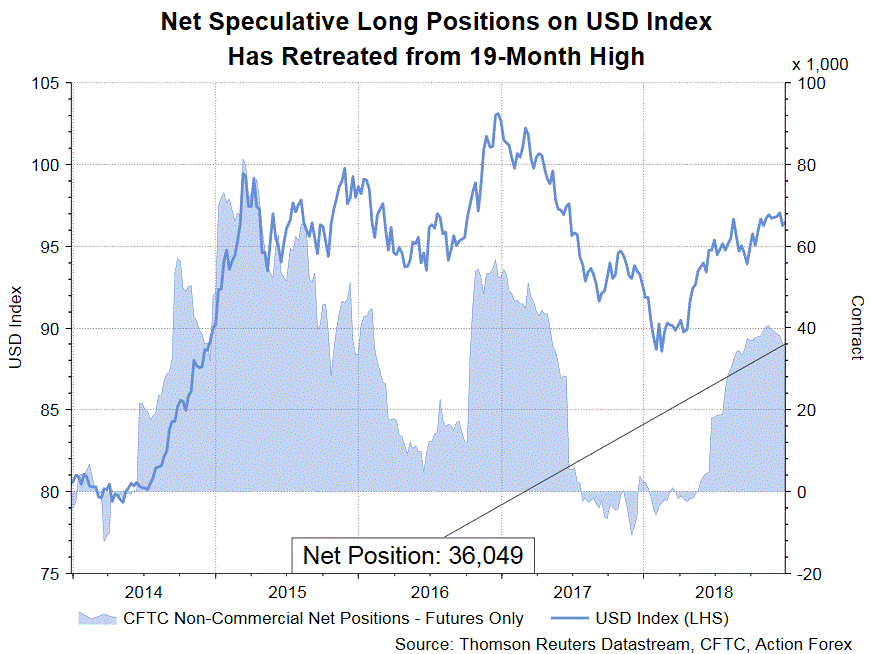
US dollar index (DXY) has gained +3.5% so far this year, after plunging -9.5% in 2017. Currently trading at 96.98, DXY is hovering around the highest level in 18 months. IMF's real effective exchange rate (REER) has also experienced similar price movements. Several models (IMF's REER, OECD's PPP exchange rate and mean reversion) have pointed to the notion that USD is overvalued.
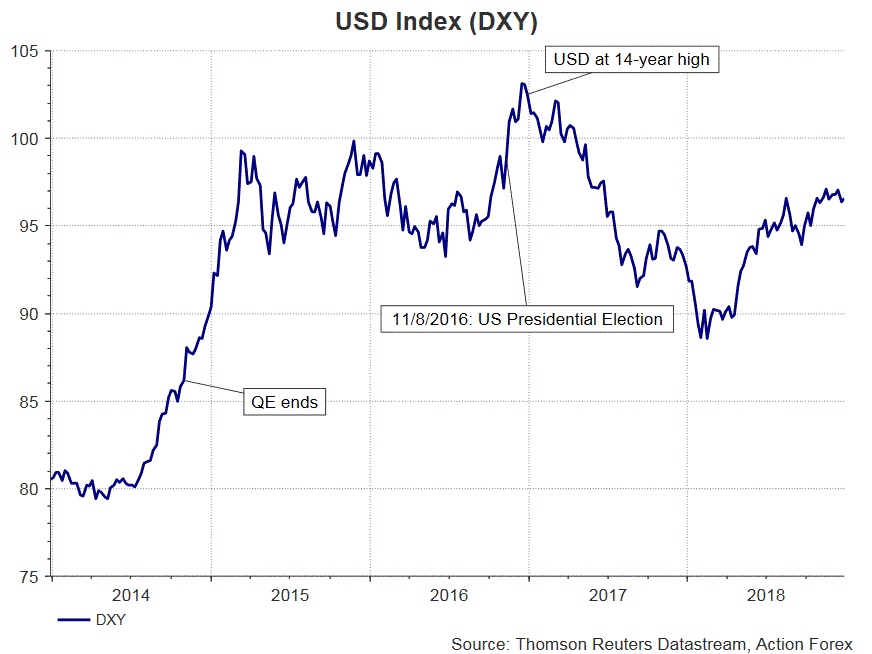
IMF determines the fair value of a country's exchange rate by considering a broad range of external indicators (including the current account, the real effective exchange rate, capital and financial accounts flows and measures, FX intervention and reserves and the foreign asset or liability position). It has been warning of USD's overvaluation since 2015 (on 2014's valuation). However, the DXY index continued to rise in both 2015 and 2016. Others suggested that the greenback is overvalued as its current value is about +10% higher than the 10-year average. Such a mean-version model believes that prices will revert back towards the mean or average over time.
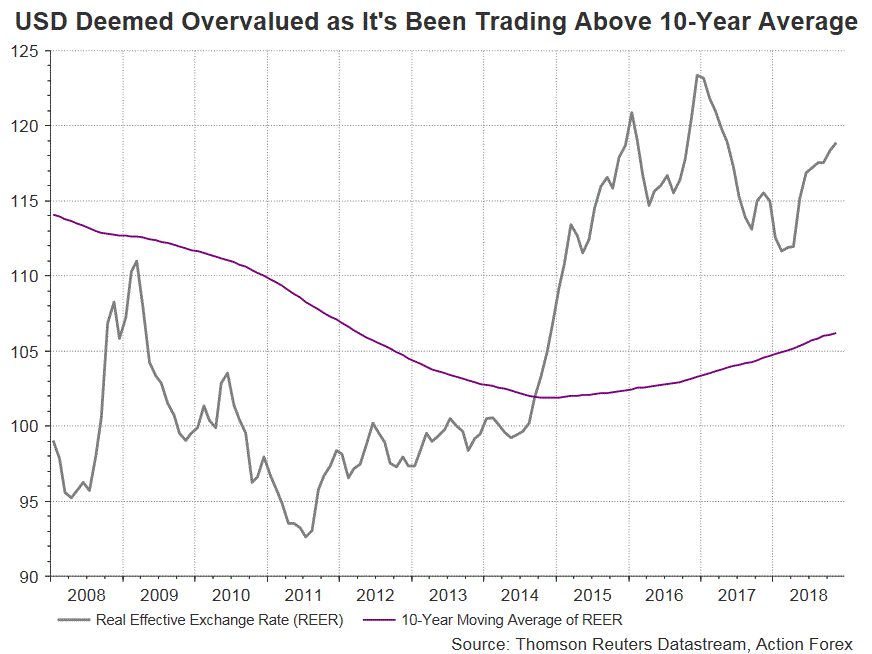
The PPP model argues that exchange rates adjust to reflect the price differential between countries, so inflation differentials drive nominal exchange rates. While this might be true in the long-run, the actual exchange rate can derail from the "fair value" persistently in the short-run (several years). Moreover, this model, as well as the mean reversion model, assumes that the exchange rate would eventually return to a fixed, steady average level. However, this might not be true since exchange rate movements are driven by a many variables which are not necessarily logical.
Data from CFTC's commitments of trader shows that the non-commercial net long positions for USD index have soared to 40 513 contract on the week of November 15, highest since the week of April 27, 2017. Some have raised concerns that the selloff of the greenback would be severe if traders unwind their positions.
2. Entering Late- Expansion Stage: Growth Slows but Stays Above Trend
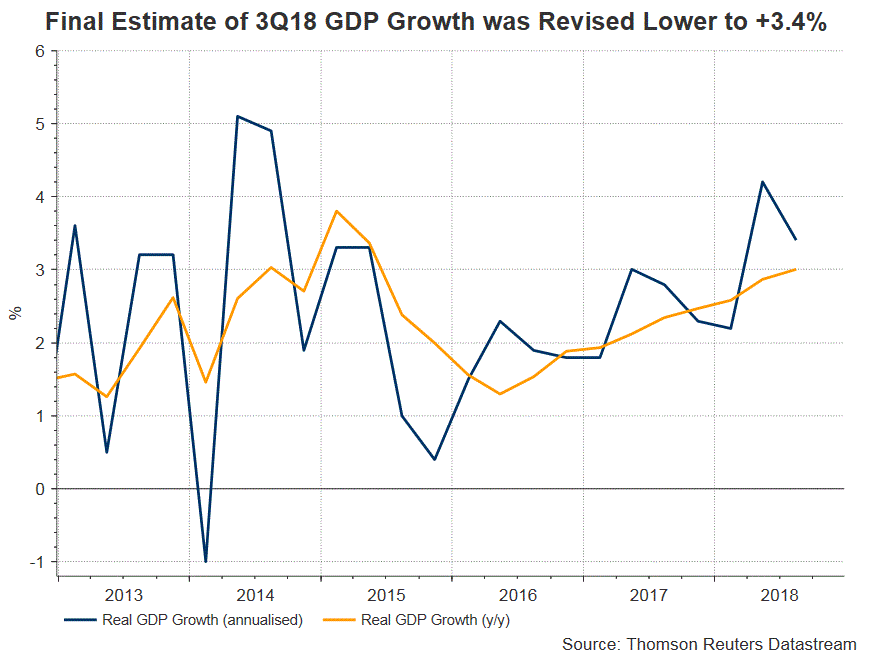
There is remote chance of US recession in 2019 and 2020. We see the US has entered the “late expansion” stage of the economic cycle. Moderating growth, monetary tightening, tightening credit, rising wages are common features in this stage. During this stage, unemployment rate would fall further while inflation should continue to improve, as both are lagging indicators. The final estimate of 3Q18 GDP growth was revised -0.1 percentage point lower to 3.4%. This remains a strong figure despite the moderation from the 4-year high of +4.1% in 2Q18. Growth in the second and third quarters was mainly a result of fiscal stimuli, the impact of which would fade in the fourth quarter and, more remarkably, in 2019. Therefore, the market expects growth in 4Q18 would ease further to +2.6%. According to Fed’s latest forecasts, growth would decelerate to +2.3% in 2019, then to +2% in 2020, still higher than the longer-term, neutral growth rate of +1.9%.
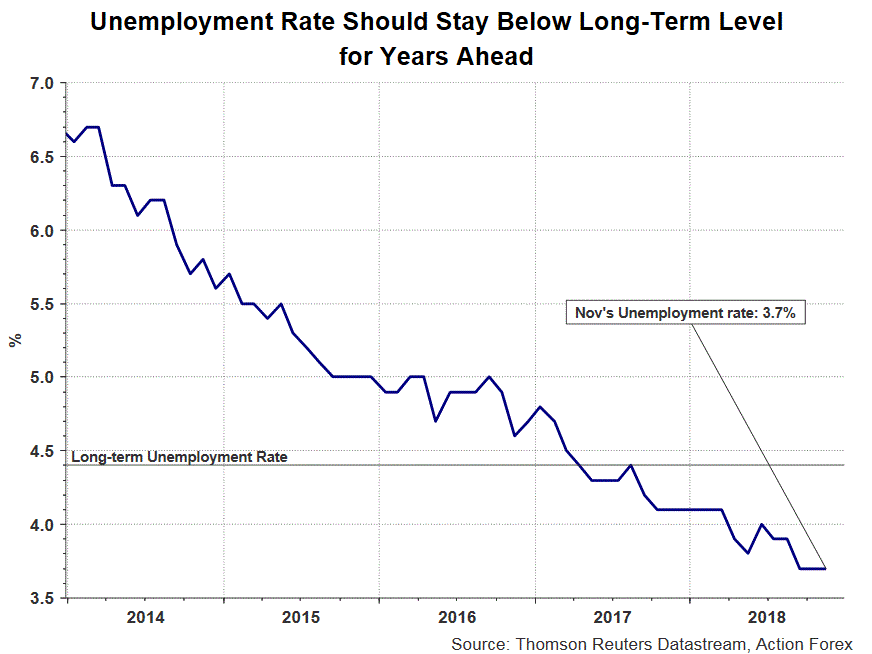
In our opinion, recession risks remain low as US consumers continue to benefit from improved job conditions. US unemployment rate stayed at decades’ low of 3.7%. Ted Fed expects it would bottom at 3.5% next year. Tighter labor markets would put upward pressure on wages. Yet, this would be a headwind for corporate profit margins, together with other factors of slower global growth, stronger dollar, and the fading impact of tax cuts.
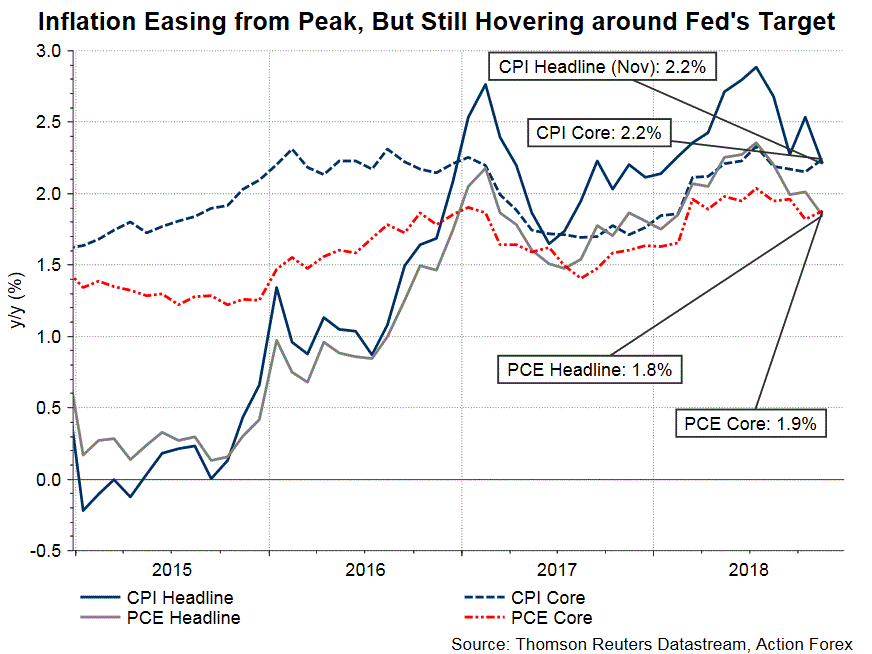
Inflation should improve further during the last expansion stage, amid higher wage and consumer spending. According to the Fed, its preferred inflation gauge, PCE, should reach +1.9% in 2019, before improving to +2.1% in both 2020 and 2021. Excluding volatile items (food and energy), core inflation would steady at +2% over the coming three years.
3. Rate- Hike Path More Data- Dependent
Slowdown in US (and global) economic growth and dissipating impacts of fiscal stimulus on the economy suggest fewer rate hikes would be needed in the coming year. The median dot plot in the December FOMC meeting shows that there would be two rate hikes in 2019, down from three projected in September. Meanwhile, the neutral rate is also revised lower to 2.75%, from 3%. All these appear supportive to USD bear, as conventional wisdom suggests that capitals seek to flow to higher-yield currencies.
However, as we mentioned in our review, the Fed was not as dovish as previously anticipated. While the members have “seen some developments that signal some softening”, they believed that these “developments have not fundamentally altered the outlook”. The downward revisions made on the economic projections were modest while the change in forward guidance was subtle. Although many had expected the Fed to remove the language of “further gradual increases” in interest rates in the forward guidance, such wordings were retained with the word” some” added on the front.
Monetary policy should remain tight during a late-expansion stage. It is prudent for the Fed continue raising the policy rate to accomplish its dual mandate of price stability, and sustainable and maximum employment. According to the Fed’s own projections, inflation would hover around its +2% target, while the unemployment rate would stay way below the long term target of +4.4% for some years. Strong job market would continue to put pressure on wage growth which, at +3.1% y/y in both October and November, has been at the fastest pace in almost 10 years. The underlying fundamental should still support further increases in the policy rate.
4. Safe Haven Asset
Alongside policy divergence and stimulus-induced economic growth, safe-haven demand is a factor driving USD’s strength in 2018. US-China trade war, Brexit uncertainty, political turmoil in the Eurozone and unrests in some emerging economies have restrained risk appetite, leading many to seek safe investments. USD strengthened against major currency in 2018, with the exception of Japanese yen and Swiss franc. With global economy expected to slowdown and geopolitical uncertainty yet to be resolved, risk appetite will more likely than not diminish in the coming year. This might support traditional safe-haven assets of JPY and CHF, as well as USD.
Both JPY and CHF are good candidates in carry trades (a strategy in which an investor borrows money at a low interest rate and invest in an asset that is likely to provide a higher return) due to their low yields. Their values, hence, strengthen during periods of risk aversion as traders square their carry trade positions and repay their borrowed money. With the Fed in a rate hike cycle over the past few years, investors might not find it a bargain to borrow USD in carry trade. Yet, USD is the world’s largest reserve currency, the US economy stays the comfortably at the world’s biggest and US still possesses the world’s largest bond markets. The greenback still offers lucrative risk-adjusted return.
BoJ: Global risks tiled to the downside, uncertainties heightened
As shown in the Summary of Opinions at the December 19/20 meeting, BoJ board members sounded more concerned with global developments. The summary noted that "regarding the outlook for the global economy, risks have been tilted to the downside on the whole amid heightening uncertainties and a prevailing view that such situation will be protracted."
Specially, it said "looking at the latest data on trade activities in China, both exports and imports marked negative growth on a month-on-month basis, which possibly indicates a deceleration in the Chinese economy". For Japan, " it cannot be said that the actual condition of restoration-related demand and production stemming from natural disasters has been strong". Also, "recovery in exports to China has been weak, and exports as a whole also have shown weak developments."
BoJ also maintained that "it is necessary to persistently continue with the current powerful monetary easing as the momentum toward 2 percent inflation is maintained." And it warned that "trying to normalize monetary policy prematurely before achieving the price stability target could adversely strengthen the side effects." The summary also noted that long-term yield should be allowed to "temporarily turn negative" and "move upward and downward more or less symmetrically from around zero percent".
47% Americans blamed Trump for government shutdown
There is no end in sight to the partial US government shutdown as it enters in the the sixth day. Trump continued to blame the Democrats for "OBSTRUCTION of the desperately needed Wall". White House spokeswoman Sarah Sanders also said yesterday that "the president has made clear that any bill to fund the government must adequately fund border security," without specially mentioning the border wall.
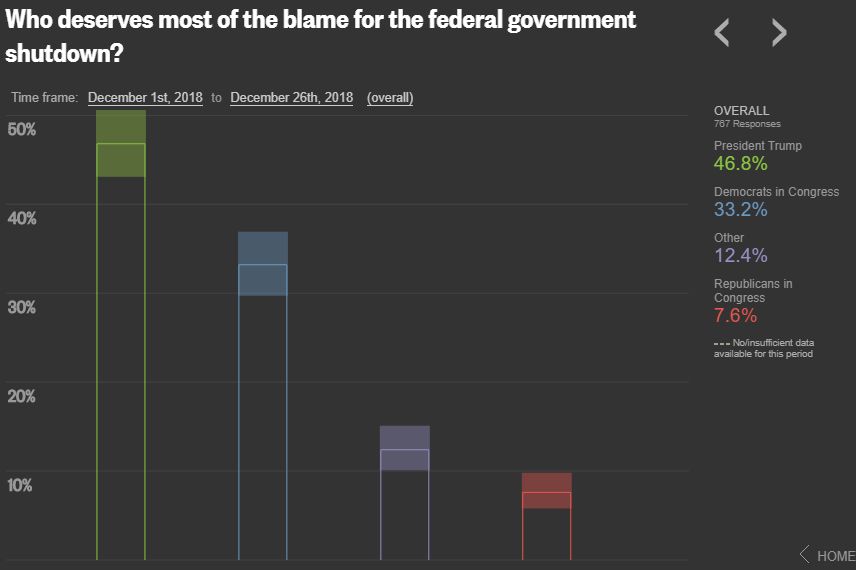
According to a Reuters/Ipsos poll conducted between Dec 21-26, more Americans blamed Trump for the government shut down. 47% said Trump was responsible, 33% said Congressional Democrats and 8% said Congressional Republicans.
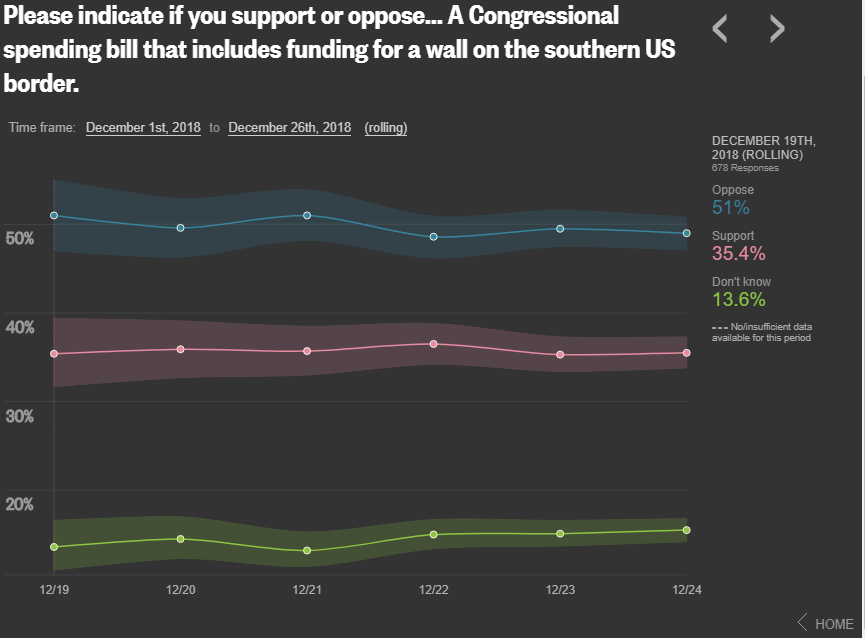
Meanwhile, 49% said they opposed to funding for the border wall, and only 36% supported it.
GOLD Gaining Momentum While Oil Stays Bearish
Gold price started a solid upward move from the $1,238 low and broke the $1,260 resistance. Crude oil price remains in a downtrend and it could decline below $43.00 in the near term.
Important Takeaways for Gold and Oil
- Gold price gained a lot of bullish momentum above the $1,270 resistance against the US Dollar.
- There is a major ascending channel with support at $1,269 on the hourly chart of gold.
- Crude oil price is struggling to move past the $46.00 and $47.00 resistances.
- There is a key bearish trend line formed with resistance at $46.20 on the hourly chart of XTI/USD.
Gold Price Technical Analysis
Gold price remained a significant uptrend and it started a solid upward move from the $1,238 swing low against the US Dollar. The price broke the $1,240 and $1,255 resistance levels to enter a medium term uptrend.
There was a proper close above the $1,260 resistance and the 50 hourly simple moving average. The price climbed above the $1,270 and $1,275 resistance levels. A high was formed at $1,279 and later the price corrected lower.
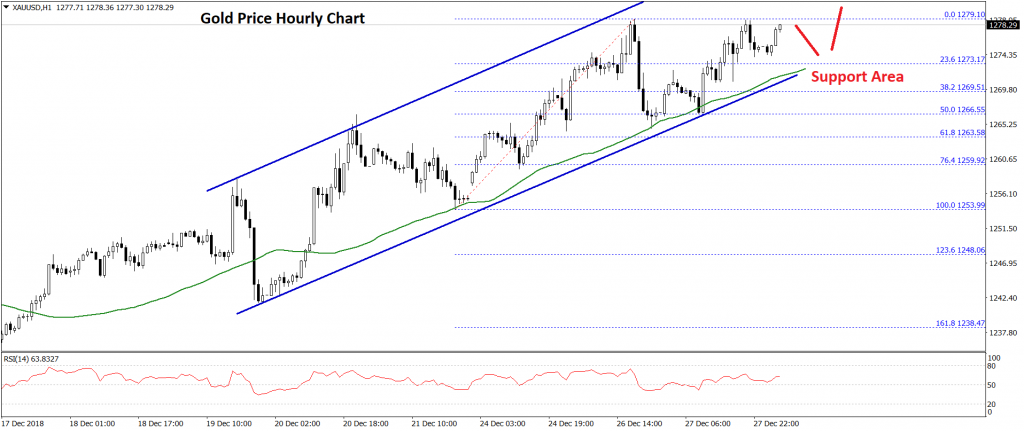
Sellers pushed the price below the $1,270 level and the 38.2% Fib retracement level of the last wave from the $1,253 low to $1,279 high. However, the price found support near the $1,265 level.
More importantly, there is a major ascending channel formed with support at $1,269 on the same chart. Besides, the 50% Fib retracement level of the last wave from the $1,253 low to $1,279 high. Should there be a downside break below the $1,266 and $1,265 support levels, there could be a strong downward move towards the $1,260 support.
On the upside, there is a major resistance at $1,279-$1,280, above which the price could move towards the $1,285 and $1,290. The next major resistance is near the $1,300 level.
Oil Price Technical Analysis
Crude oil price declined further below the $47.00 and $45.00 support levels against the US Dollar. The price even broke the $44.00 support level and traded towards the $42.00 level.
A low was formed at $42.11 and later started an upward move. The price jumped above the $45.00 and $46.00 resistance levels. However, the price struggled to clear the $47.00 barrier. Besides, there is a key bearish trend line formed with resistance at $46.20 on the hourly chart of XTI/USD.
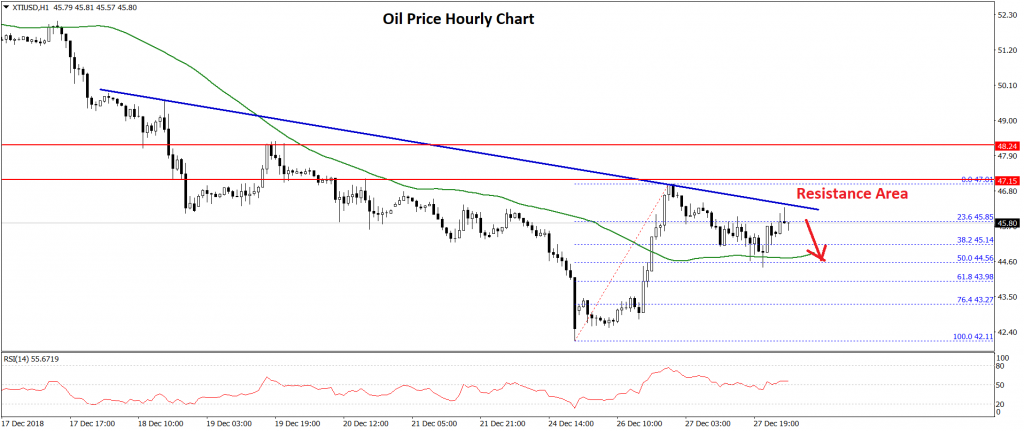
The price is moving lower and it already broke the $45.00 support plus the 38.2% Fib retracement level of the recent wave from the $42.11 low to $47.01 high. If the price continues to move down, there could be more losses below the $43.00 support.
An intermediate support is near the $43.20 and the 76.4% Fib retracement level of the recent wave from the $42.11 low to $47.01 high. Any further losses are likely to lead the price towards the $42.00 and $40.00 levels.
The overall market sentiment is still bearish for crude oil and it seems like there could be a downside extension below the $44.00 and $43.00 support levels. On the upside, the main barrier for buyers is near the $46.00 and $47.00 levels, above which there could be the start of an upward move.
US stocks extended historic rebound, but no follow through in Asia, Yen pares loss
After initial weakness, US indices reversed and resumed the post Christmas historic rebound. DOW ended up 260pts or 1.14% at 23138.82. S&P 500 rose 0.86% while NASDAQ gained 0.38%. Asian markets are mixed though. At the time of writing, Nikkei is down -0.47%, Hong Kong HSI is up 0.10%, China Shanghai SSE is up 0.38% and Singapore Strait Times is up 0.74%.
In the currency markets, Dollar and Canadian are the weakest ones for today so far. Yen is trading to pare back some of yesterday's losses and is the strongest one for the moment.
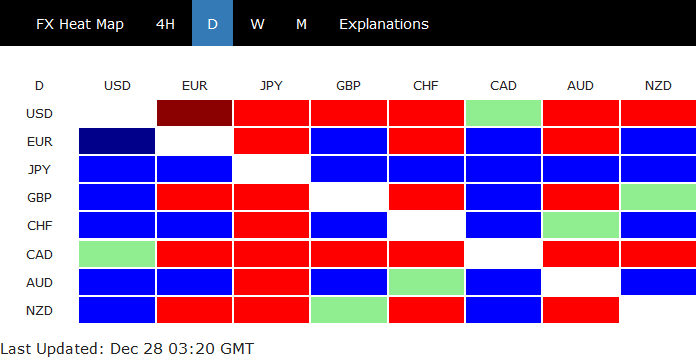
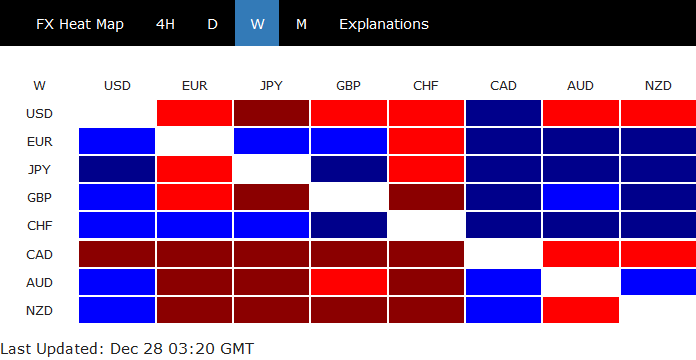
For the week, Canadian Dollar is overwhelmingly the weakest one. Dollar, Aussie and Kiwi are also among the weakest. On the other hand, Swiss Franc and Euro are the strongest, followed by Yen.
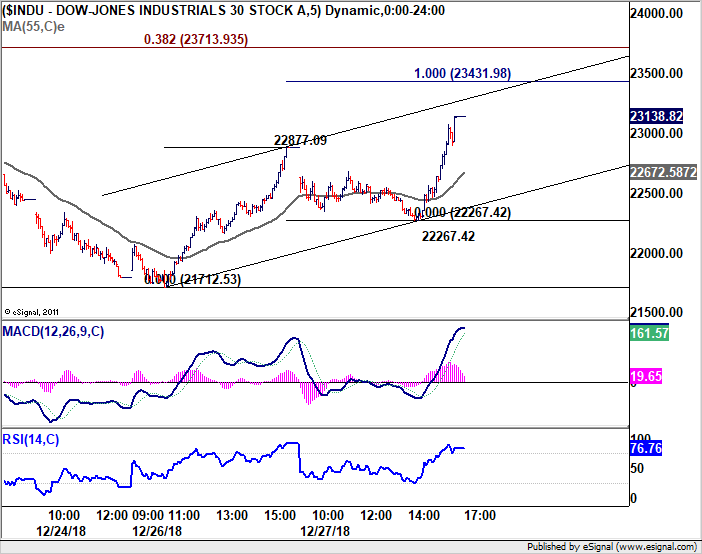
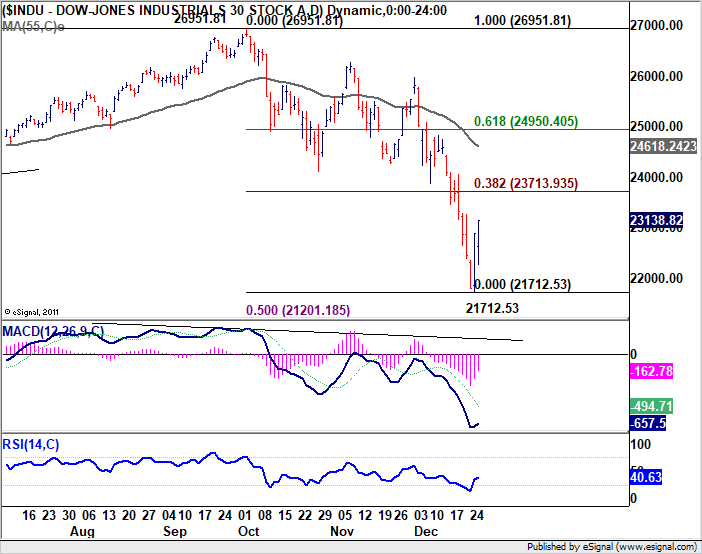
The key for DOW will lie in the resistance zone between 100% projection of 21712.52 to 22877.09 from 22267.42 at 23431.98, and 38.2% retracement of 26951.81 to 21712.53 at 23713.93. Failure to break through this zone decisively will keep the rebound rebound 21712.53, corrective in nature, and a relatively short one.
USD/JPY Remains In Downtrend Below 112.00
Key Highlights
- The US Dollar struggled to recover above the 111.40 level and declined against the Japanese Yen.
- There is a crucial bearish trend line in place with resistance at 111.50 on the 4-hours chart of USD/JPY.
- The US Housing Price Index in Oct 2018 increased 0.3% (MoM), more than the last +0.2%.
- Today in the US, the New Home Sales figure will be released, which is forecasted to rise 2.9%.
USDJPY Technical Analysis
The US Dollar started a major downside move from the 113.60 swing high against the Japanese Yen. The USD/JPY pair declined below the key 112.25 support to enter a bearish zone.
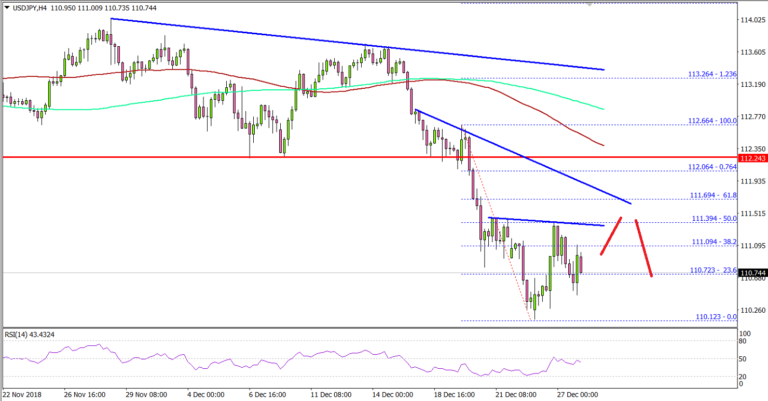
Looking at the 4-hours chart, the pair recently declined from the 112.66 high and traded below the 112.25 and 112.00 support levels. The pair even broke the 111.00 support and it is currently well below the 100 simple moving average (red, 4-hours).
The recent swing low was formed at 110.12 before the pair started an upward move. It traded above the 111.00 level, but it struggled to break the 50% fib retracement level of the last decline from the 112.66 high to 110.12 low.
More importantly, there is a crucial bearish trend line in place with resistance at 111.50 on the 4-hours chart of USD/JPY. A successful break above the trend line could push the pair towards the 112.00 resistance zone.
An intermediate resistance is 111.70 and the 61.8% fib retracement level of the last decline from the 112.66 high to 110.12 low. On the downside, an initial support is at 110.15, below which there is a risk of a sharp decline below the 110.00 support in the near term.
Looking at major pairs, EUR/USD and GBP/USD recovered slightly this week, but upsides were limited.
Economic Releases to Watch Today
- German Consumer Price Index for Dec 2018 (Prelim) (YoY) – Forecast +1.9%, versus +2.3% previous.
- German Consumer Price Index for Dec 2018 (Prelim) (MoM) – Forecast +0.3%, versus +0.1% previous.
- US New Home Sales for Nov 2018 (MoM) – Forecast +2.9% versus -8.9% previous.
- US Pending Home Sales for Nov 2018 (YoY) – Forecast -0.7%, versus -2.6% previous.
Battling The Ticker Tape
Battling the Ticker Tape
Investors are back fighting the tape after yesterday’s biggest stock market rally in nearly a decade fizzled, but this rollercoaster ride is unlikely to stop anytime soon as investors continue to wear emotions on their sleeve.’
And while it could be argued that the pre-Xmas sell-off has been extreme and unwarranted, but fundamentals count for little as in the “Bohemian Rhapsody” type of market conditions. ” nothing really matters” other than pure momentum plays.
Doing battle against an unsteady S&P is proving difficult for investors during this holiday season as selloffs were getting little pushback from big institutional traders who have closed shop for the year and those that are still in the game find it much easier to trade the exaggerated daily trends, up or down, in holiday-thinned liquidity conditions.
It’s not only the tape investors are battling, but it’s weaker economic data, yield curve interpretations and the noise out of DC which will get nastier when in late January the Democrats officially take office.
It’s incredible just how harmful markets veer when sentiment slides. It appears little can be done as weaker economic data will trigger disproportionate downside moves and reassuring statements from the US administration or the Fed will be perceived as a sign of weakness and will unleash new waves of selling all the while investors remain horrified of the yield curve shape.
But keep in mind that when markets start trading off the frenzy factor, as we’ve seen during the last 24 hours, extreme market moves can cut both ways as exhibited by the bullish flip on the S&P into the bell today as the market erased a 600-point tumble in another emotionally charged session.
Rebalancing Act??
However, such a profound move out of bonds and into equities suggests a high probability of year-end rebalancing. We’ve been keeping our eye on this as reports were floating that pension funds would move $63 billion out of bonds as Funds has a strategy of taking profit on the best performers while rebalancing target positions with assets that do the worst at the end of the quarter.
Indeed a 3% recovery on the S&P in short order coupled with a chunky sell-off on bonds has all the hallmarks of year-end rebalancing.
The US-China tensions
Of course, the trade war narrative is never far from investors minds. Overnight Reuters reported, citing three sources familiar with the situation, that President Donald Trump is considering an executive order to ban U.S. companies from using equipment built by Chinese firms Huawei and ZTE. With the end of 90-day tariff moratorium looming ominously on the horizon, this announcement is yet another bump in the rocky path to a trade resolution.
Economic Data
The latest fall in the Conference Board Consumer Confidence Index could not have come in at the worst time. And while the data, which is backwards-looking, was collected during a panic parade as fears of an economic slowdown were getting pumped everywhere, but it supports the argument that investors sentiment remain fragile and weaker economic data will trigger disproportionate downside moves. Although most everyone does not believe a 2019 recession is at hand, the tumbling equity markets could be the harbinger of doom none the less as businesses cutback anticipating further consumer stress due to the markets feedback loop.
While in Asia, there was more gloom in China as industrial profits suffered the first annual loss in 3 years and confirming what we all are expecting that growth of the world’s second-largest economy will slow further in the fourth quarter from the decade-low GDP rate of 6.5 per cent in the third quarter. But potentially more damning is China manufactures could reduce near-term capital expenditures further cooling the economy.
Given the tail risk for China’s economy remains substantial, Mainland economic growth could be the most significant risk in 2019
Yield curve chatter
The Fed does not believe yield curve inversion is predicting a US recession. But the recent Blog posted on the St Lois Fed website is some interesting food for thought despite this being the landing page of the most dovish Fed member of them all, James Bullard
St Louis Fed Blog
Convincingly, it argues “Researchers have found that the economy tends to slow after banks tighten their lending standards, suggesting that an inversion of the yield curve could cause economic activity to slow by leading banks to reduce the supply of loans. Thus, an inverted yield curve might do more than predict a recession: It might cause one.” Indeed, it does suggest banks will be less likely to borrow short term, which is usually the cheapest part of the yield curve and lend longer dates.
Oil Markets
Oil prices have staged a late afternoon rally tracking an impressive rebound on US stocks after wallowing below the critical $45 much of the session. Early selling action was triggered after much weaker than expected US consumer confidence data sent US equity markets for a tumble. But despite equity market roaring back late afternoon, oil prices laggard as the oil traders remain concerned with persistent prospects of slowed economic growth, particularly after the weaker China industrial profits data, coupled with the expectation of strong U.S. production in the new year.
Speaking of US production, in another blow to sentiment a surprise inventory build has capped this afternoons oil price recovery and could push prices lower in Asia as traders try to navigate this perilous week in the oil patch.
We continue to get moral suasion from OPEC, but its falling on deaf ears as oil prices remain inextricable from global risk sentiment at this point.
Also, Asia Oil liquidity took a bit of a hit, as if holiday thinned-trading conditions we not bad enough after traders at Unipec, one of China’s biggest traders were suspended due to excessive trade losses, yet another causality of the violent swings on oil markets
Gold Markets
Despite the late afternoon recovery in US equities, gold holds near its highest level in six months as investors are weighing the plenitude of risks heading into the new year. Indeed, there’s an extensive laundry list of concerns Trump berating the Fed, Trade Wars, China slowing growth, Brexit casualties, EU slowdown. But when you factor in a possible downswing the US economy in 2019, this is when things get ugly and why gold remains so alluring.
The market continues to view Gold as a viable hedge entering 2019 m where markets are expected struggle given the extremely shaky footings.
Currency Markets
USD underperformed dearly on Thursday, giving rise to carry currency appeal. USDJPY traded down towards 110.50 until US equities staged a sharp recovery on dip demand which saw Dollar Yen pare declines back to the familiar 111 level
FX markets are getting whipped around by year-end positioning amidst poor liquidity. And the discussion has centred on the Fed outlook (St Louis Blog) while mulling over an unexpected fall in US consumer confidence. But overall most traders have their finger to the wind doing little more than trading smalls on the back of equity markets swings.
Malaysian Ringgit
Currency carry appeal has the Ringgit trading on better footing as the markets continue to debate the next Fed move as a growing chorus of support suggest the Fed will be on hold until mid-2019 at least. A more dovish Fed will lend support to growth assets and carry trade, and the Ringgit should benefit on both front.
Oil prices continued to be a concern but by all accounts, we are nearing a floor, and with more stimulus likely to come in the form of more aggressive tax cuts out of China, the commodity will likely benefit which is also supportive of the Ringgit.
But liquidity remains very thin which is dissuading investors from reengaging, so caution should be exercised in holiday-thinned markets