Sample Category Title
Euro Trading Higher In The Asian Session
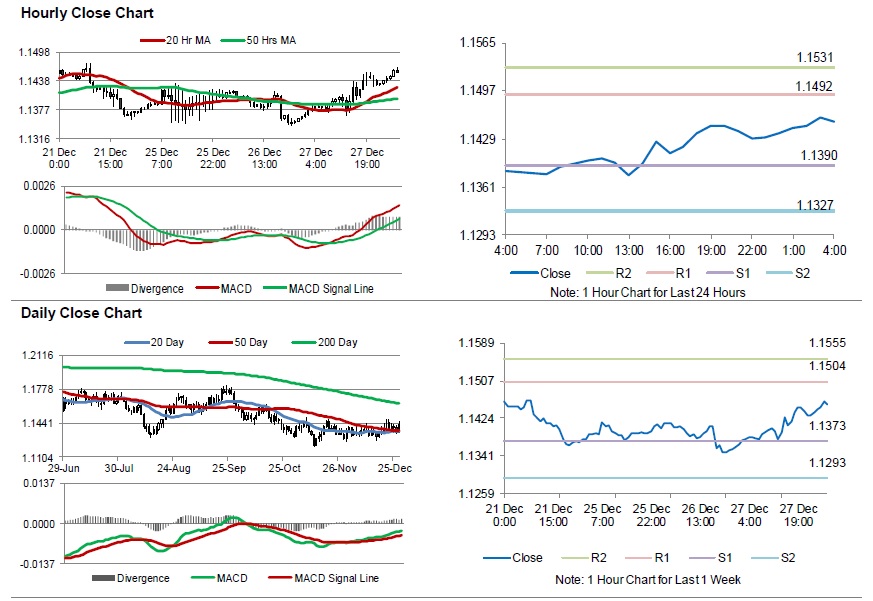
For the 24 hours to 23:00 GMT, the EUR rose 0.46% against the USD and closed at 1.1431.
The European Central Bank’s (ECB), in its monthly economic bulletin, indicated that significant monetary policy stimulus is still required, in light of increased downside risks to the economic growth. Further, the ECB hinted that global economy activity is expected to decelerate in 2019 and stabilise thereafter. Additionally, the bank expects global inflationary pressures to rise slowly.
In the US, data indicated that the US consumer confidence index slid to a level of 128.1 in December, declining to its lowest level in five months, amid mounting worries over global economic outlook. In the prior month, the index had registered a revised level of 136.4, while market participants had anticipated for a fall to a level of 133.5.
On the other hand, the nation’s housing price index climbed 0.3% on a monthly basis in October, meeting market expectations. In the previous month, the index had recorded a rise of 0.2%. Moreover, the seasonally adjusted initial jobless claims fell to a level of 216.0K in the week ended 22 December 2018, in line with market expectations and compared to a revised level of 217.0K in the preceding week.
In the Asian session, at GMT0400, the pair is trading at 1.1454, with the EUR trading 0.20% higher against the USD from yesterday’s close.
The pair is expected to find support at 1.1390, and a fall through could take it to the next support level of 1.1327. The pair is expected to find its first resistance at 1.1492, and a rise through could take it to the next resistance level of 1.1531.
Looking forward, investors will closely monitor Germany’s consumer price index for December, set to release later in the day. Later in the day, the US Chicago purchasing managers’ index for December along with advance goods trade balance and pending home sales data, both for November, will be on investor’s radar.
The currency pair is trading above its 20 Hr and 50 Hr moving averages.
British Pound Reverses Its Losses In The Morning Session
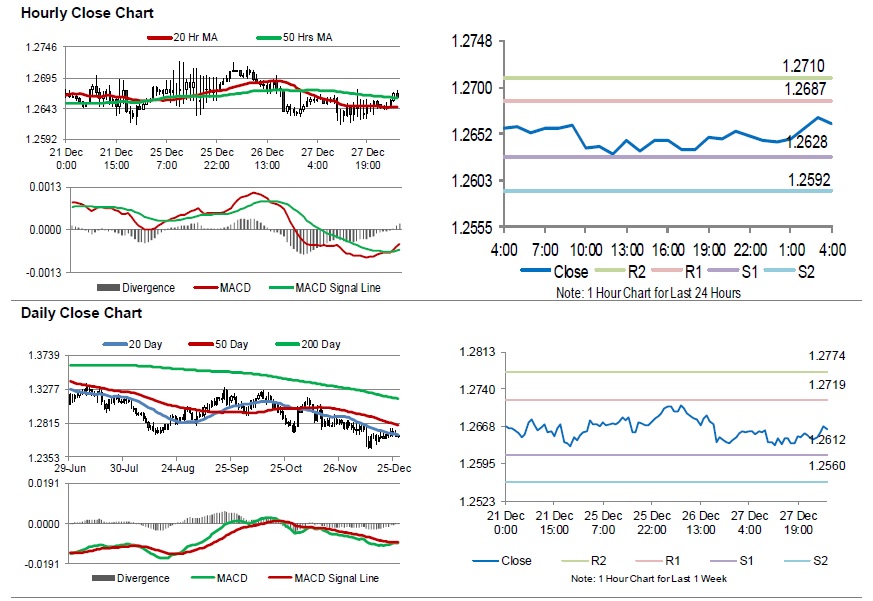
For the 24 hours to 23:00 GMT, the GBP declined 0.09% against the USD and closed at 1.2645.
In the Asian session, at GMT0400, the pair is trading at 1.2663, with the GBP trading 0.14% higher against the USD from yesterday’s close.
The pair is expected to find support at 1.2628, and a fall through could take it to the next support level of 1.2592. The pair is expected to find its first resistance at 1.2687, and a rise through could take it to the next resistance level of 1.2710.
Trading trend in the Sterling today is expected to be determined by UK’s BBA mortgage approvals for November, set to release in a few hours.
The currency pair is trading above its 20 Hr moving average and showing convergence with its 50 Hr moving average.
Japan’s Annual Industrial Production Rose Beyond Expectations In November
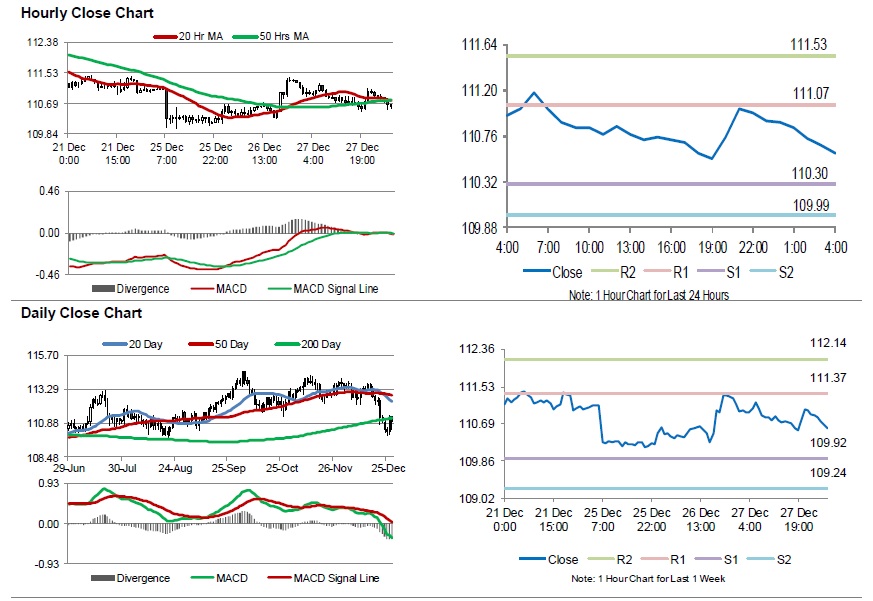
For the 24 hours to 23:00 GMT, the USD declined 0.05% against the JPY and closed at 110.91.
In the Asian session, at GMT0400, the pair is trading at 110.60, with the USD trading 0.28% lower against the JPY from yesterday's close.
Overnight data indicated that Japan's preliminary industrial production advanced 1.4% on an annual basis in November, following a gain of 4.2% in the preceding month. Market participants had envisaged industrial production to record a rise of 0.6%. Also, the nation's retail trade rose 1.4% on a yearly basis in November, undershooting market consensus for a rise of 2.1%. In the previous month, retail trade had recorded an advance of 3.5%.
On the flipside, Japan's large retailer's sales slid 2.2% on a monthly basis in November, more than market anticipations for a drop of 0.4%. Large retailer's sales had registered a decline of 0.8% in the previous month. Additionally, the nation's unemployment rate unexpectedly rose to 2.5%, compared to market expectations of an unchanged reading. In the prior month, unemployment rate had recorded a rate of 2.4%.
The pair is expected to find support at 110.30, and a fall through could take it to the next support level of 109.99. The pair is expected to find its first resistance at 111.07, and a rise through could take it to the next resistance level of 111.53.
With no macroeconomic releases in Japan today, investors would look forward to global macroeconomic releases for further directions.
The currency pair is trading below its 20 Hr and 50 Hr moving averages.
Swiss Franc Extends Its Gains In The Asian Session
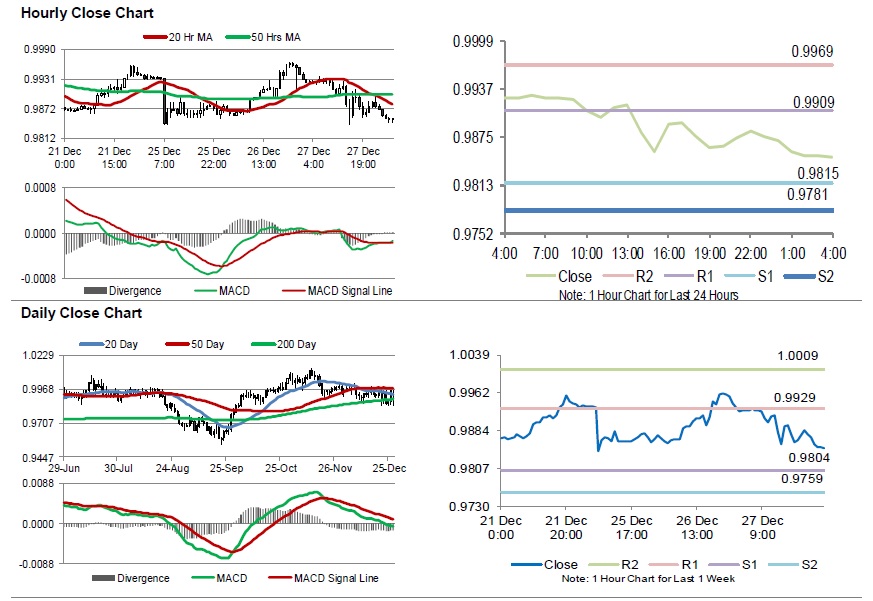
For the 24 hours to 23:00 GMT, the USD declined 0.49% against the CHF and closed at 0.9876.
In the Asian session, at GMT0400, the pair is trading at 0.9849, with the USD trading 0.27% lower against the CHF from yesterday’s close.
The pair is expected to find support at 0.9815, and a fall through could take it to the next support level of 0.9781. The pair is expected to find its first resistance at 0.9909, and a rise through could take it to the next resistance level of 0.9969.
Going ahead, traders would await Switzerland’s KOF leading indicator for December, scheduled to release in a while.
The currency pair is trading below its 20 Hr and 50 Hr moving averages.
Canada’s Gross Domestic Product Climbed At Its Strongest Pace In 5-Months In October
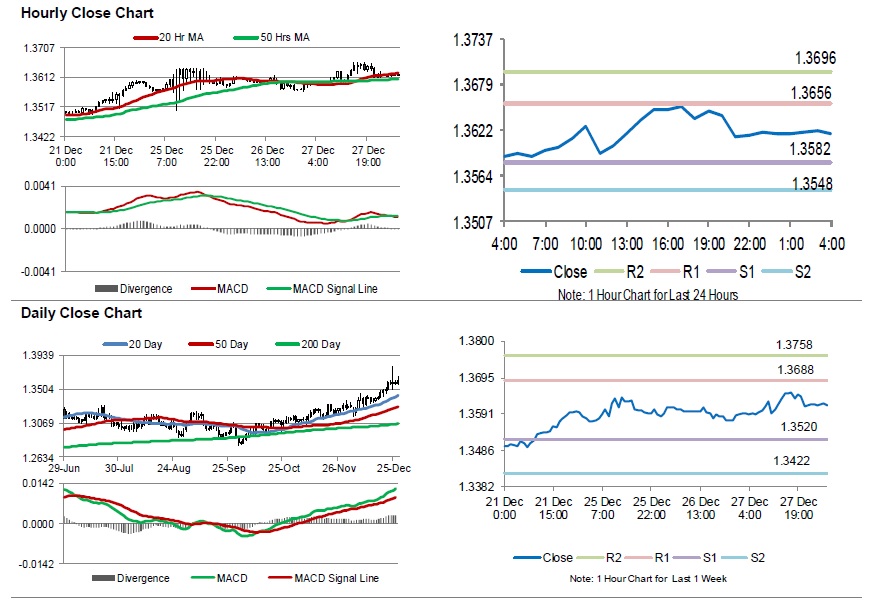
For the 24 hours to 23:00 GMT, the USD rose 0.69% against the CAD and closed at 1.3595 on Friday.
Data indicated that Canada's gross domestic product (GDP) rebounded 0.3% on a monthly basis in October, rising at its fastest pace in 5-months and supported by gains in manufacturing sector. In the prior month, GDP had recorded a decline of 0.1%.. Moreover, the nation's retail sales advanced 0.3% on a monthly basis in October, compared to a revised rise of 0.1% in the previous month. Market participants had anticipated retail sales to climb 0.5%.
In the Asian session, at GMT0400, the pair is trading at 1.3571, with the USD trading 0.18% lower against the CAD from Friday's close.
The pair is expected to find support at 1.3509, and a fall through could take it to the next support level of 1.3448. The pair is expected to find its first resistance at 1.3616, and a rise through could take it to the next resistance level of 1.3662.
Amid lack of economic releases in Canada today, traders would focus on global macroeconomic events for further direction.
The currency pair is showing convergence with its 20 Hr moving average and trading above its 50 Hr moving average
Aussie Trading On A Positive Footing This Morning
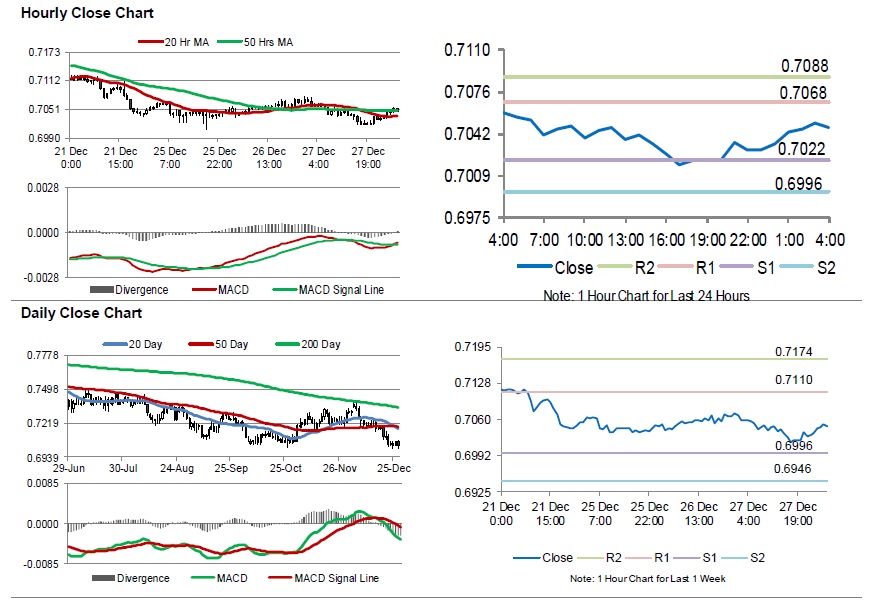
For the 24 hours to 23:00 GMT, the AUD declined 0.40% against the USD and closed at 0.7030.
LME Copper prices rose 0.1% or $3.0/MT to $5990.0/MT. Aluminium prices declined 1.2% or $22.0/MT to $1898.0/MT.
In the Asian session, at GMT0400, the pair is trading at 0.7047, with the AUD trading 0.24% higher against the USD from yesterday’s close.
The pair is expected to find support at 0.7022, and a fall through could take it to the next support level of 0.6996. The pair is expected to find its first resistance at 0.7068, and a rise through could take it to the next resistance level of 0.7088.
The currency pair is trading above its 20 Hr moving average and showing convergence with its 50 Hr moving average.
Gold: Yellow Metal Extends Its Gains In The Morning Session
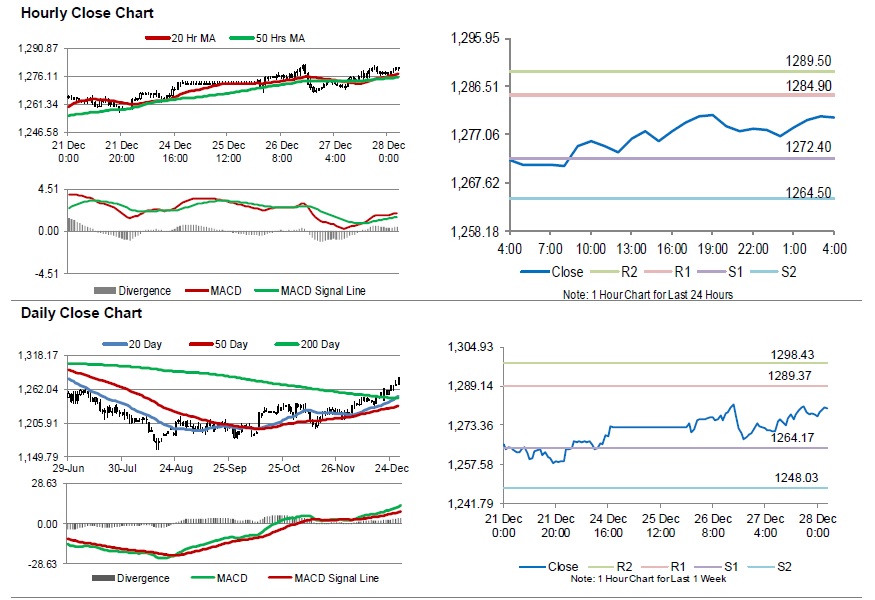
For the 24 hours to 23:00 GMT, Gold rose 0.43% against the USD and closed at USD1278.10 per ounce, amid weakness in the greenback.
In the Asian session, at GMT0400, the pair is trading at 1280.30, with gold trading 0.17% higher against the USD from yesterday’s close.
The pair is expected to find support at 1272.40, and a fall through could take it to the next support level of 1264.50. The pair is expected to find its first resistance at 1284.90, and a rise through could take it to the next resistance level of 1289.50.
The yellow metal is trading above its 20 Hr and 50 Hr moving averages.
Silver: White Metal Trading On A Stronger Footing This Morning
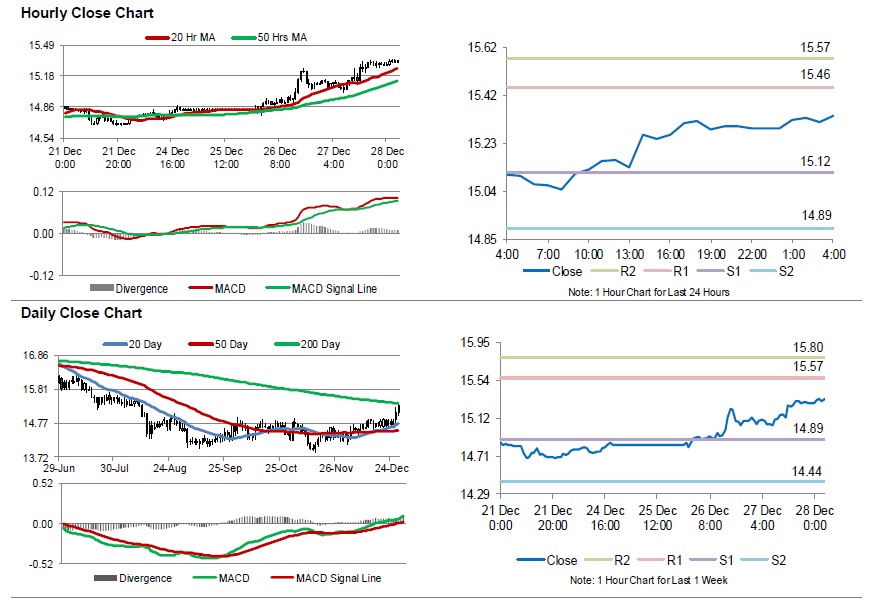
For the 24 hours to 23:00 GMT, Silver rose 1.29% against the USD and closed at USD15.29 per ounce, tracking gains in gold prices.
In the Asian session, at GMT0400, the pair is trading at 15.34, with silver trading 0.33% higher against the USD from yesterday’s close.
The pair is expected to find support at 15.12, and a fall through could take it to the next support level of 14.89. The pair is expected to find its first resistance at 15.46, and a rise through could take it to the next resistance level of 15.57.
The white metal is trading above its 20 Hr and 50 Hr moving averages.
Crude Oil: Oil Trading Higher, Ahead Of EIA’s Weekly Crude Oil Inventories Data
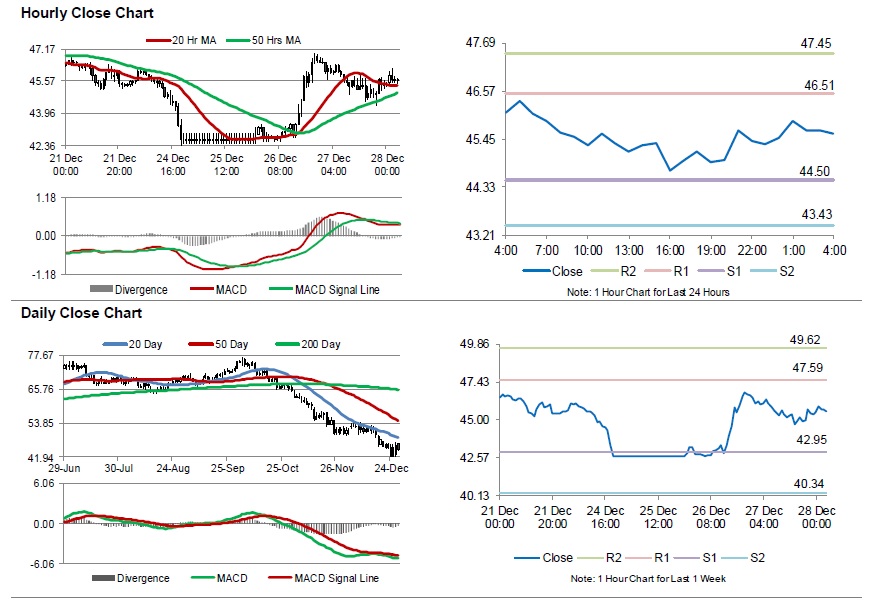
For the 24 hours to 23:00 GMT, Crude Oil declined 1.39% against the USD and closed at USD45.34 per barrel, amid ongoing worries over global economic growth and excess supply. Additionally, the American Petroleum Institute (API) reported that US crude oil inventories rose 6.9 million barrels to 448.2 million barrels in the week ended 21 December.
In the Asian session, at GMT0400, the pair is trading at 45.57, with oil trading 0.51% higher against the USD from yesterday's close.
The pair is expected to find support at 44.50, and a fall through could take it to the next support level of 43.43. The pair is expected to find its first resistance at 46.51, and a rise through could take it to the next resistance level of 47.45.
Crude oil is trading above its 20 Hr and 50 Hr moving averages.
Alibaba Elliott Wave Structure Looking For Rally To Fail
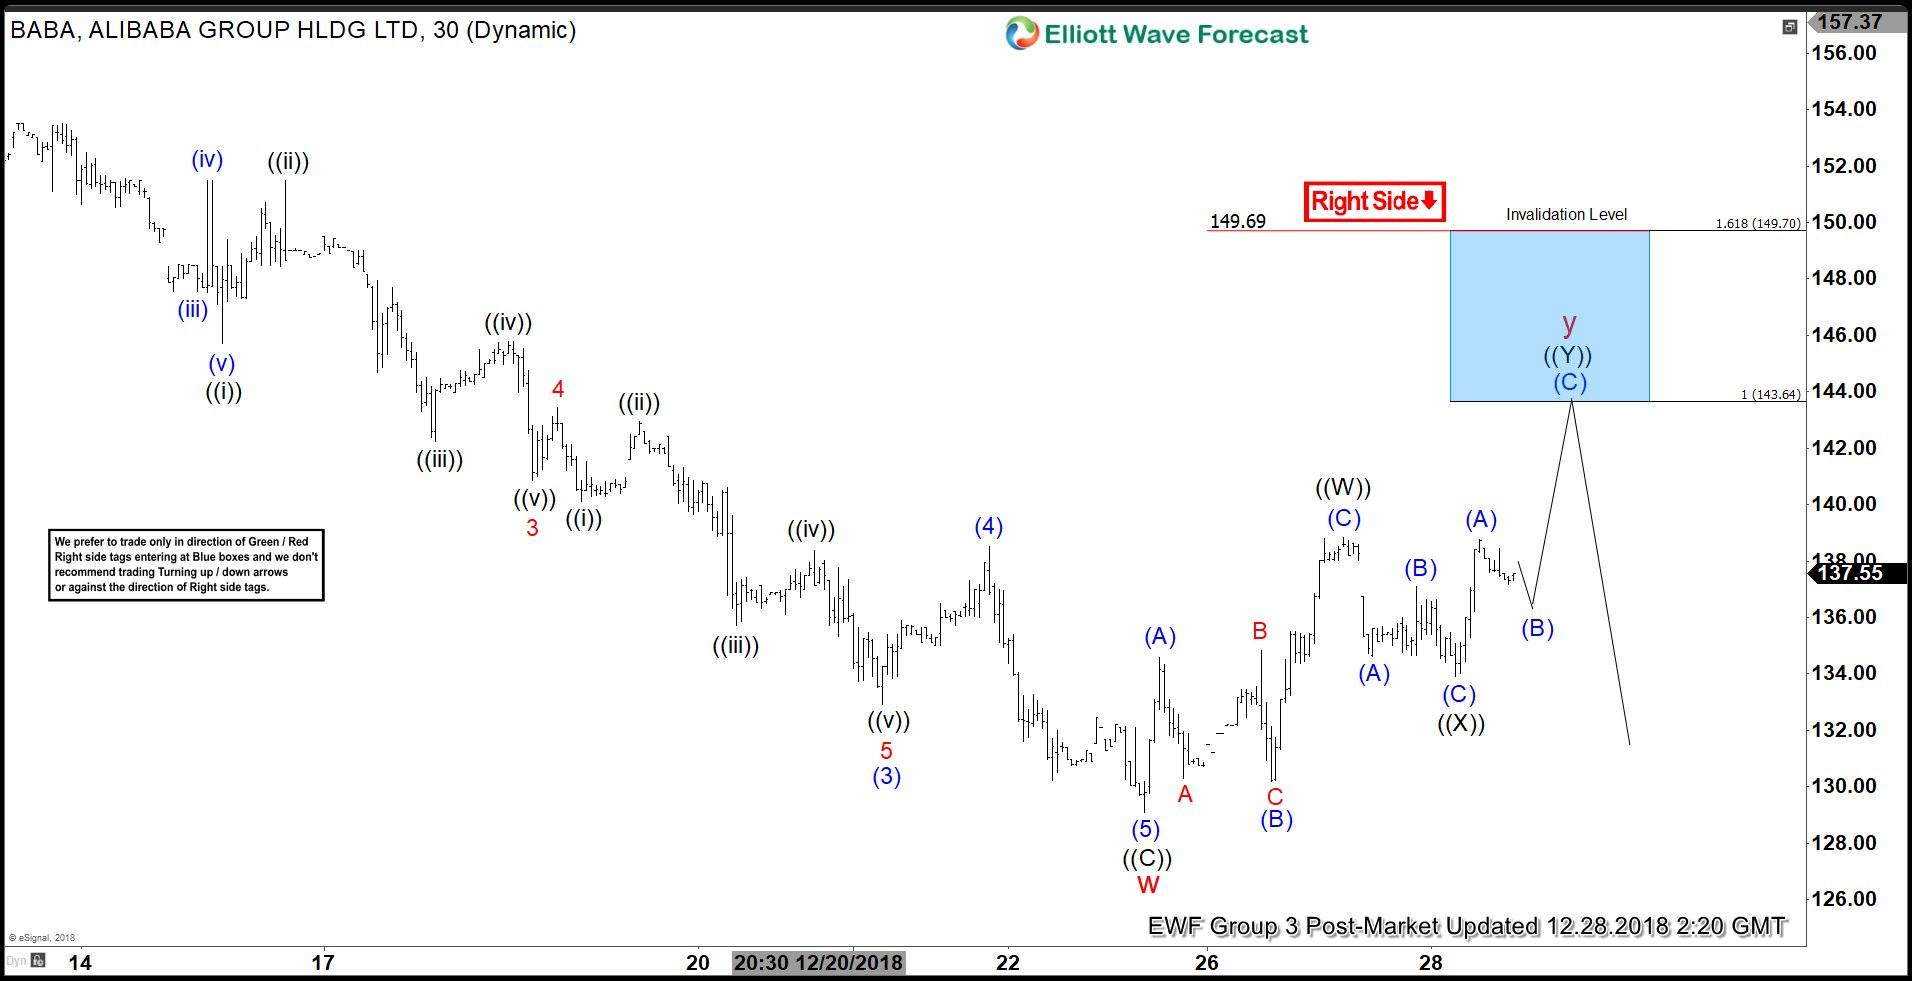
Elliott Wave view in Alibaba (BABA) shows that the stock has an incomplete bearish sequence from 6.5.2018 high ($211.7). The 100% target in 7 swing comes at $88.3 and this view remains valid as far as the stock stays below 12.3.2018 high ($168.8). Near term, decline from 12.3.2018 high ended with Cycle degree wave w at $129.10.
Internal of Cycle degree wave w unfolded as a zigzag Elliott Wave structure where Primary wave ((A)) ended at $150.5, Primary wave ((B)) ended at $158.05, and Primary wave ((C)) ended at $129.10. The stock is currently correcting cycle from 12.3.2018 high within Cycle degree wave y in 7 or 11 swing before the decline resumes.
Internal of wave y is unfolding as a double three Elliott Wave structure where Primary wave ((W)) ended at $138.84, Primary wave ((X)) ended at $133.89, and Primary wave ((Y)) of y aims for $143.64 – $149.7 target before the decline resumes. We expect sellers to appear from this blue box $143.64 – $149.7 area for more downside or 3 waves pullback at least.
Alibaba 1 Hour Post-Market Elliott Wave Chart