Sample Category Title
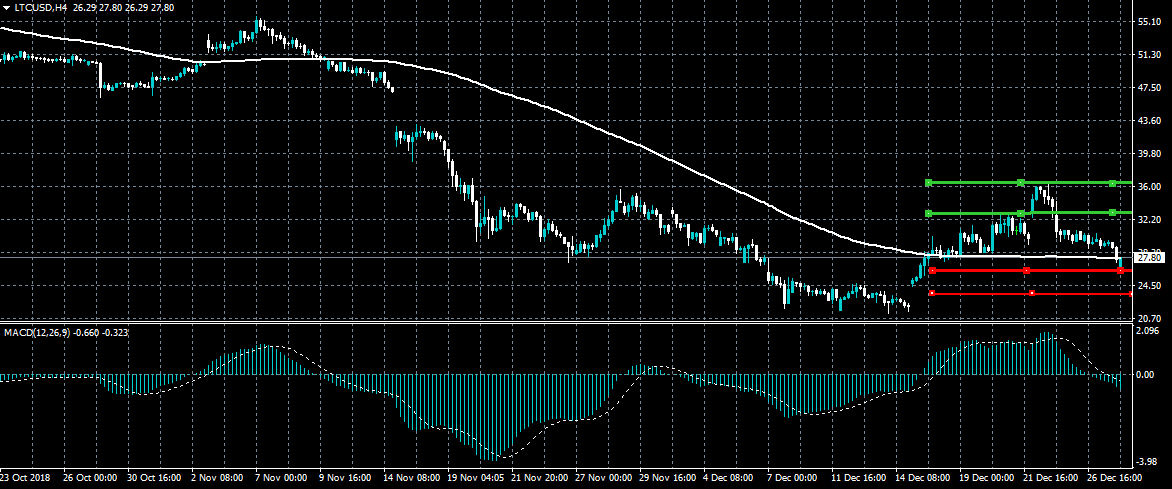
LTCUSD Heavily Bearish Below $26.00
Litecoin has fallen to a fresh weekly low in early Friday trade as the entire cryptocurrency market comes under heavy selling pressure. After peaking around the $36.60 level on Christmas Eve, the LTCUSD pair has now lost over twenty-five per cent of its market capitalization. A sustained move below the $26.00 support level may prompt traders to attempt to close the price gap around the $24.00 level.
The LTCUSD pair is heavily bullish while trading below the $26.00 level, key support is found at the $24.00 and the $20.80 levels.
If the LTCUSD pair moves above the $30.00, buyers may test the $33.00 and $36.00 resistance levels.
Key Takeaways From This Year’s Cryptocurrency Slump
This year has not been kind to investors. Stocks in developing countries have recently fallen to the bear territory while investors in commodities had nothing to smile about as most of them declined. Crypto investors were the most affected as the market capitalization declined by more than $700 billion. Here are key takeaways from this year's slump.
In the crypto industry, research documents showed that most crypto investors aimed to benefit from the upward trend. As the price started to decline, investors dumped their holdings. Secondly, the decline was an important lesson in the concept of price action. As traders, the goal is to benefit when the price is moving both up and down. In 2017, as the price moved up, it was an opportunity to buy currencies. In 2018, as the price declined, it was an opportunity to sell or short the currencies.
Thirdly, the decline was also an important lesson on risk management and the need to stay protected in the financial markets. Investors who had placed intelligent stop-losses were better-off than those who had not protected their trades. The slump also highlighted the risks of buying on the dip. Many bullish crypto investors tried to find the bottom by buying during major declines. While this strategy has worked among many assets before, it did not work for cryptos this year.
Moreover, the decline showed how bubbles form and how they burst. As the crypto industry grew, so did the number of people interested in the industry. The herd-like mentality led to a sharp increase in price, even though many investors did not have a good understanding of the industry. This was the same thing that happened during the dot-com bubble. Since the dot-com industry flourished then crashed, it seems the volatility of the crypto sector could continue if following a similar trend.
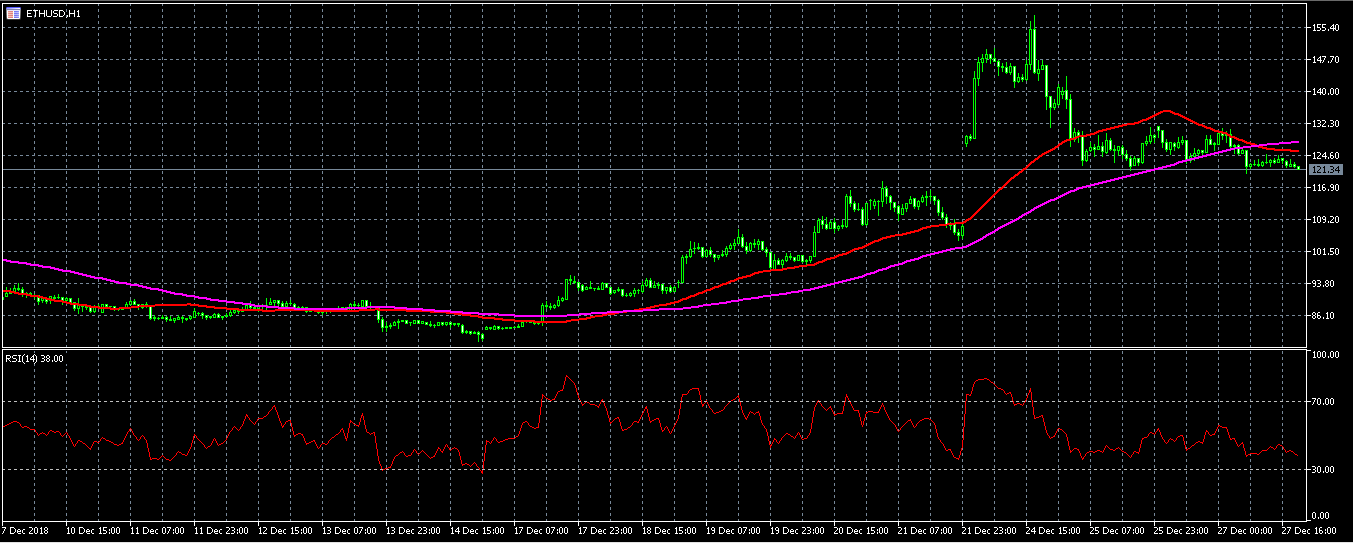
ETH has been among the biggest losers this year. Today, the currency has a market cap of $12 billion, which is lower than the peak market cap of more than $100 billion. On the hourly chart, the price of ETHUSD has declined to 121.34. This price is below the 50-day and 100-day simple moving average while the RSI has moved from the overbought territory to the current 38. As the fundamentals of the currency weaken, it is likely that the price will continue moving lower.
Euro Gains Against USD Ahead Of Key Data From Europe
US markets staged a last minute recovery yesterday. Throughout the entire trading session, the markets declined sharply, with the Dow declining by more than 500 points. Before the markets closed, the markets recovered and the Dow, S&P, and Nasdaq ended the day higher by 1.15%, 0.86%, and 0.40% respectively. The session was therefore a continuation of the Santa rally that started on Wednesday when the Dow gained by more than 1000 points. As a result, Asian markets traded higher with the Shanghai and Hang Seng gaining by 0.40% and 0.15% respectively.
The Japanese yen climbed slightly against the USD after important data from Japan. In November, the industrial production contracted by minus 1.1%, which was better than the consensus estimate of minus 1.7%. Tokyo CPI rose by an annualized rate of 0.3%, which was lower than November’s 0.8%. The unemployment rate rose to 2.5%, which was higher than the expected 2.4%. Retail sales in November rose by 1.4%, which was worse than the expected 2.2%.
The euro rose against the USD ahead of key data from Europe. Spain will release its CPI, HICP, and GDP numbers. The CPI is expected to rise by 1.5%, which will be lower than the expected 1.7%. The Q3 GDP is expected to grow by 2.5%, which will be similar to the previous number while the HICP is expected to rise by 1.6%. Meanwhile, Germany’s CPI is expected to fall to 1.9%, from November’s 2.3%. Later today, the US will release the new and pending home sales data while the EIA is expected to release the crude oil inventories.
EUR\USD
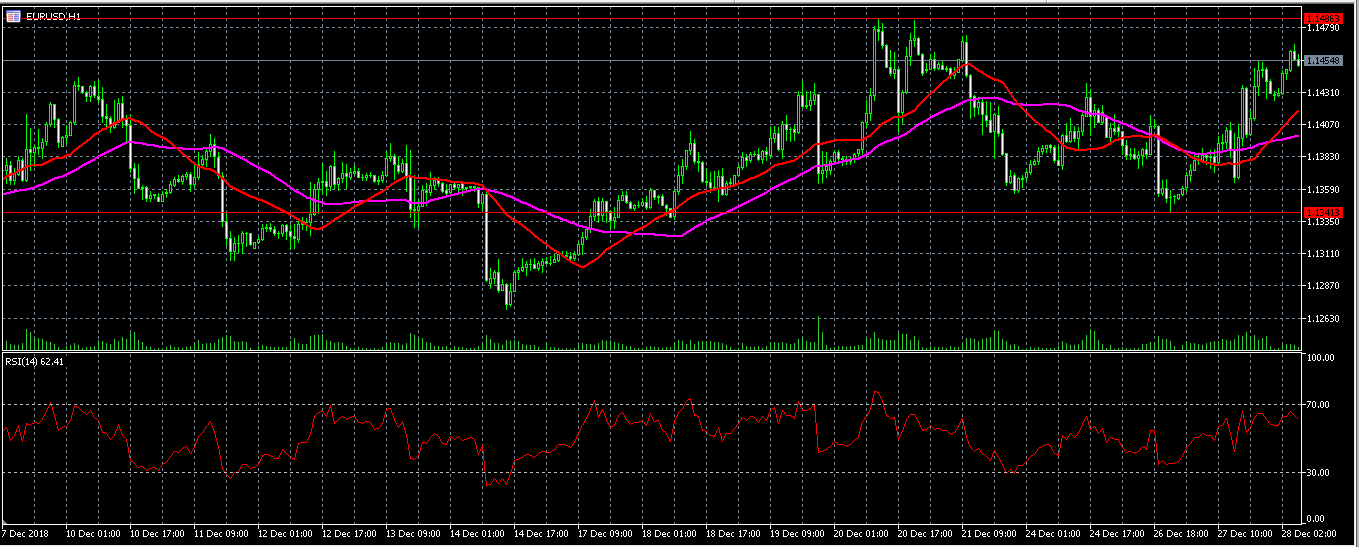
The EUR\USD pair rose sharply ahead of key economic data from Europe. This week, the price has moved from a low of 1.1340 to the current high of 1.1467. The price is above the 25-day and 50-day simple moving average. The RSI has moved from the oversold level of 30 to the current high of 65. The pair will likely continue to move higher, potentially to the important resistance level of 1.1500.
USD\CAD
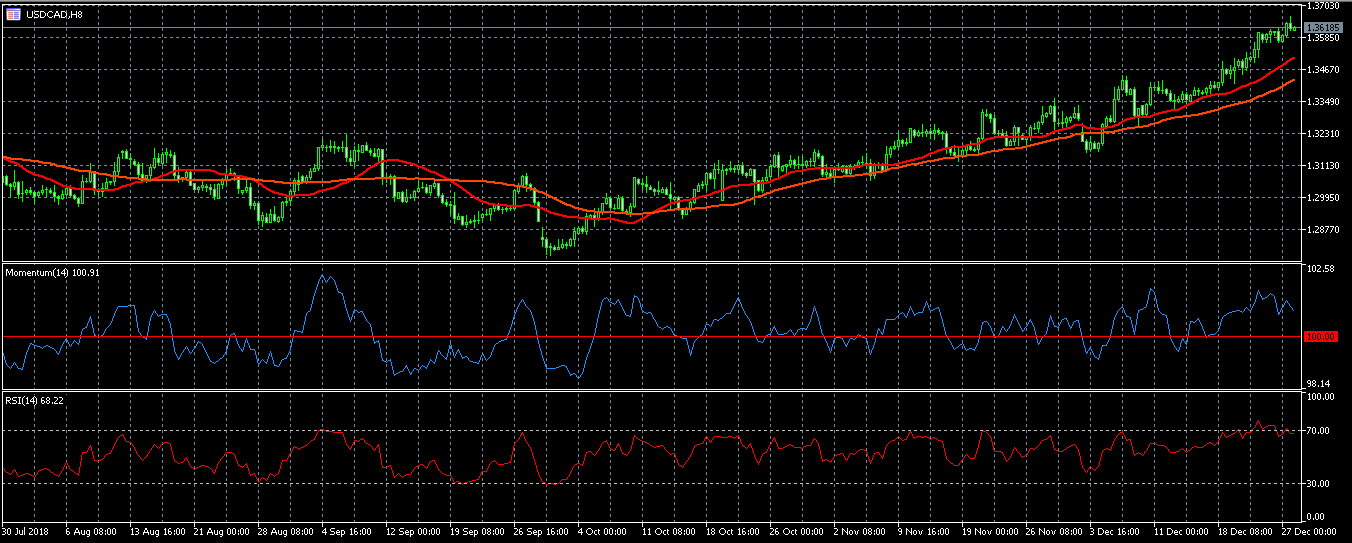
The USD\CAD pair moved to the highest level this year. The pair is now trading along the 1.3620 level. The new upward trend started on September when the pair reached a low of 1.2780. On the daily chart, the pair’s momentum indicator has continued to remain above the 100 level. The price is also above all the major moving averages while the RSI has remained above the 70 level.
XAU\USD
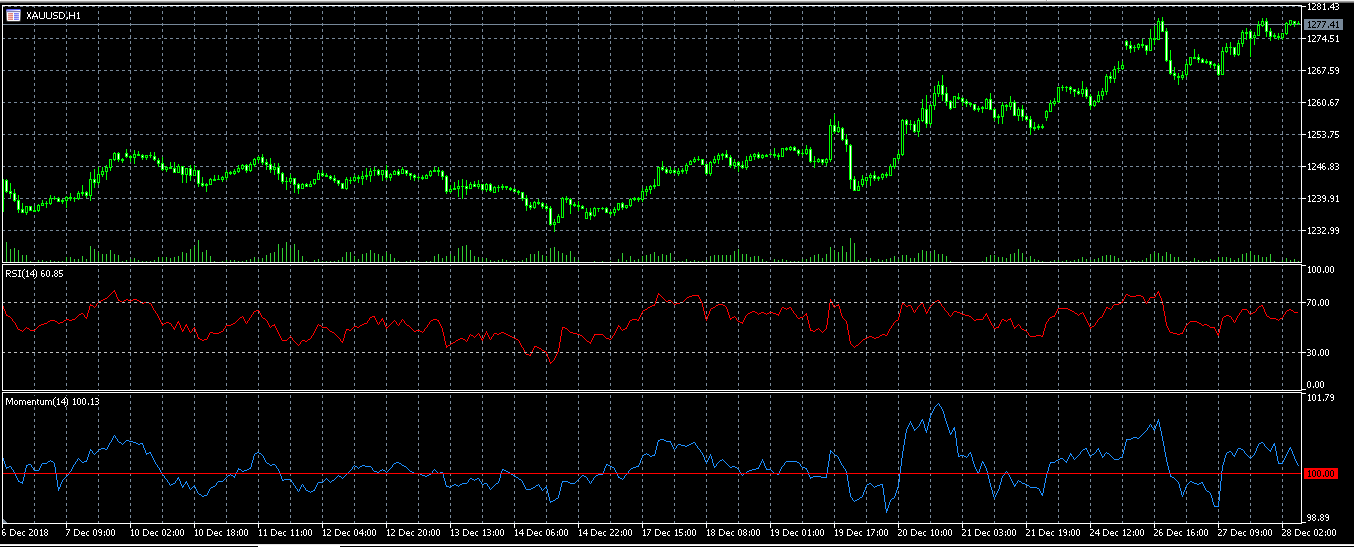
XAU\USD continued the upward momentum and reached a high of 1277. On the hourly chart, the price is above the 50-day and 100-day simple moving average while the RSI has continued to remain below the overbought level of 70. At the same time, the momentum indicator has been declining. The pair will likely continue moving higher as market risks increase.
Crude Oil Consolidation In Place
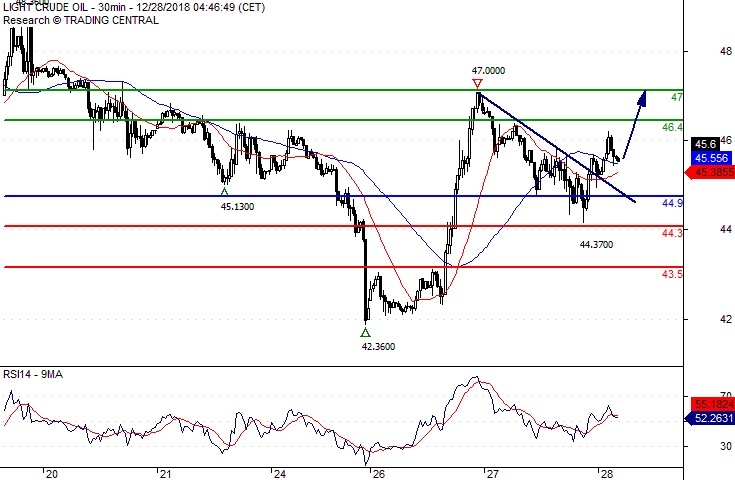
Pivot (invalidation): 44.90
Our preference Long positions above 44.90 with targets at 46.40 & 47.00 in extension.
Alternative scenario Below 44.90 look for further downside with 44.30 & 43.50 as targets.
Comment The RSI is mixed with a bearish bias.
Silver Spot Further Advance
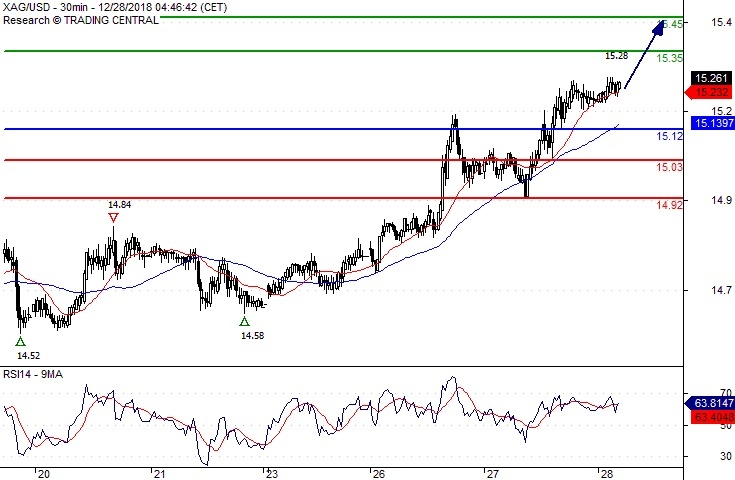
Pivot (invalidation): 15.1200
Our preference Long positions above 15.1200 with targets at 15.3500 & 15.4500 in extension.
Alternative scenario Below 15.1200 look for further downside with 15.0300 & 14.9200 as targets.
Comment The RSI is mixed to bullish.
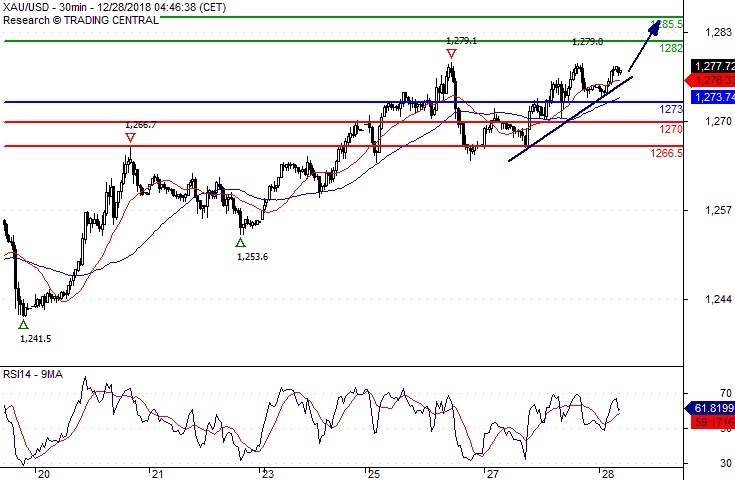
Gold Spot Supported By A Rising Trend Line
Pivot (invalidation): 1273.00
Our preference Long positions above 1273.00 with targets at 1282.00 & 1285.50 in extension.
Alternative scenario Below 1273.00 look for further downside with 1270.00 & 1266.50 as targets.
Comment The RSI is mixed to bullish.
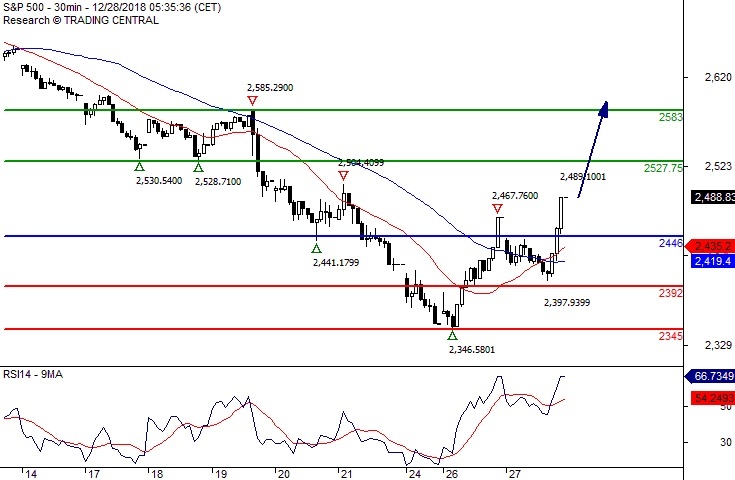
S&P 500 Bullish Bias Above 2446.00
Pivot (invalidation): 2446.00
Our preference Long positions above 2446.00 with targets at 2527.75 & 2583.00 in extension.
Alternative scenario Below 2446.00 look for further downside with 2392.00 & 2345.00 as targets.
Comment The RSI is bullish and calls for further upside.
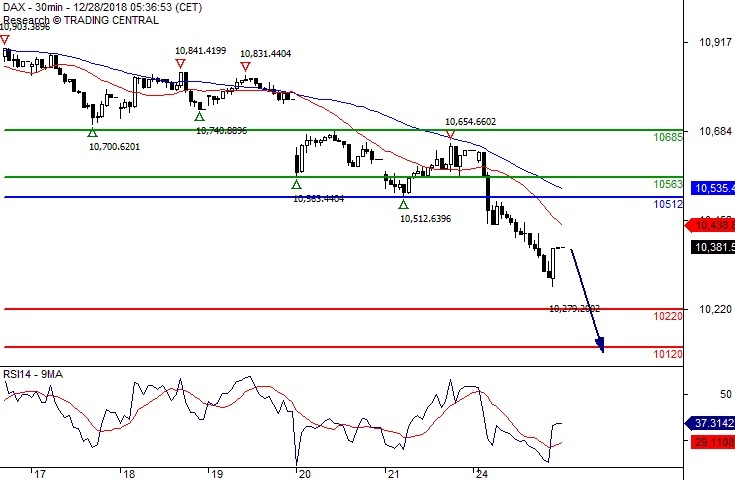
DAX Under Pressure
Pivot (invalidation): 10512.00
Our preference Short positions below 10512.00 with targets at 10220.00 & 10120.00 in extension.
Alternative scenario Above 10512.00 look for further upside with 10563.00 & 10685.00 as targets.
Comment The RSI is bearish and calls for further downside.
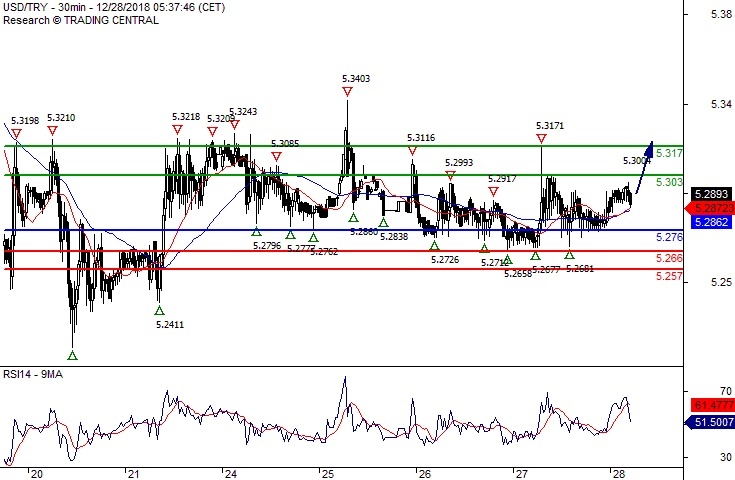
USD/TRY Turning Up
Pivot (invalidation): 5.2760
Our preference Long positions above 5.2760 with targets at 5.3030 & 5.3170 in extension.
Alternative scenario Below 5.2760 look for further downside with 5.2660 & 5.2570 as targets.
Comment Technically the RSI is above its neutrality area at 50.
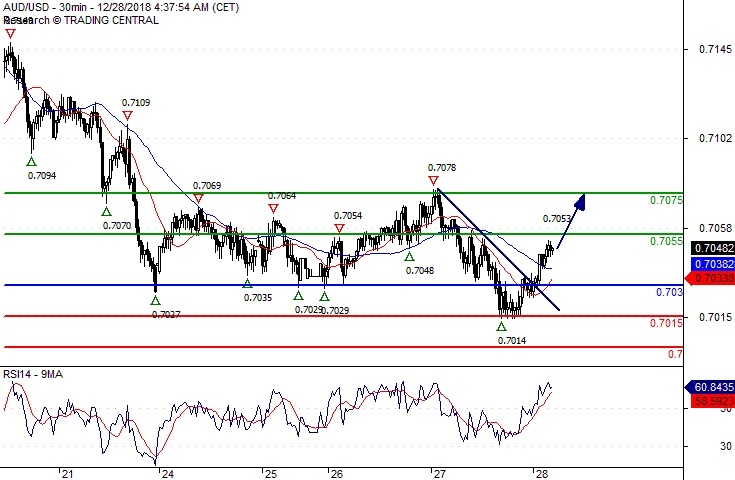
AUD/USD The Upside Prevails
Pivot (invalidation): 0.7030
Our preference Long positions above 0.7030 with targets at 0.7055 & 0.7075 in extension.
Alternative scenario Below 0.7030 look for further downside with 0.7015 & 0.7000 as targets.
Comment The RSI is bullish and calls for further advance.