Sample Category Title
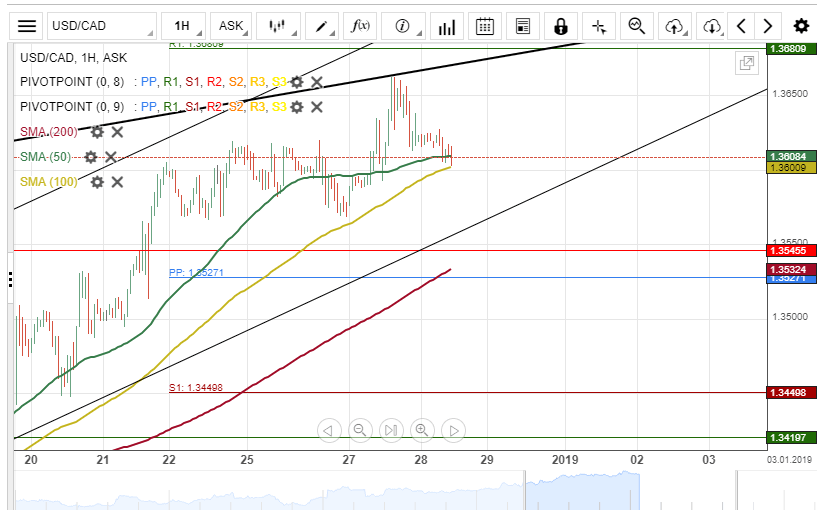
USD/CAD Remains Near 1.3608
The US Dollar appreciated about 92 base points against the Canadian Dollar on Thursday. The surge was stopped by a resistance level formed by the upper boundary of a medium-term ascending channel pattern at 1.3650 during yesterday's trading session.
However, after hitting the resistance level as mentioned above, the exchange rate made a pullback down. Currently, the pair is testing the 50– and 100-hour simple moving average at 1.3608.
If the SMAs holds, the USD/CAD currency exchange rate will continue its northern movement and potentially break the medium-term channel pattern during the following trading session.
NZD/USD Bearish Signals Today
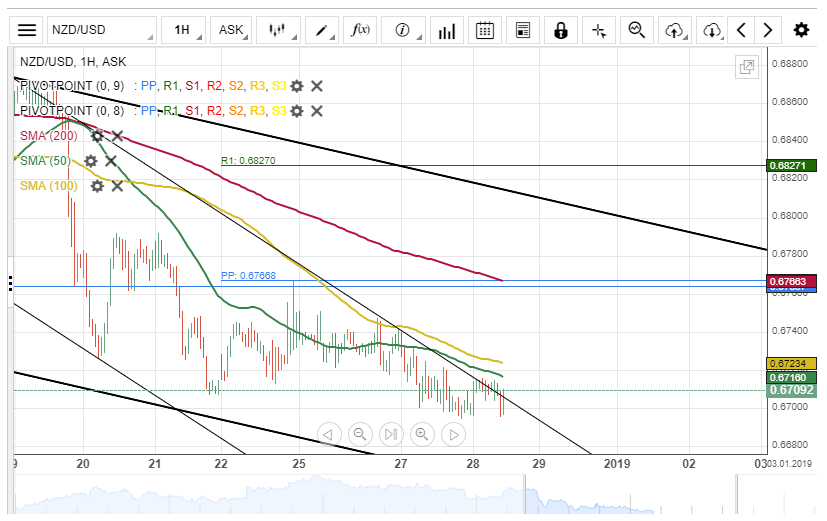
The New Zealand Dollar depreciated about 45 base points against the US Dollar on Thursday. The 50– and 100-hour SMAs continued to pressure the currency pair lower.
Everything being equal, it is likely that the NZD/USD currency exchange rate will continue its southern movement within this session. The potential downside target will be near the lower boundary of a medium-term descending channel at 0.6653.
Meanwhile, technical indicators demonstrate that bears are likely to continue their dominance in the market today.
SPX’s Volatility At 2015’s High
Talking about how aggressive the Fed is going to be towards their monetary policy in the coming year, traders have started to do something unusal. The argument of cutting an interest rate is becoming serious among traders and the odds of this event taking place in 2020 are standing at 50 percent. It doesn’t only stop there, because they also believe that the Fed will not be able to increase the interest rate next year.
This shows a clear disconnect, it seems like traders believe that Donald Trump will be able to get things done his way because the Fed has announced that there could be one to two rate hikes going in 2019. Remember, their previous projection was that there may be two to three interest rate hikes in 2019. Clearly, there is a disconnect between the Fed and the market expectations. This is only going to make the upcoming Fed meetings more interesting because everyone is going to dissect the Fed language even more intensely. Of course, this means more volatility for the dollar index and the equity markets.
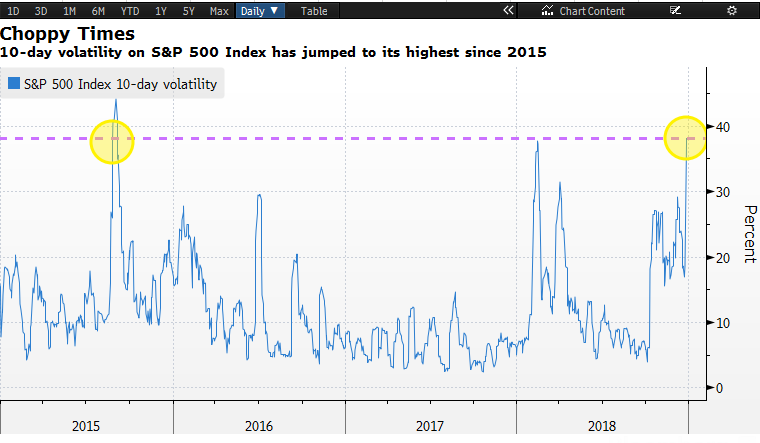
Speaking of volatility, the wild swings on the Wall Street were able to push the Dow Jones back in green yesterday. The S&P 500 index experienced its biggest gain in eight years and the S&P500's 10-day volatility soared to its highest level since 2015. The chart below shows that the 10-day volatility for the SPX has clearly surpassed its earlier level (formed in February). This means more opportunites for investors who like to day trade stocks.
Investors over in Europe are feeling optimistic and European futures are trading solid this morning as the 10-year bond spread between Italy and German narrowed to 251 basis points from its previous high of 326 basis points. Investors are somewhat comfortable with the idea that the current deal (about Italy's next year target) between Italy and the EU is more favourable rather than adopting the path of fiscal penalties which would have created more chaos. Investors will be keeping a close eye on the upcoming German inflation data which probably have softened. The consensus is for a slowdown in this reading to 1.9% from its previous number of 2.2% and this is primarily due to lower oil prices already
Over in the United States, the US government shutdown is going to continue into 2019. House Republicans have said that they there have no plans for any votes this week. It is clear that Donald Trump is no mood of backing off from his current stance and he is determined that no bill will be signed unless the first priority is given to his agenda- getting the funds to build the wall.
ECB Economic Bulletin Provides Forecasts For 2019
According to ECB, the global economy is heading towards a slowdown in 2019 and could stabilize afterwards. The ECB also stated that inflation pressures could persist, globally but also in the Eurozone. More specifically it was said inflation is expected to increase slowly due to ECB's monetary policy measures, the ongoing economic growth and rising wages. It was emphasized that they could see ongoing expansion in the economy but followed up by increased downside risks. Further developments on the pre mentioned news could create volatility for the EUR. EURUSD moved higher yesterday breaking consecutively the 1.1385 (S2) support level and the 1.1425 (S1) support level. During today's Asian morning EURUSD moved even higher aiming for the 1.1465 (R1) resistance level but was unsuccessful in breaching it. The movement could be due to the weakening of the USD. If the soaring continues, then we may see the common currency breaking the 1.1465 (R1) resistance level and aim for higher grounds, with the next level being our 1.1500 (R2) resistance level. On the contrary, if the major currency is to correct on the downside, then we may see a movement towards our 1.1425 (S1) support level which could even be breached. If the bearish movement persists then we could see it moving even lower for the 1.1385 (S2) support line. The financial news to be released today regarding Germany's Inflation data could weaken the EUR according to their forecasts.
Oil prices drop on mixed fundamental data
A variety of fundamental news regarding the Oil market could have created an indecisive sentiment for Oil prices, despite the drop yesterday. Iran, which faces U.S. sanctions on its oil exports, said it continues its business with private exporters who had "no problems" selling its oil, indicating supply is still in place. On the other hand, Russia Energy minister said Oil prices could stabilize in the starting months of 2019. Furthermore, Iraq's energy minister made it clear that the OPEC plus group could set up an additional meeting, if the arranged production cuts don't have the required effect on Oil prices. Further developments on the OPEC plus front could create volatility for WTI. Yesterday, WTI lost 3.5% of value and corrected lower after the upward trend it had formed in the previous days. WTI was caught in a bearish movement but remained it a sideways motion between our 47.35 (R1) resistance level and the 45.30 (S1) support level. It must be noted that, most of WTI's movement in the previous 10 days has been between the pre mentioned levels and the levels could considered as a make or break price range. If the commodity is undertaken by a bullish momentum we could see it moving towards the 47.35 (R1) resistance level and aim even higher aiming for the 49.40 (R2) resistance level. On the other hand, if a bearish movement prevails then we could see WTI break below our 45.30 (S1) support level and head towards the 43.60 (S2) support barrier.
In today's other economic highlights:
In today's European afternoon, we get the Germany's inflation data which could create volatility for EUR pairs. In a quiet American session, we get from the US the Baker Hugh's weekly Oil rig count which could move Oil prices. From all of us here at IronFX we would like to wish you solid trading and best wishes for happy holidays.
EURUSD H1
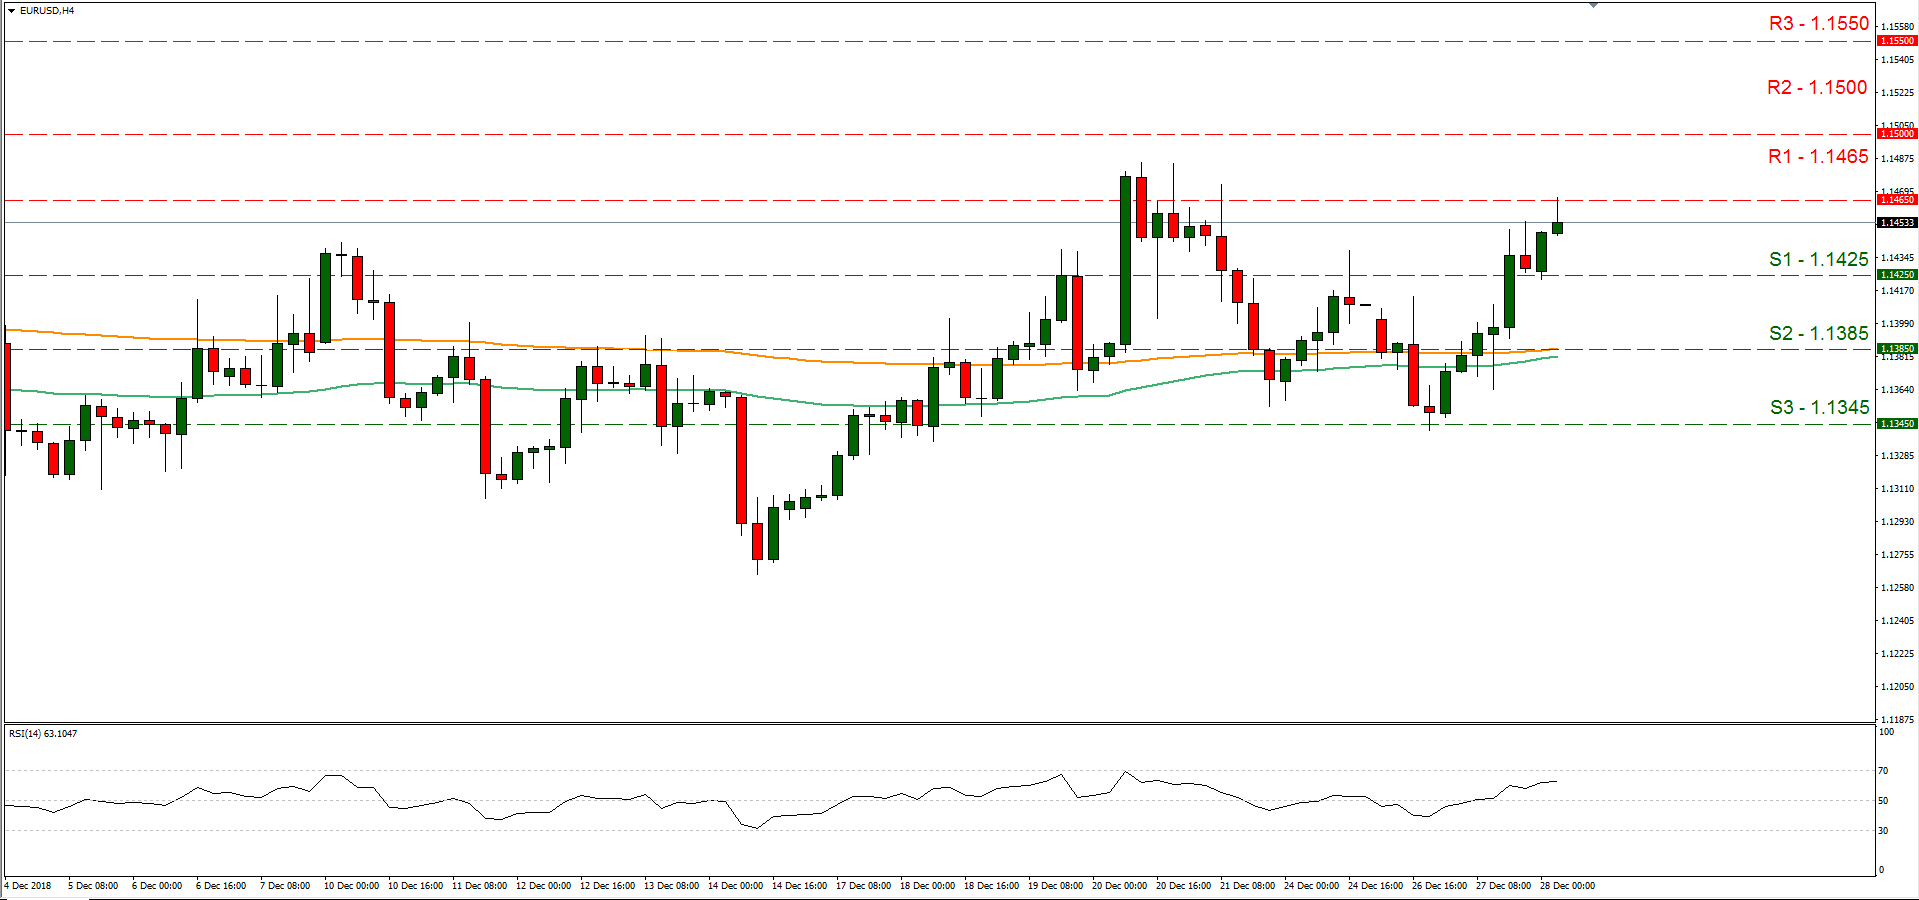
Support: 1.1425 (S1), 1.1385 (S2), 1.1345 (S3)
Resistance: 1.1465 (R1), 1.1500 (R2), 1.1550 (R3)
WTI H1
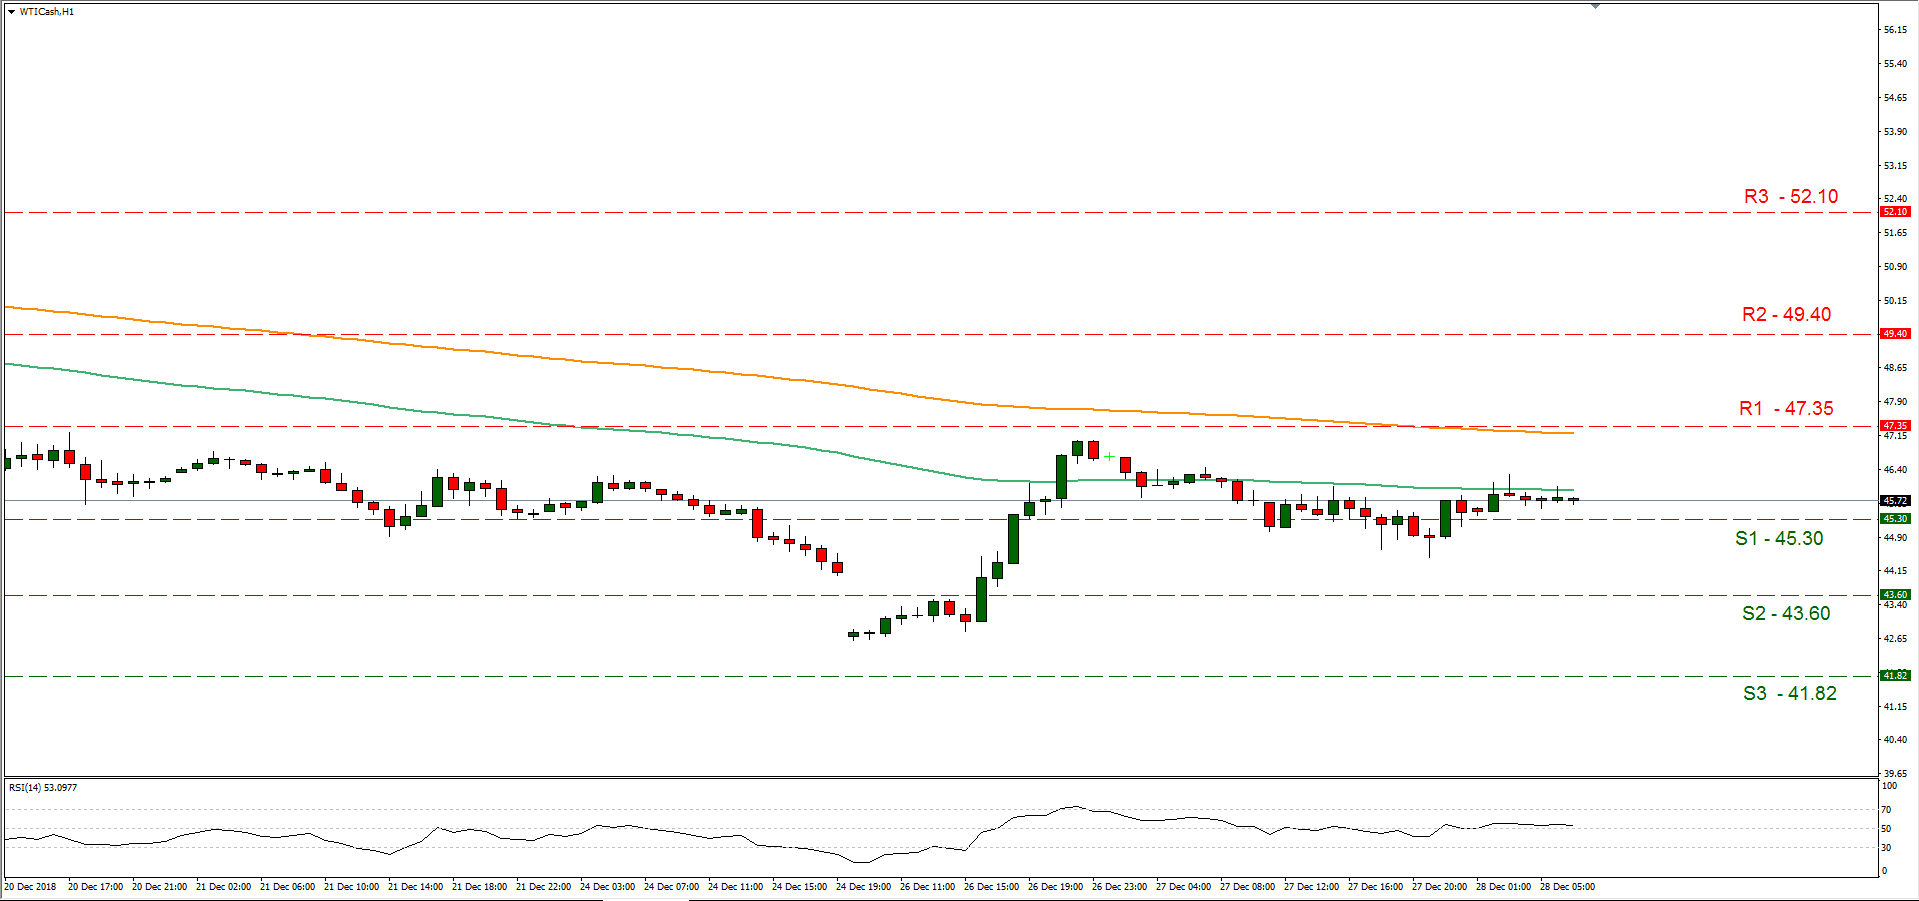
Support: 45.30 (S1), 43.60 (S2), 41.82 (S3)
Resistance: 47.35 (R1), 49.40 (R2), 52.10 (R3)
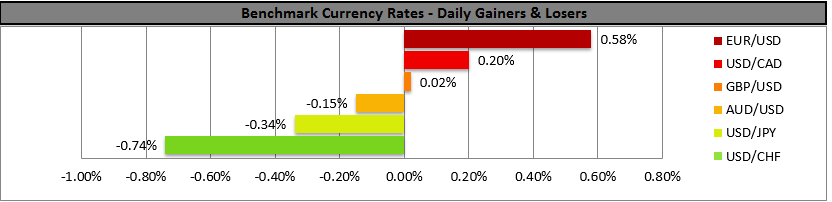
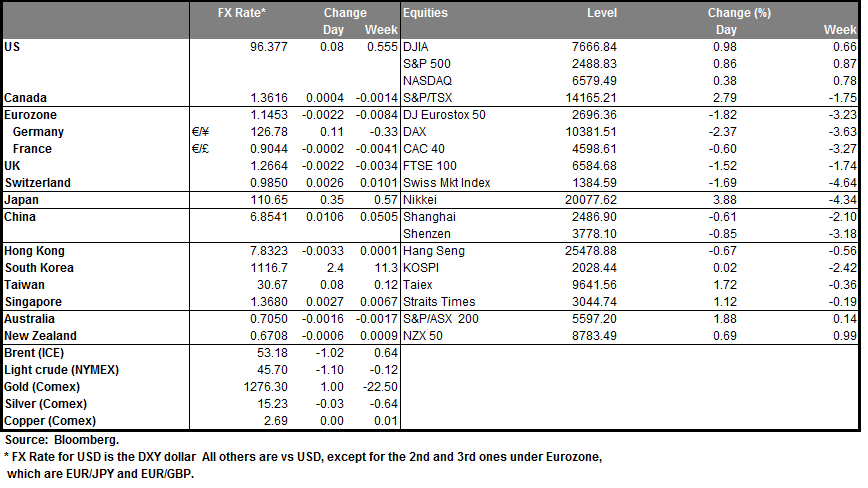
The US Dollar Index Is In The Red
The US dollar weakened significantly against a basket of major currencies during yesterday's trading. It became known that the US President Trump may impose a ban on the use of equipment made by Chinese companies Huawei and ZTE for US companies. Such actions may again escalate trade relations between the United States and China. In light of these events, the demand for safe assets has increased significantly. The dollar index (#DX) closed yesterday in the negative zone (-0.59%).
Weak economic statistics put pressure on the US currency. CB consumer confidence index in December counted to 128.1 and was worse than the expected value of 133.7. Today we recommend paying attention to statistics on the real estate market in the United States.
The "black gold" prices have been recovering. At the moment, futures for the WTI crude oil are close to $46.00 per barrel. At 18:00 (GMT+2:00), a report on crude oil inventories will be published in the United States.
Market Indicators
Yesterday, the bullish sentiment was observed in the US stock market: #SPY (+0.77%), #DIA (+1.11%), #QQQ (+0.39%).
At the moment, the 10-year US government bonds yield is at the level of 2.77-2.78%.
The news feed on 28.12.2018:
Pending home sales index in the US at 17:00 (GMT+2:00).
Dollar Sags But Equities Stage Comeback
- US equities stage a major comeback late in the session, close higher
- Dollar edges lower as Fed rate-hike expectations are almost fully priced out
- Yen shines, loonie and aussie flirt with lows amid broader risk-off mood
US stocks stage an impressive late comeback, but skepticism lingers
It was another session characterized by sharp moves in both the currency and equity markets on Thursday amid thinner-than-usual liquidity, and with little in the way of fresh news to drive the price action. The lion’s share of attention was once again on US stocks, which managed to stage a remarkable comeback late in the session, with the likes of the S&P 500 recovering the substantial losses it had recorded until then to close 0.86% higher.
While this was undoubtedly an encouraging development for the bulls, as a second day of gains in equities suggests the latest rebound may not have been a so-called “dead cat bounce”, some skepticism lingers. The broader narrative of a looming slowdown in economic growth hasn’t changed, and reading too much into market moves so late in the calendar year may be ill-advised, as they could be driven mainly by year-end rebalancing flows. The bottom line is that the same themes are still at play, so it may be more prudent to judge the bigger picture by how sentiment develops early in the New Year, when liquidity will start returning to more normal levels.
Dollar sags as Fed expectations get priced out; euro and yen capitalize
In the currency market, the dollar underperformed most of its major peers, with the euro and the yen being the main beneficiaries of that weakness. The US currency continues to surrender ground overall, as the latest bout of weakness in stock markets was seemingly the “straw that broke the camel’s back” with respect to market expectations around future Fed hikes. To explain, investors have now priced out practically all rate-hike expectations for 2019, effectively betting that the Fed will not dare touch the hike button at all in the face of a slowing economy. This stands in stark contrast to the two rate hikes that the central bank itself penciled in for the same year just last week.
Back to FX markets, the Japanese currency is also outperforming early on Friday amid a generally risk-off mood, paying little attention to a raft of mixed Japanese data released overnight. The Japanese currency has shined in the latter part of December, reclaiming its status as the preferred haven asset in times of market turmoil.
Commodity currencies crumble, aussie flirts with 2-year low
Arguably the hardest hit currencies in the G10 space have been the commodity-linked ones, and in particular the loonie and the aussie. The former tumbled to a 1½-year low versus the dollar yesterday, while the latter briefly touched a 2-year low, both of which are particularly striking considering that the greenback was a major underperformer itself.
The loonie has of course been battered by the broad collapse in oil prices. Separately, the aussie seems to have been battered primarily by the broader risk-off environment, though the fact that markets now foresee a small probability (~20%) for a rate cut in Australia next year amid disappointing data likely contributed too.
Day ahead: German inflation figures due
The highlight on the economic calendar will be Germany’s preliminary inflation figures for December, due at 1300 GMT. Note that the nation’s regional CPIs will be released ahead of the nationwide print, so any moves in the euro may begin even earlier.
Swiss KOF dropped to 96.4 on manufacturing and construction
Swiss KOF Economic Barometer dropped to 96.3 in December, down from 98.9 and missed expectation of 98.8. KOF said in the release "The main drivers of this development stem from indicators belonging to the producing sector (manufacturing and construction). In addition, a weakly negative signal is sent by the financial sector and private consumption. Favorable export prospects, on the other hand, cushion this downward tendency."
USDCHF Looking Bearish But Supported At 50% Fibonacci
USDCHF has retreated significantly from the 20-month peak of 1.0127 set on November 13, retracing almost 50% of its September to November gains. The slide has been halted for the moment by the 50% Fibonacci retracement level at 0.9834. Momentum indicators point to further downside risks but are not yet overly bearish.
The RSI has fallen further below the 50-neutral level, but the slope has become shallower over the past day, suggesting further losses are likely to be limited in the near term. The MACD, meanwhile, has crossed below the red signal line but remains not too far from the zero mark.
Should the pair break below the 50% Fibonacci, this would deepen the bearish risks and open the way for the 61.8% Fibonacci at 0.9765. Failure to hold above this support as well would bring the 78.6% Fibonacci into range at 0.9667.
However, if the key support around 0.9834 is sustained, USDCHF could post an upside reversal and recover towards the 0.99 handle, which is close to the 38.2% Fibonacci level. Clearing this hurdle would strengthen any positive momentum and prices could next target the 23.6% Fibonacci at 0.9989.
In the medium-term, the outlook should remain neutral as long as price action stays close to the 50-day moving average. Further losses in the coming days would threaten shifting the neutral picture to a bearish one.
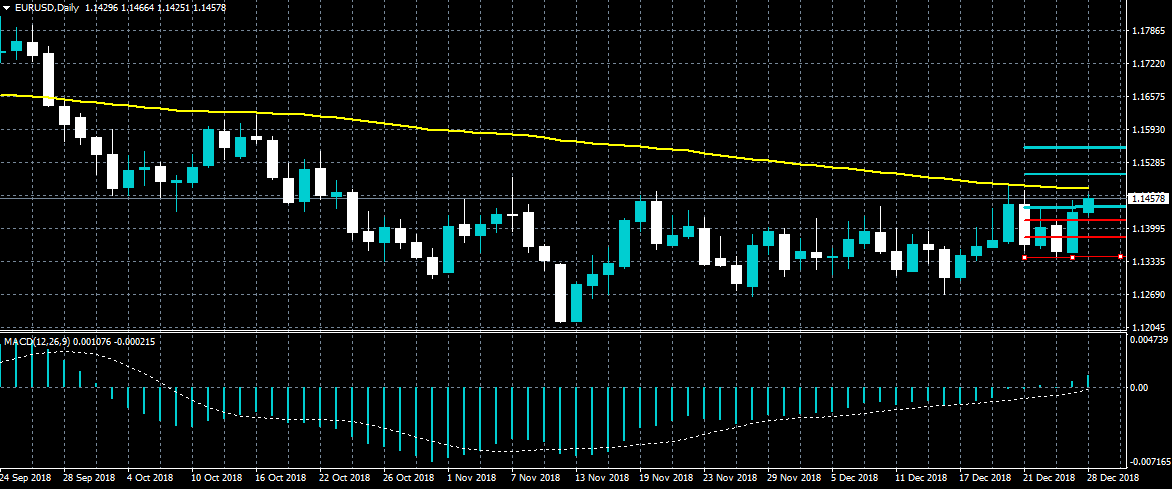
EURUSD Bullish Above 1.1430 Level
The euro is moving higher against the US dollar on Friday, following a clear technical break above the 1.1430 resistance level. EURUSD traders now need to hold price above the pairs one-hundred day moving average, for further bullish advancement towards the 1.1500 level. A loss of the 1.1430 level will likely provoke a technical test of the 1.1410 support level.
The EURUSD pair is bullish while trading above the 1.1430 level, key technical resistance is found at 1.1470 and 1.1500 levels.
If the EURUSD pair trades below the 1.1430 level, sellers may test towards the 1.1410 and 1.1380 levels.
USDJPY Back Under Downside Pressure
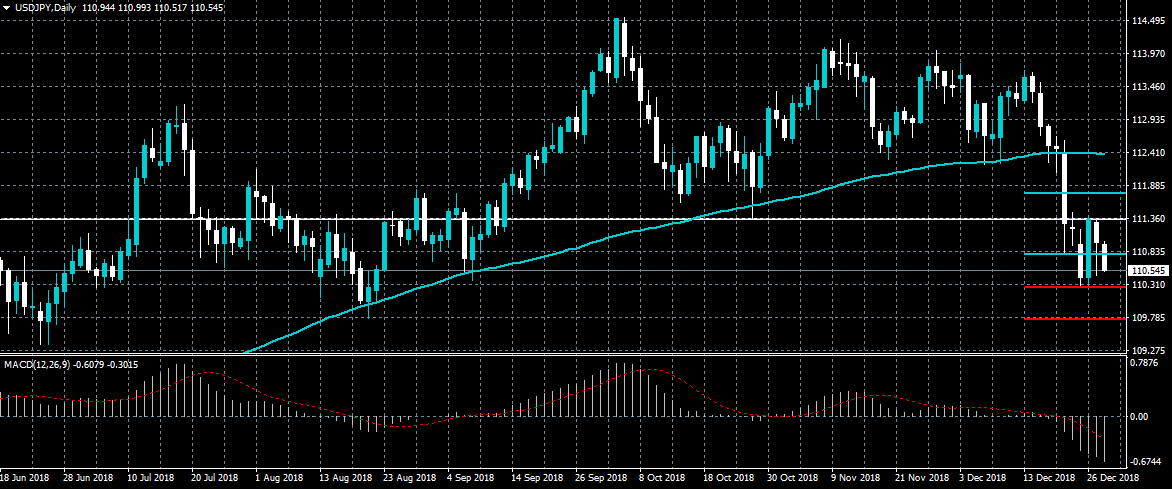
The US dollar is once again back under downside pressure against the Japanese yen, as safe-haven currencies remain in strong demand. The USDJPY has now erased Thursday’s gains and is likely to trade lower while price holds below the 110.80 level. The MACD indicator on the daily time frame is also showing that the USDJPY pair is likely to continue to trend lower.
The USDJPY pair is intraday bearish while trading below the 110.80 level, key technical support is found at the 110.26 and 109.76 levels.
If USDJPY pair trades above the 110.80 level, buyers may test towards the 111.35 and 111.75 levels.