Sample Category Title
Italy coalition government agreed on numbers and contents of 2019 revised budget
In Italy, leaders of the coalition government sounded optimistic that they would eventually avoid disciplinary actions by the EU over its 2019 budget. Leader of the League Matteo Salvini said, after meeting with 5-Star Movement head Luigi Di Maio and Prime Minister Giuseppe Conte, "We have found an agreement on further fiscal reductions that probably will be appreciated by the EU."
Salvini's spokeswoman also said that there is "total agreement between Conte, Salvini and Di Maio on the numbers and contents of the proposal to send to Brussels," regarding 2019 budget plan. And she denied there were tensions within the coalition government and rumors that Prime Minister Giuseppe Conte had threatened to quit.
Separately, Di Maio also said the talks with the commission "will allow us to avoid an infraction procedure".
UK PM May to urged not to “break faith” with British people with another Brexit referendum
According to pre-released text, UK Prime Minister Theresa May will urged parliament today not to "break faith" with the British people with another referendum. She will also warned that "Another vote which would do irreparable damage to the integrity of our politics, because it would say to millions who trusted in democracy, that our democracy does not deliver. Another vote which would likely leave us no further forward than the last"
Separately, Trade Minister said in a BBC show that "it is very clear that the EU understand what the problem is. And it's a question now, without unpicking the whole of the withdrawal agreement, can we find a mechanism of operating the backstop in a way that actually removes those anxieties". He added that "It will happen over Christmas, it's not going to happen this week, it's not going to be quick, it will happen some time in the New Year."
Irish Foreign Minister Simon Coveney told RTE television that "If there is an entirely new proposal coming from the UK, I think undoubtedly it would need a lot more time to be considered on the EU side and that would probably involve an extension of Article 50 or pulling Article 50 for the moment."
EUR/USD Broke Key Support, More Losses Likely
Key Highlights
- The Euro failed to surpass the 1.1440 resistance and declined recently against the US Dollar.
- There was a break below a key bullish trend line with support at 1.1330 on the 4-hours chart of EUR/USD.
- The US Retail Sales in Nov 2018 increased 0.2% (MoM), similar to the forecast.
- Today, the Euro Zone CPI for Nov 2018 will be released, which is forecasted to decline 0.2% (MoM).
EURUSD Technical Analysis
The Euro failed to hold gains above the 1.1400 support after it struggled to surpass the 1.1440 resistance against the US Dollar. The EUR/USD pair declined and broke the 1.1380 and 1.1350 supports.
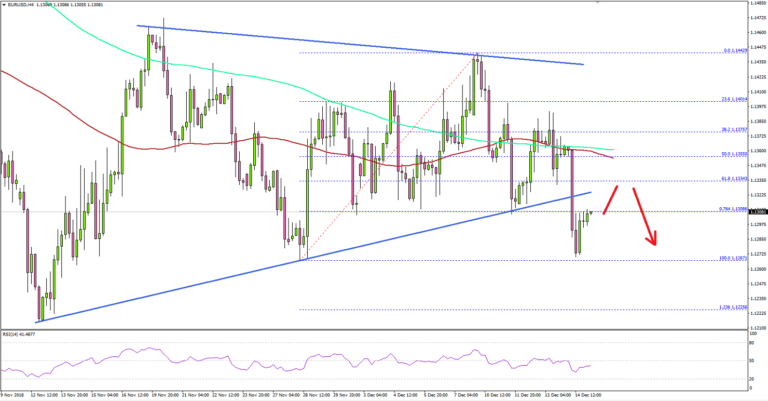
Looking at the 4-hours chart, the pair declined heavily and even broke the 1.1320 support and the 100 simple moving average (red, 4-hours). Sellers pushed the pair below the 76.4% Fib retracement level of the last wave from the 1.1267 low to 1.1442 high.
Moreover, there was a break below a key bullish trend line with support at 1.1330 on the same chart. The decline was such that the pair traded close to the 1.1267 low. On the downside, the next support is at 1.1250, below which the pair may test the 1.236 Fib extension level of the last wave from the 1.1267 low to 1.1442 high at 1.1225.
On the upside, the previous support at 1.1320 could act as a strong resistance. The main resistance is near 1.1355 and the 100 simple moving average (red, 4-hours).
Fundamentally, the US Retail Sales for Nov 2018 was released by the US Census Bureau. The market was looking for an increase of 0.2% in sales in Nov 2018 compared with the previous month.
The result was similar to the forecast and the last reading was revised up from +0.9% to +1.1%. The core retail sales increased 0.2%, less than the last revised reading of +1.0% (up from +0.7%). The report stated that:
Total sales for the September 2018 through November 2018 period were up 4.3 percent (±0.5 percent) from the same period a year ago. The September 2018 to October 2018 percent change was revised from up 0.8 percent (±0.5 percent) to up 1.1 percent (±0.2 percent).
Overall, both EUR/USD and GBP/USD remain in a downtrend and there could be more losses in the coming sessions.
Economic Releases to Watch Today
- Euro Zone CPI for Nov 2018 (YoY) – Forecast +2.0%, versus +2.0% previous.
- Euro Zone CPI for Nov 2018 (MoM) – Forecast -0.2%, versus +0.2% previous.
- Euro Zone Core CPI for Nov 2018 (YoY) – Forecast +1.0%, versus +1.0% previous.
Asia Market Update
Biggest discussions around the market this morning
The upcoming FOMC meeting and China’s policy-setting meeting, has been the most actively discussed topics around the markets this morning. And both events have a smoothing effect on risk sentiment. Chinese President Xi Jinping’s keynote speech at the celebration of the 40th anniversary of China’s reform and opening. The address will start at 10:00 Tuesday morning local time (2:00 GMT). A
We should expect a raft of stimulus measures from China policymakers in an attempt to stabilise the domestic economy.
On the Fed front, the market is banking on a dovish hike which should be kind enough to stabilise equity risk sentiment into year end
Also, everyone is trying to figure out where the dollar drifts in early 2019. Of course, a more dovish Fed gives rise to expectations of a lower USD in 2019 which could provide a small help to Asia and global EM markets regarding FX.
However, a broader slowdown in growth remains the primary concern and I suspect Global growth signals will probably stay dampened through Q1 2019 but as the Pboc unleashes its stimulus war chest to the right the economic ship, there could be a turn around in growth sentiment sooner than expected.
Overall Asia markets are trading mixed with few if any clear signals to drive the bus
The Euro
The Euro is finding support above 1.1300 this morning as better news is filtering through from Italy despite fears of a slowdown in the Eurozone region for 2019 likely to persist. Bloomberg reports, “Italy has identified about EUR3bn of additional funds that could cover a budget deficit of 2.04% of output, a government official said. It is believed that the European Commission had asked the government to come up with an additional EUR3.5bn of reduction in the deficit, last week”. This headline should trigger some bearish bets to unwind. And while it doesn’t trigger a buy EUR signal is does suggest less reason to sell the EURUSD today.
But as you can see no one is precisely knocking the door down to buy Euro’s with last weeks dismal PMI’s fresh in trader minds.
Oil markets update
Oil is finding support at WTI 51 as the drop in Baker Hughes rig counts points to a near-term slowdown in US production and when combined with Saudi Arabia is expected to cut export to the US to draw down inventory builds it should provide a short-term base despite global slow down fears continue to resonate.
Also, we could see a knee-jerk reaction higher in oil prices and commodities in general if the China Central Economic is working conference signal more aggressive policy stimulus, so some short covering is unfolding in hopes to re-engage bearish bets on a possible knee-jerk higher.
Singapore
In yet another casualty of tariff wars, Singapore NDOX disappoints Singapore November non-oil domestic exports MoM have come at -4.2% versus 2.3% expected. The YoY number is -2.6% versus 1.8% expected
Twas The Week Before XMAS And Markets Are Waiting For Bedlam To Break Out
Twas the week before XMAS and markets are waiting for bedlam to break out. Old Blighty is in Brexit purgatory, while the Fed remains a multistory. President Trump will be accusatory, while China remains conciliatory. US economic data could prove to be transitory, but I’m sure traders would rather be in the Yukon territory. After all, it is the week before Christmas.
But for all intents and purposes, this week is the last for position taking before the holiday thinned-trading conditions take over and year-end flow dominate.
The US markets floundered to the lowest close since April
So far this holiday season Santa has only delivered a bag of bother: Brexit impasse, European political mess, a global growth sinkhole and Trump legal issues, to name a few.
Global equity markets melted in front of our eyes on Friday. The synchronised global growth slowdown continues to gather weight with China’s weaker consumption data confirming the extent to which it is being felt in China., Poor PMI’s in EUR and horrendous GDP print in Australia amidst a Sydney housing market meltdown, suggest no country is immune to the global economic downturn.
We knew EM, and the rest of the world was struggling, but I think the Fed’s early warning signal a few weeks ago that they are concerned that the benefit of Trumps tax cuts would fade continues to resonate. After all, it was the US market that was carrying the weight of global risk sentiment on its shoulder. If the US economy turns south, we’re in for a world of hurt. Fortunately, however, US retail sales and Industrial production held up their end of the bargain and yet again global risk sentiment is riding on the US market coattails. Even still, investors were unwilling to celebrate the strong US retail sales report Friday. Instead, soft European PMI’s, weaker China data and lower Oil prices were the focus. And all but ignored China announcement to lift retaliatory tariffs on US cars for three months but completely priced in hence the muted reaction
Oil Markets
The Baker Huges US Crude oil drilling rig count is down four as WTI prices continue to slide.
The Horrendous EU PMI’s, weak Chinese consumption data, a dimmer view for Japanese Tankan survey all point towards slower growth in Q 1 2019. These weaker economic data points are hardly a ringing endorsement for commodity prices. But it’s the likelihood of protracted slow down in China that continues to stoke fears of demand slowdown.
Besides to the USA, China and Japan are the worlds largest consumers of oil, so when those counties economies go into the tank, it blunts demand for oil and provides an exceedingly bearish backdrop for prompt contracts in the context of a currently oversupplied market.
Oil markets have been struggling for direction post-OPEC wth traders reading between the headlines and watching US inventory numbers to gauge shale output. Keeping in mind U.S. shale-oil industry production is being restricted as the construction of pipelines and other infrastructure bottlenecks keep are blunting supply from Permian Basin and Bakken formation’s but new pips are coming in 2019. The more OPEC tries to cut supply and drive prices higher the bigger the door opens for US shale producers.
But even The International Energy Agency said it’s too early to tell whether oil-supply cuts announced by OPEC and its allies last week will succeed in balancing global markets.
With market struggling for direction OIl prices were very prone to shift in risk aversion, but when risk off is triggered by global growth concerns it particular impactful for oil prices.
Gold Markets
A resurgent US dollar is threatening to cut short a developing rally in gold markets as the stronger dollar continues to offset the positive impact from the sell fo in global equity markets.
Currency Markets
USD: Still King of the Hill?
A strong US retail sales report for November – not only did November numbers beat expectations, but there were also significant revisions to the prior statement.
The strength of this data makes a stark contrast to the shocking data overnight in both Europe and China. Once again, it confirms that the US economy continues to outperform its peers by a considerable margin and suggest the USD is still the king of the hill benefiting from the worlds most robust economy and highest G 10 yields.
And while the much-ballyhooed convergence story will eventually happen, it’s looking so far in the distance today after weak EU and China data, that we could see the EURUSD test 1.1000 and USDCNH above 7 in Q1 2019. The USD could be further supported by haven demand as the USD appears to be the best currency option to park money for the foreseeable future given that it is the highest yielding G-10 currency
EUR: Trader’s plunder the EURO after EU PMI’s plummet
The EURUSD tested the critical 1.1275 level on Friday. But fortunately, it was Friday as traders weren’t all that enthusiastic to sell the 1.12 handle ahead of the weekend. Not mention this week is effectively the last week of the trading year before year-end flow dominate were currency movements tend to adopt a random walk theory.
Predictably, markets short covered into the ” witching hour” *(17:00 GMT) and the EURUSD did close precariously just above 1.1300.level. However Eurozone PMI’s have been a particularly important driver EURUSD sentiment, and when combined with the growing political sinkhole in Europe, it does suggest markets will remain underweight EU assets which should continue to weigh on EUR sentiment.
GBP: Brexit Bedlam
Currency stress around Brexit are at the similar level’s seen weeks before the 2016 referendum suggesting that we are at a very critical inflexion point for Cable as the markets are increasingly pricing in more two risks and despite sentiment remain poor it leaves plenty opportunity for sterling to bounce much higher should more clarity emerge. But on the flip side the longer the debate drags on, the more uncertainty seeps in. But frankly, PM May needs to stop running back to EU leaders with cap in hand, as it does little more than weekend UK assets and places Parliament in a weaker position. But let’s be honest, I think everyone is at a point were a seconded referendum, to some still a castle in the air, may be the only way out of Brexit bedlam
AUD: Remain driven by China proxy trades but the focus remains on the Feds.
Asia EM FX
With all the negative economic signals coming out of China its hard to remain positive on EM FX Asia but until all the Trade war tail risk are priced out, I don’t think investors will ever feel particularly comfortable with EM Asia exposure. And with the market not focusing on the broader implication of a global growth slow down, it’s getting difficult to find a convincing counterbalance. And while the Feds could signal a dovish hike this week, FX differentials haven’t been that convincing a driver especially when global risk asset remain under pressure. Strong US economic data makes a stark contrast to comprehensive financial data which suggest the USD will stay in favour
The MYR could feel the pinch this week as the slowdown in global will pressure oil and commodity prices lower, while trade war risk continues to weigh on the domestic growth side of the equation. While the strong USD makes Malaysia bond less attractive
Three Critical Drivers This week and beyond
The Federal Reserve Board
The market widely expects the Fed to raise rates for the fourth time in 2018 at its December meeting this week. However, the more important question will be what signal the Committee sends about its policy path in the coming years. Given the recent equity market meltdown, the Feds are tasked with a delicate balancing act of convincing the markets the US economy looks upbeat while delivering a dovish view. Fortunately for the Feds, they can sound very optimistic, the market has done a great deal of the heavy lifting as there isn’t a lot of hawkishness priced into 2019 and beyond. Plus we’re very close to the end of this rate hike cycle, and all that is left for markets to decide is the pace of normalisation to reach the Fed’s terminal rate. Within this context, the playbook suggests the Fed signals some data-dependent flexibility around the speed of rate hikes which could help to ease financial conditions and ultimately provide some equity market relief heading into 2019.
Trade war, why investors are still nervous and trade détente petered out.
The Trump administration’s position on China has always been beyond tariff and trade. Its always been about global security concerns, the deliberate theft of intellectual property rights and US technology know how. And frankly, global capital markets continue to miscalculate this high stake game of axis and allies while mostly reacting small positives while interpreting positive Trump tweets as some sign of a trade truce.
While its fair to say post-G-20, we are nearing “peak” tariff war, although there will probably be one final escalation at the end of the G-20 trade detente. But more significantly, we’re on the cusp, if the recent Huawei incident is any indication, of entering the next stage of the Trump administration’s China strategy, were tension will US-China tensions will spill over into both familiar and unfamiliar areas. Of course, the US will continue to clamp down on China tech sectors, but the US policy hawks John Bolton and Peter Navarro, have made it known Africa looks likely to be the next theatre of engagement for US-China relations where concerns are mounting that poorer African nation will fall prey to China’s “debt trap”.
Recall, Sri Lanka took massive loans from China in sums the small island nation had absolutely no way to service, but when China played hardball over payment delays, the Sri Lankan government handed over the Hambantota port and 15,000 acres of land around it for 99 years. Indeed China is a great student of the US Founding Fathers as it was John Adams who famously stated “ ‘There are two ways to conquer and enslave a nation. One is by the sword. The other is by debt.’
China Central Economic Working Conference ( CEWC)
The conference begins Tuesday where the government will set forth a roadmap of economic policy for the upcoming year. The market expects policy markers to reaffirm 6.5 % GDP target. And despite Markets forecast that China’s deficit will go up by 3% next year; the government is expected to give a tax cut that will benefit the majority of the people in the country. But the markets will be focussing on any reassessment of mainland’s deleveraging policies and measure to rebalance growth. But according to the local media sources, the Pboc tweaks are not going to include additional loosening in monetary policy as financial regulators will focus more on the medium-to-long term credit supply, rather than short-term next year?
GOLD Remains Weak And Vulnerable To The Downside
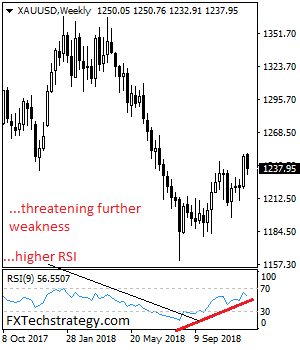
GOLD remains weak and vulnerable to the downside as it looks for more weakness. On the downside, support comes in at the 1,230.00 level where a break will turn attention to the 1,220.00 level. Further down, a cut through here will open the door for a move lower towards the 1,210.00 level. Below here if seen could trigger further downside pressure targeting the 1,1200.00 level. Conversely, resistance resides at the 1,250.00 level where a break will aim at the 1,260.00 level. A turn above there will expose the 1,270.00 level. Further out, resistance stands at the 1,280.00 level. All in all, GOLD looks to weaken further lower.
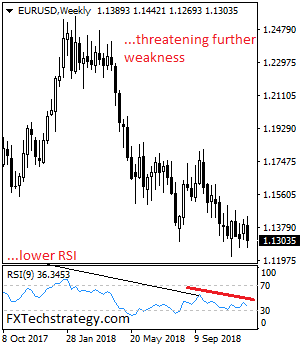
EURUSD Broader Bias Remains Lower
EURUSD remains biased to the downside on further corrective pullback. Support lies at the 1.1250 where a violation will aim at the 1.1200 level. A break below here will aim at the 1.1150 level. Further down, support lies at the 1.1100. On the upside, resistance resides at 1.1350 level with a break through there opening the door for further upside towards the 1.1400 level. Further up, resistance comes in at the 1.1450 level where a violation will expose the 1.1500 level. All in all, EURUSD continues to face downside towards key support.
Eco Data 12/17/18
[php_everywhere instance="1"]
The Only Thing We Have To Fear… Is Fear Itself
Amidst the Great Depression in 1933, U.S. president Franklin Roosevelt’s inaugural address cited the now-famous phrase “the only thing we have to fear is fear itself” . Today’s financial markets and economic environment bear zero resemblance to that period, but the words remain fitting given media headlines filling up with “recession talk”. Let’s take a quick look at what the data reveals and compare it to the rhetoric. Financial and economic indicators have yet to breach levels that would signal an impending recession. This needs to be the first pillar to fall into place. Once it does, the historical signals have provided a one to two year advance notice of the recession. Because economic cycles don’t follow the same pattern due to differences in risks, it’s important to look at a broad set of data.
Financial Market indicators:
1. Volatility
How many times have you checked the stock indexes at 11am and then again at the close, only to find out that neither bore any resemblance to each other? One of the more notable shifts between 2017 and 2018 occurred with financial market volatility. We offer some selections below on how this volatility is captured in the data, and compares to other periods.
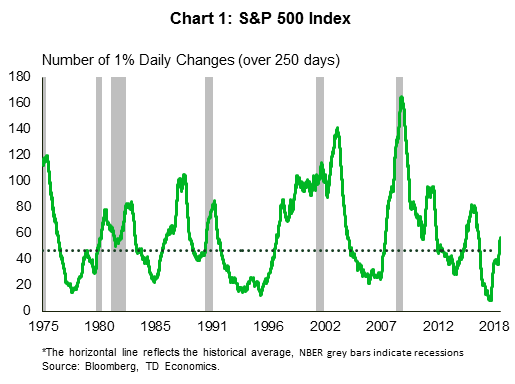
The number of 1% changes in the value of the S&P 500 index in a single day has broken just above the historical average, but remains below other non-recessionary periods (Chart 1). Sudden stock market swings can cause nausea, but it’s not the most reliable predictor of a recession (Paul Samuelson’s famous remark was that stock markets have predicted nine of the past five recessions). If we took our cue from equity price movements, we would be on our third recession call since 2009. Eventually this indicator will be right when there are parallel or supportive movements occurring within other risk-assets.
2. Risk assets
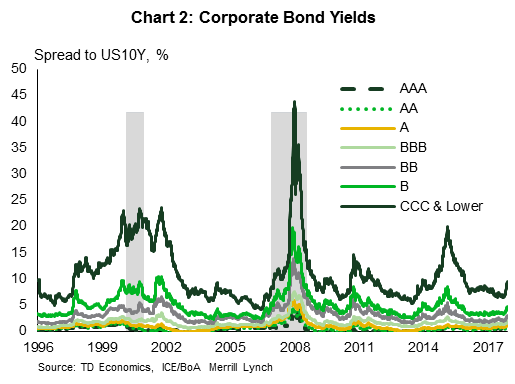
On that front, take a look at corporate bond yields (Chart 2). Yields and spreads have edged up, but maintain a healthy margin below other “stress” periods, such as the European debt crisis (2011), China growth concerns (2015) and even ahead of the 2001 recession. This latter period is of interest, because the center of risks in this economic cycle resides within high corporate leverage (as opposed to a consumer cycle marked by household leverage). We might expect this cycle to have some parallel to 2001 as investors head for cover, but that has yet to occur.
3. Yield curve
One of the most reliable forward indicators of a recession is the U.S. Treasury yield curve. There’s been much ado about the flatness of the curve, and we have written extensively on this topic. (See report)
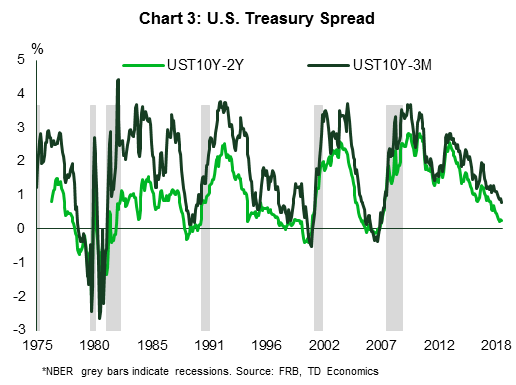
On this metric, the UST 10-2yr curve has flattened to roughly 13-15 basis points. As Chart 3 demonstrates, the spread looks uncomfortably narrow, but has yet to invert. In the event that it does, it has offered a one to two year lead-time to the start of a recession in the case of the 1990, 2001 and 2008 experiences. Importantly, the first of the two conditions has yet to even fall into place.
In December, the UST 5-2yr spread popped onto everyone’s radar when it inverted by 1-3 basis points. This is not typically the spread monitored as a recession signal, but it should definitely be watched as a possible precursor for the rest of the curve. There’s a clear risk the inversion at the front of the curve reflects the settling in of more dovish market sentiment that is second-guessing the economic outlook relative to the Fed’s policy path. Of note, this segment of the curve is a bit more prone to very long lead times (i.e. 1998, versus the eventual shallow recession in 2001). It would also likely need to move deeper into negative territory to offer a more convincing signal. At the time of writing, the spread was bouncing around from being perfectly flat to only -1 basis point.
Since it’s such a shallow inversion, the natural inclination is to first decipher whether technical factors may be at play. This is possible given the Fed’s asset unwind initiative following years of Treasury accumulation under the quantitative easing program. Certainly an area prone to distortions is the 1-5 year tenure space, where the Treasury has focused its issuance in recent years. A Reuters article recently noted that, after amassing a record level, hedge funds and other speculators had suddenly scaled back on bets that Treasury prices would decline1. The heaviest of this action occurred against 5-year maturities. Since none of the other financial indicators are flashing red, a very shallow inversion within only a segment of the curve would suggest other factors may indeed be at play.
The Federal Reserve would likely dismiss the inversion as a technical factor and certainly other international agencies have noted the greater potential for the yield curve to send false signals during this cycle due to the distortions created by large central bank balance sheets. However, we think that when it comes to the bond market, follow the money. Should the inversion broaden out across tenures, alongside dovish signals from other economic or financial indicators, then our bet is on the bond market calling it right. But, that day is not today.
Economic Market Indicators:
4. Economic risk index
Aside from financial market indicators, we’ve constructed an economic risk-index to capture turning points in performance (Chart 4). This index is a catch-all of economic indicators spanning production, the labor market and consumer patterns. The zero line captures the historical average. At a -1 standard deviation, the data corresponds with a recession. Waiting to call a recession at that point would be old news, so ideally the red-flag should be raised at the half-point mark, with a yellow-flag going up once it tips below the zero threshold. However, caution is needed due to the probability of false-positives.
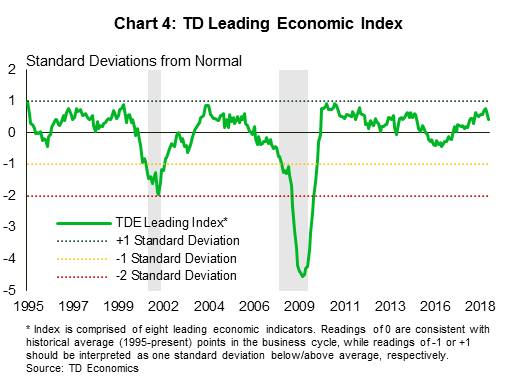
In any event, the current indicator is far off all of the markers that would send up any cautionary flags. And, if you’re wondering about the recent dip in the index, it’s due to business orders. More specifically, the culprit is deteriorating export orders. This likely reflects the combination of slowing global growth that is being further exaggerated by the U.S. trade war impact.
5. Confidence
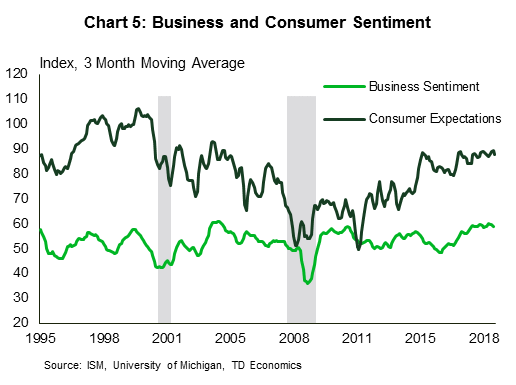
The last of the data round-up needs to be with confidence measures, which critically lay the foundation for any business cycle. Here too, both business and consumer sentiment are holding at elevated levels, which is even a bit surprising given the rise of “recession” talk within financial market circles (Chart 5).
For example, take the release of U.S. employment data in early December. The news headlines highlighted the disappointment of “only” 155K jobs, which was below market expectations. With a bear-tone embedded in the market, this payrolls report was doomed for failure. Basically, a strong report would have been dismissed with a neutral market reaction, but a weaker-than-expected report serves to reinforce negative bias when risk-off sentiment dominates. We have commented before that what’s most astounding is that the U.S. continued to post job numbers in excess of 200K for most of this year, fighting against the dynamics created by a tightening labor pool and worsening demographics. For 2018, the average monthly job tally is 207K and the unemployment rate is near a 50-year low at 3.7%. A reasonable market expectation would be for job gains at around 150K as a marker of a more sustainable expansion, rather than north of 200K. And, if a further reality check is needed, the string of positive job gains that has occurred in this expansion cycle (i.e. post-2009) is the longest on record at 98 consecutive months, even though the business cycle has yet to make the claim of fame as the longest on record.
Will the business cycle fall prey to Beetlejuice syndrome?
All this to return us to where we began: the only thing we have to fear is fear itself. According to a quarterly Duke University CFO Global Business Outlook survey, almost half (48.6%) of U.S. chief financial officers believe the economy will be in a recession by the end of next year2. Interestingly, these same CFOs believe the U.S. will expand by 2.7% in 2019. This is above our own estimations of 2.5%, suggesting that incongruent or lofty expectations may be the problem here, rather than the actual data trends.
However, beliefs and sentiment create outcomes. Business investment intentions become more cautious, and we risk having a prophecy be fulfilled by behavior adjustments, particularly if households respond in a similar fashion. In economics, this is captured by the notion of the paradox of savings (or thrift). A small number of firms or individuals deciding to take a precautionary stance in investing less or saving more due to their individual financial statements does not have widespread ramifications. But, when it occurs on a large scale, it actually lowers the national output and income, resulting in less savings, which subsequently causes more precautionary behavior to set in, creating a downward spiral. Take note if there’s a chorus of people saying, “I’m not buying that house until the recession hits, then I’ll get a better deal.”
Could 2019 be our “Beetlejuice year”? Just like the movie, saying a word too many times makes it appear. Time will tell and we’ll keep a close eye on the data. But for now, we suggest hitting the “pause” button on using the recession word until there’s stronger evidence in the data. This may prove to be a hard thing to ask of financial markets, however. As we’ve detailed in our latest quarterly economic forecast, there is little question that global and U.S. economic momentum has passed the high-water mark – as it should on demographic fundamentals, capacity constraints and less monetary accommodation. This has been well telegraphed in our forecasts, but the market and media response will be a harder call.
In particular, government decisions will play a much larger role in 2019. Event risks will carry even more influence than in 2018 due to fast approaching deadlines occurring in the first quarter related to Brexit, the U.S. debt-ceiling and U.S.-China trade tensions. Any one of these would be sufficient to undermine market confidence, let alone all of them overlapping in the early part of the New Year. So, who can blame investors for being more cautious? Event risks require political solutions, are not easily forecastable and, by extension, can lead to unintended consequences.
End Notes
EUR/USD Weekly Outlook
EUR/USD stayed in range of 1.1267/1472 last week. Initial bias remains neutral this week with focus on 1.1267 support. Break there will suggest that larger decline is resuming and target 1.1251 low next. Decisive break there will confirm this bearish case. EUR/USD should drop through 1.1186 fibonacci level to 61.8% projection of 1.2555 to 1.1300 from 1.1814 at 1.1038 next. And in any case, near term outlook will remain bearish as long as 1.1472 resistance holds.
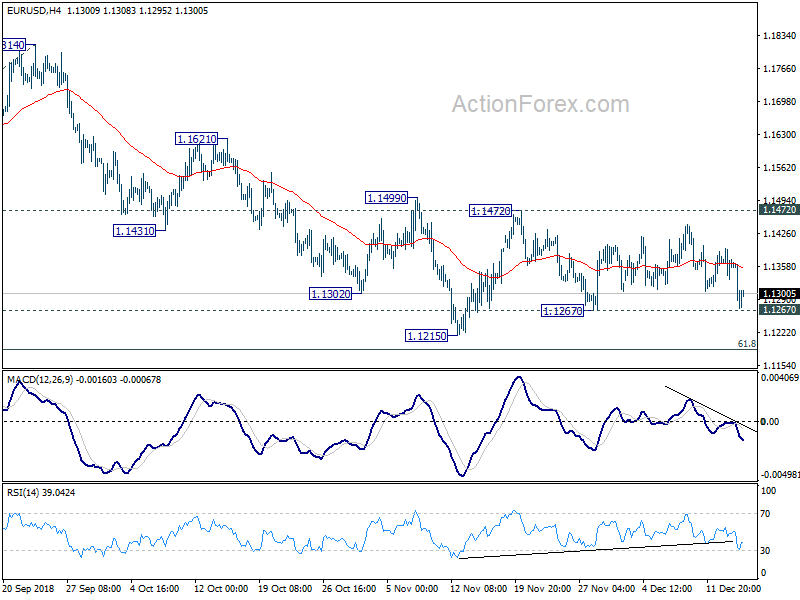
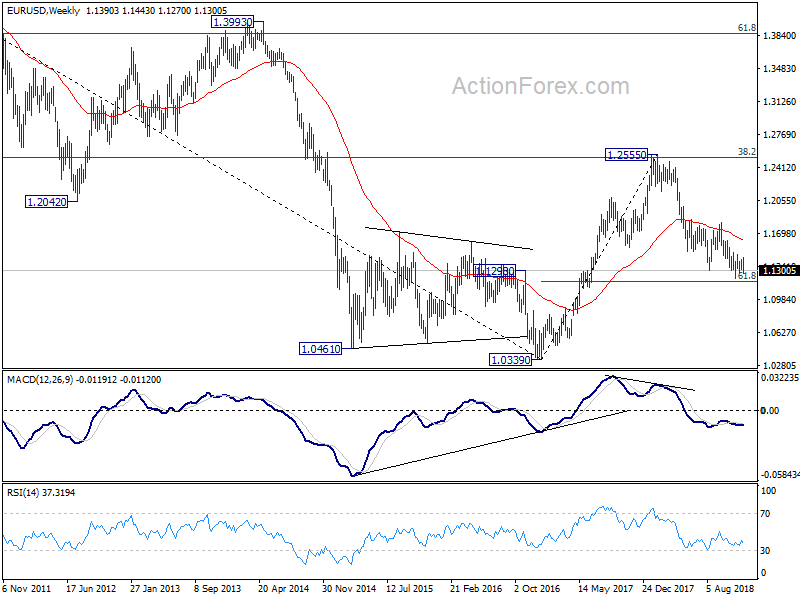
In the bigger picture, as long as 1.1814 resistance holds, down trend down trend from 1.2555 medium term top is still in progress and should target 61.8% retracement of 1.0339 (2017 low) to 1.2555 at 1.1186 next. Sustained break there will pave the way to retest 1.0339. However, break of 1.1814 will confirm completion of such down trend and turn medium term outlook bullish.
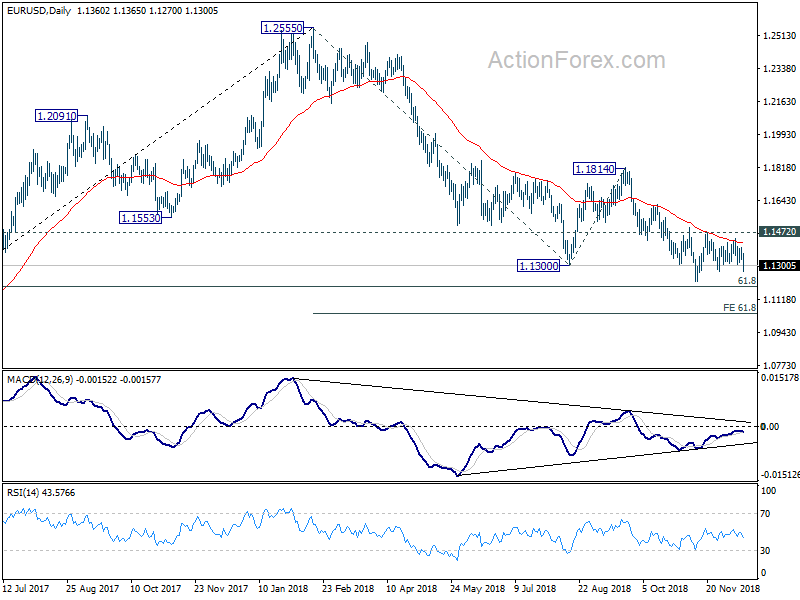
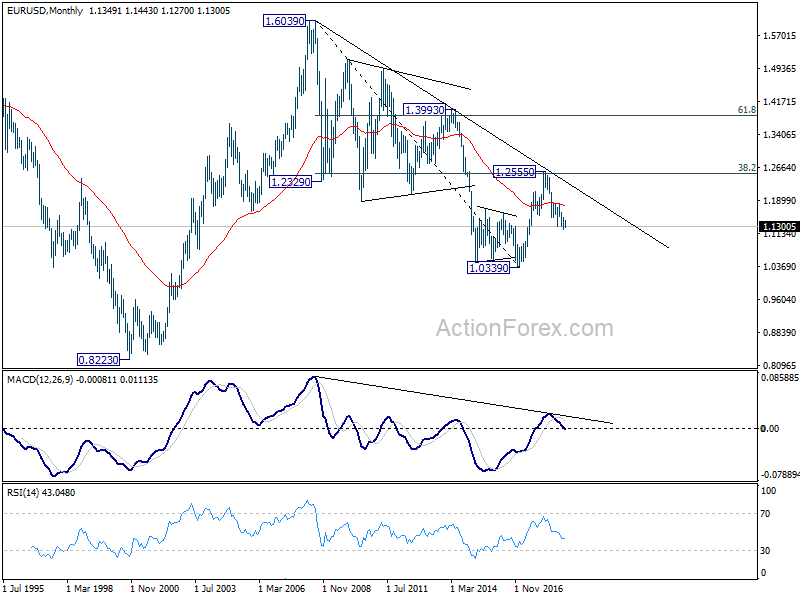
In the long term picture, the rejection from 38.2% retracement of 1.6039 to 1.0339 at 1.2516 argues that long term down trend from 1.6039 (2008 high) might not be over yet. EUR/USD is also held below decade long trend line resistance. Firm break of 61.8% retracement of 1.0339 to 1.2555 at 1.1186 should at least bring a retest on 1.0339 low. This will remain the favored case as long as 1.1814 resistance holds.