Sample Category Title
SNB Meeting: No Hawkish Bits Yet
The Swiss National Bank (SNB) is widely expected to keep its policy rates unchanged at record lows on Thursday, at 0830 GMT. Markets will look for signals on whether a rate increase in 2019 is on the cards, though considering the weakening momentum in recent Swiss data and the current level of the franc, they’re unlikely to find any. Consistently dovish guidance would argue for a weaker franc over time, barring an escalation of global risks.
In stark contrast to almost all its major policymaking-peers, the SNB has refrained from providing any signals that it’s considering whether and when to begin exiting its negative interest rates policy, even despite the marked improvement in Swiss economic indicators earlier this year. Hence, it is all the more unlikely to provide them now, at a time when the data have started to lose momentum again and global uncertainties are riding high, pushing the franc higher given its safe-haven status.
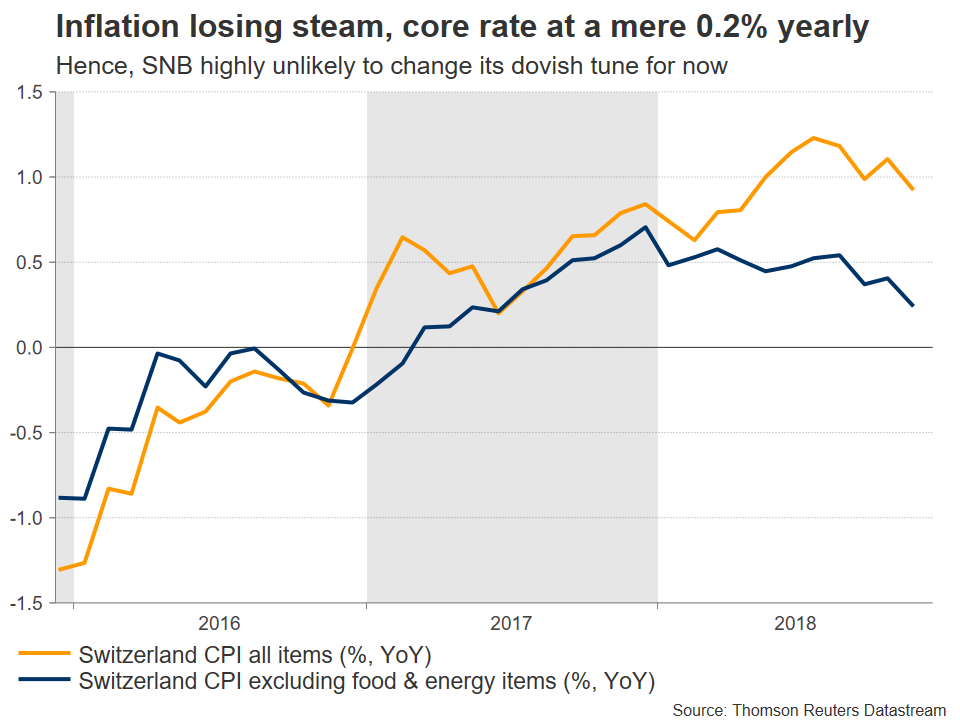
Specifically, inflation seems to have peaked and is drifting lower, with the core CPI rate resting at a mere 0.2% in yearly terms – flirting with deflationary territory. Meanwhile, the economy contracted in Q3, with GDP growth clocking in at a disappointing -0.2% from the previous quarter. To make matters worse, the franc has regained ground against the euro; remember that an appreciating currency tends to hold down inflation, so the SNB pays very close attention to the exchange rate. So much so, that the Bank has frequently intervened in the FX market to weaken the franc when global uncertainties cause it to appreciate.
Needless to say, even the faintest hint from the SNB that it may raise rates next year would be enough to trigger a meaningful rally in the currency – a path policymakers surely wish to avoid, as it would undermine their inflation-lifting efforts. Instead, they may stick to the same language, both on the franc and policy, reiterating that the currency remains “highly valued” and the Bank will continue to intervene in the FX market, while also maintaining negative interest rates.
In terms of the market reaction, a continued dovish tone would argue for a softer franc over time, particularly versus currencies of nations that are raising rates, as interest rate differentials between Switzerland and the rest of the world widen. The key risk to this would be any global development that triggers a so-called “flight to safety”, for instance an escalation in trade tensions or the Italian standoff, a major market selloff, or a disorderly Brexit. Put differently, although relative interest rates would favor a weaker franc overall, the haven currency may still enjoy “waves” of strength in case global risks intensify.
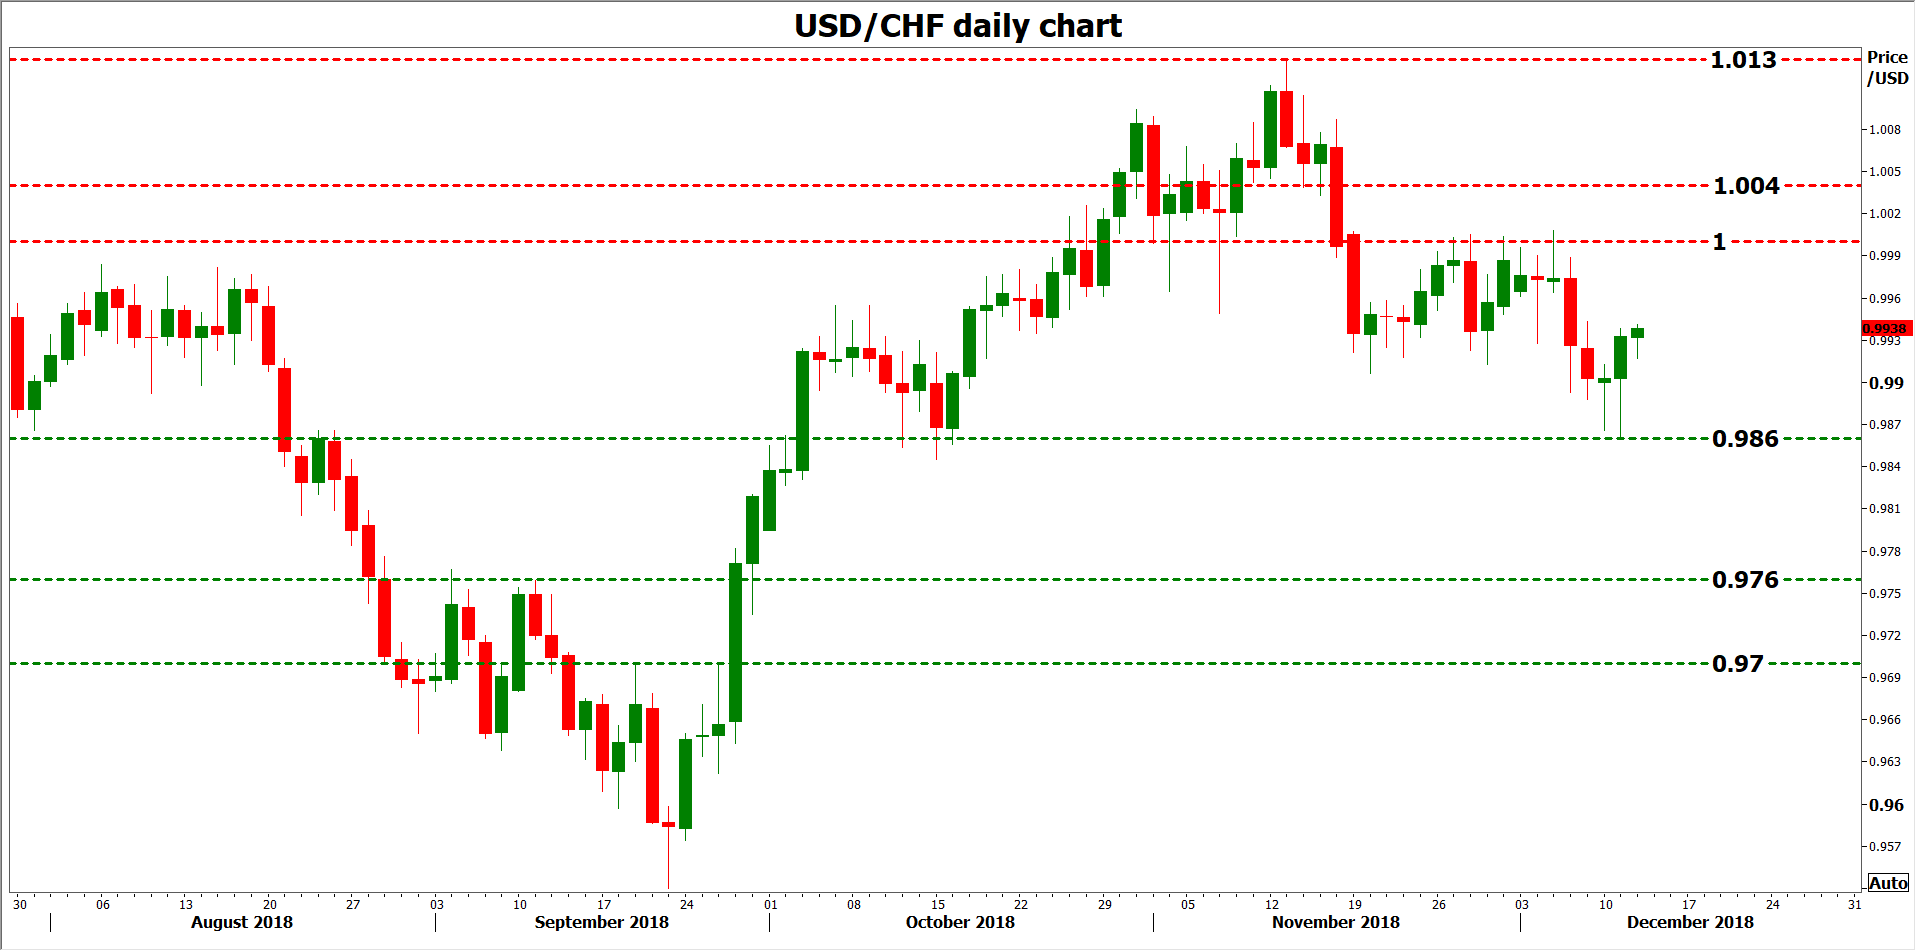
Technically, advances in dollar/franc could encounter resistance near the 1.000 handle, with an upside break opening the way for a test of 1.0040, the inside swing low of November 14. On the flipside, support to further declines may come around 0.9860, a zone defined by the December 11 low. Even lower, the September 11 peak of 0.9760 would attract attention.
The Analytical Overview Of The Main Currency Pairs
The EUR/USD currency pair
Technical indicators of the currency pair:
Prev Open: 1.13552
Open: 1.13160
% chg. over the last day: -0.30
Day's range: 1.13148 – 1.13340
52 wk range: 1.1214 – 1.2557
The EUR/USD keep having a negative dynamic. The demand on the USD remains due to recovery of the US Treasury bonds yield and positive reports. The EUR is consolidating. The local support and resistance are 1.13100 and 1.13350. The trading instrument can descend further. Investors expect important stats from the US.
The Economic News Feed for 12.12.2018:
Inflation Report (US) – 12:00 (GMT+2:00);
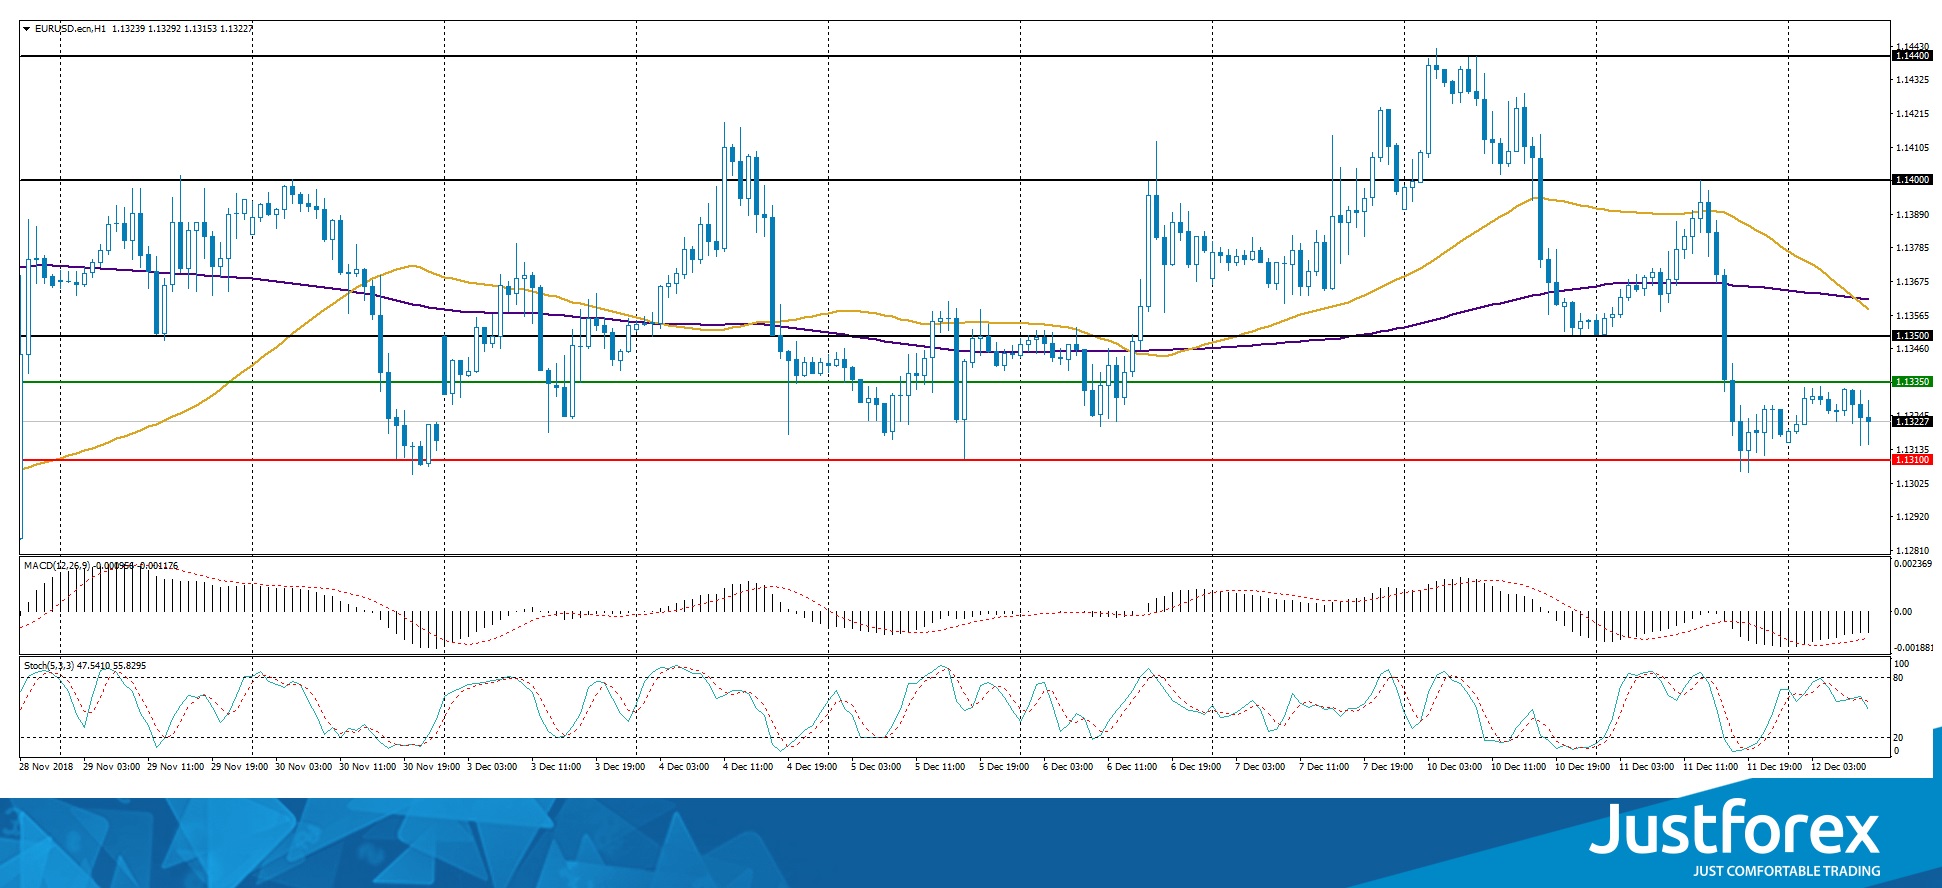
The price fixed below 50 MA and 200 MA which indicates the power of the buyers.
MACD is in the negative zone but above the signal line, which gives a weak signal to sell EUR/USD.
The Stochastic Oscillator is in the neutral zone, the %K line is below the %D line, which indicates a bearish mood.
Trading recommendations
Support levels: 1.13100, 1.12800, 1.12500
Resistance levels: 1.13350, 1.13700, 1.14000
If the price fixes below the support 1.13100, expect further descend towards 1.12800-1.12500.
Alternatively, the quotes can recover toward 1.13500-1.13750.
The GBP/USD currency pair
Technical indicators of the currency pair:
Prev Open: 1.25557
Open: 1.24846
% chg. over the last day: -0.55
Day's range: 1.24763 – 1.25497
52 wk range: 1.2510 – 1.4378
GBP/USD keeps falling. The trading instrument updated the local minimums. GBP remains under pressure due to the Brexit conundrum after Theresa May cancelled the vote regarding the country leaving the EU. We recommend you keep an eye on the issue. The quotes are consolidating around 1.24850-1.25400.
The News Feed is calm for today.
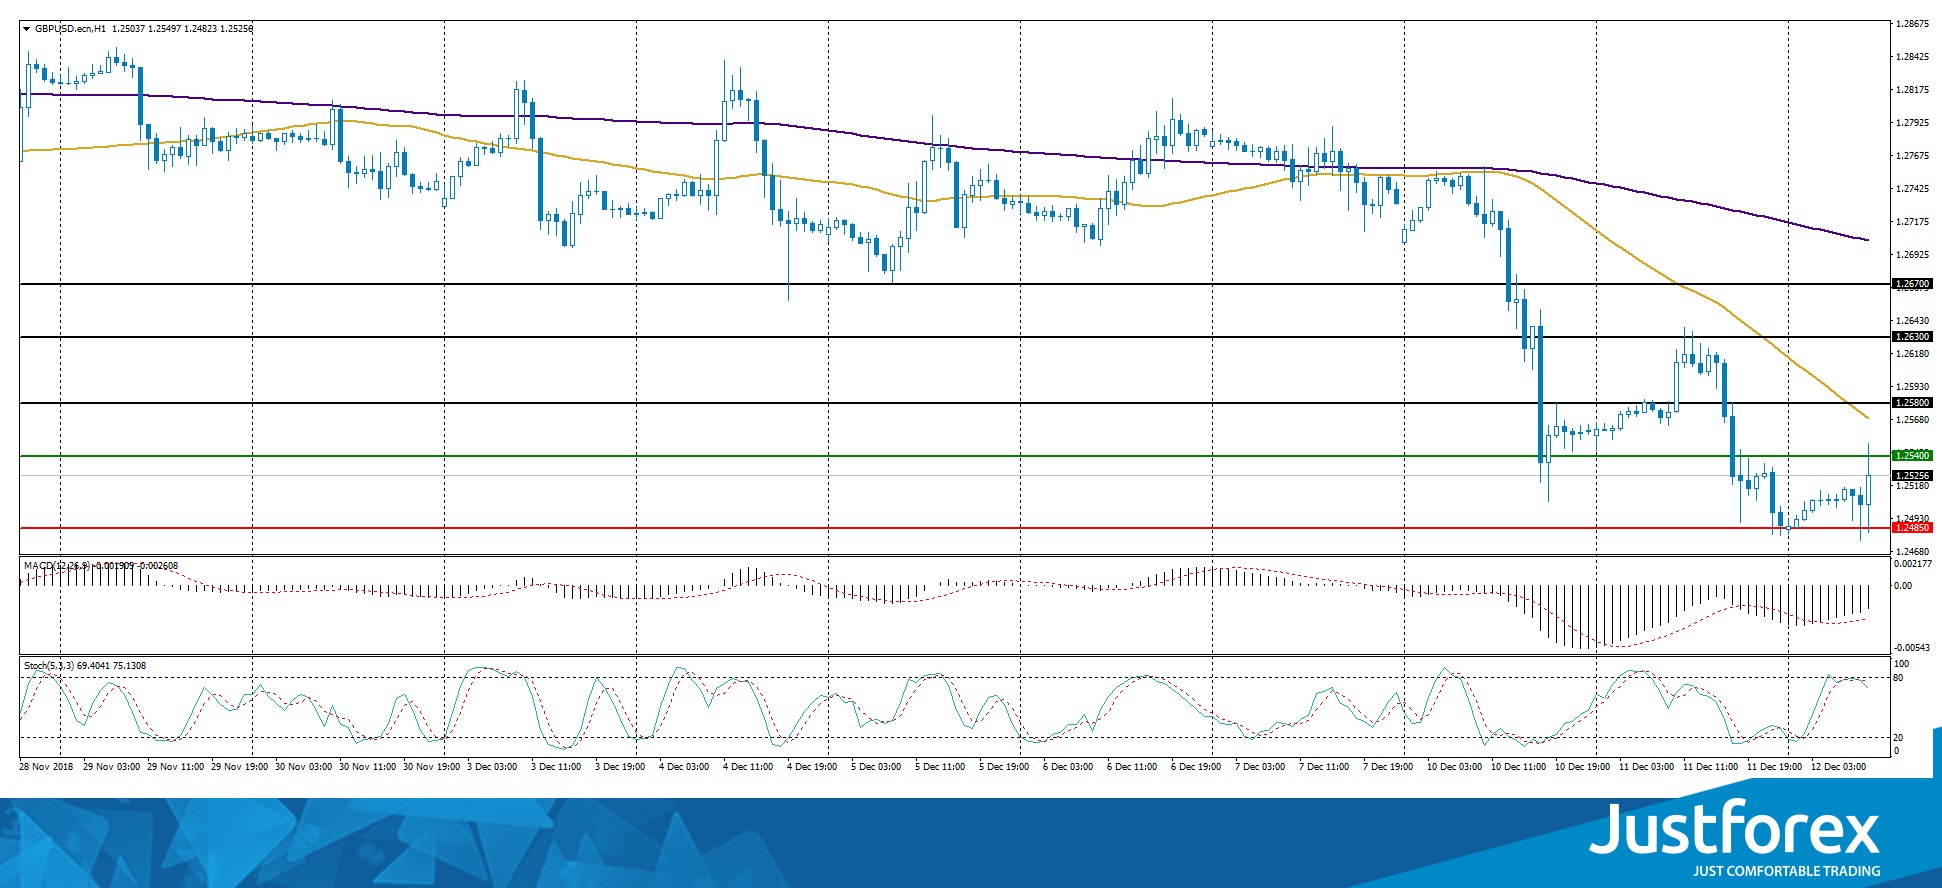
The price fixed below 50 MA and 200 MA which indicates the power of the buyers.
MACD is in the negative zone but above the signal line, which gives a weak signal to sell EUR/USD.
The Stochastic Oscillator is in the neutral zone, the %K line is below the %D line, which indicates a bearish mood.
Trading recommendations
Support levels: 1.13100, 1.12800, 1.12500
Resistance levels: 1.13350, 1.13700, 1.14000
If the price fixes below the support 1.13100, expect further descend towards 1.12800-1.12500.
Alternatively, the quotes can recover toward 1.13500-1.13750.
The GBP/USD currency pair
Technical indicators of the currency pair:
Prev Open: 1.25557
Open: 1.24846
% chg. over the last day: -0.55
Day's range: 1.24763 – 1.25497
52 wk range: 1.2510 – 1.4378
GBP/USD keeps falling. The trading instrument updated the local minimums. GBP remains under pressure due to the Brexit conundrum after Theresa May cancelled the vote regarding the country leaving the EU. We recommend you keep an eye on the issue. The quotes are consolidating around 1.24850-1.25400.
The News Feed is calm for today.
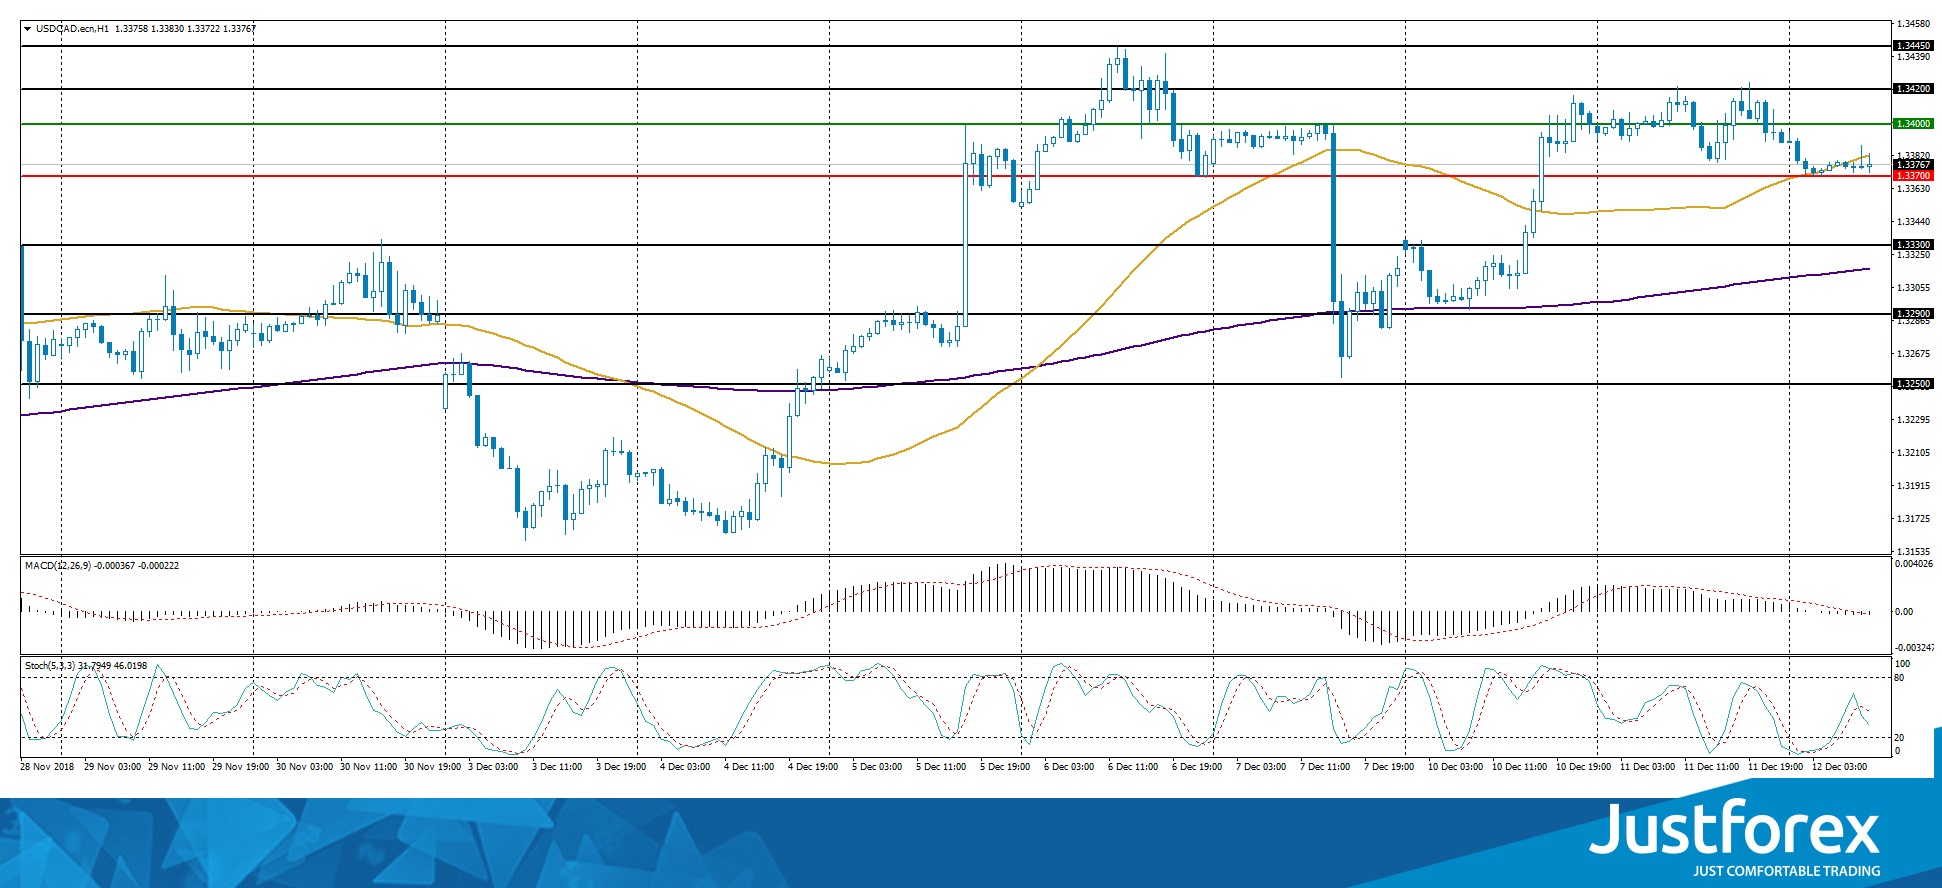
The indicators do not provide singals: the price has crossed 50 MA.
The MACD histogram is around 0.
The Stochastic Oscillator is in the neutral zone, the %K line is below the %D line, which points towards the decline of the USD/CAD quotes.
Trading recommendations
Support levels: 1.33700, 1.33300, 1.32900
Resistance levels: 1.34000, 1.34200, 1.34450
If the price fixes above 1.34000, further growth of the USD/CAD quotes is expected. The movement is tending to 1.34300-1.34500.
Alternative option. If the price fixes below 1.33700, we recommend looking for market entry points to open short positions. The movement is tending to 1.33300-1.33000.
The USD/JPY currency pair
Technical indicators of the currency pair:
Prev Open: 113.317
Open: 113.364
% chg. over the last day: +0.04
Day's range: 113.309 – 113.516
52 wk range: 104.56 – 114.56
USD/JPY is consolidating around 113.500. 113.250 is the mirror support. The trading instrument has prospects for growth. The financial market participants expect reports from the US and new data regarding the Treasury bond yield. Positions should be opened from the key levels.
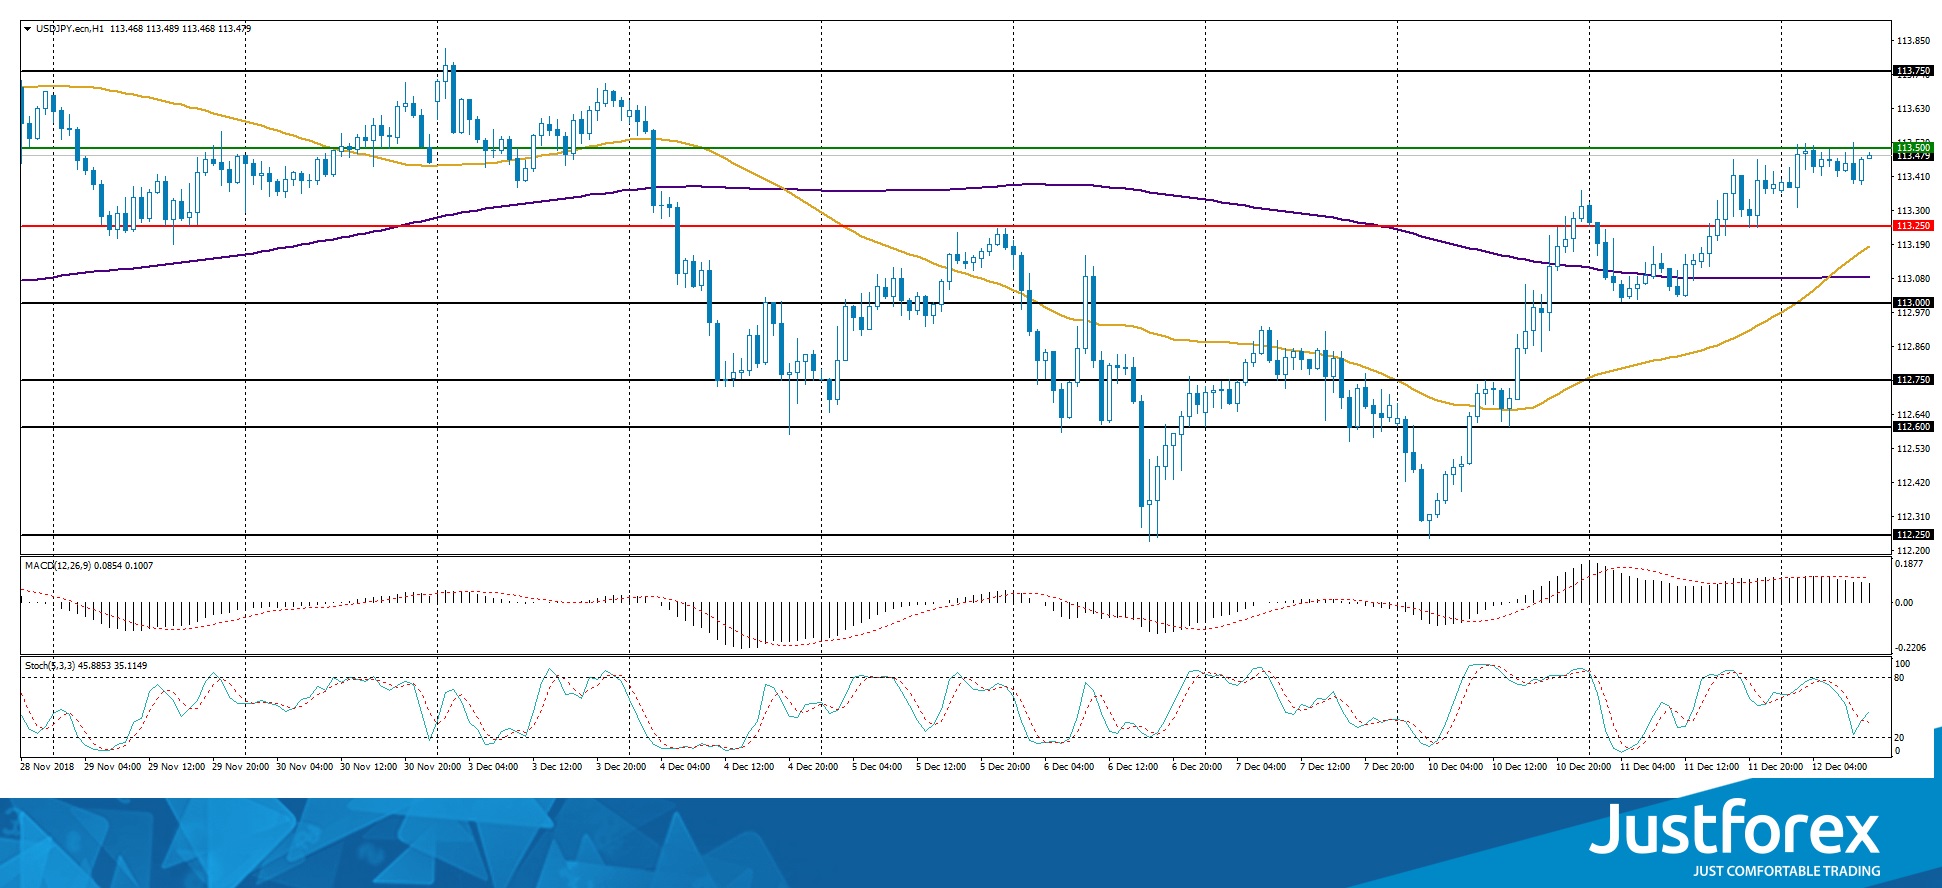
The price has crossed the 200 MA and 50 MA which points towards a bullish mood.
The MACD histogram is in the positive zone but below the signal line, which gives a weak signal to buy USD/JPY.
The Stochastic Oscillator is in the neutral zone, the %K line crosses the %D line. There are no signals at the moment.
Trading recommendations
Support levels: 113.250, 113.000, 112.750
Resistance levels: 113.500, 113.750
If the price fixes above the support level of 113.500,, it is necessary to consider buying USD/JPY. The movement is tending to 113.750-114.000.
An alternative could be the descend of the USD/JPY quotes to 113.000.
USD/CAD Analysis: Potential Upside Move Today
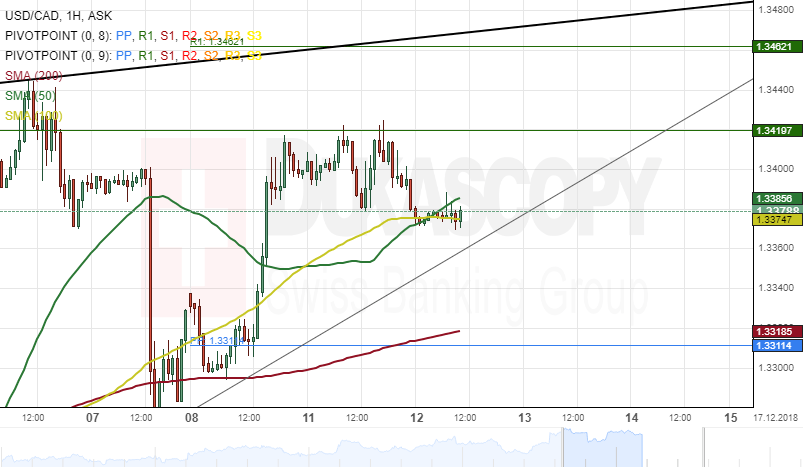
The US Dollar consolidated below the monthly pivot point at 1.3419 against the Canadian Dollar on Wednesday.
Technical indicators demonstrate that a strong bullish momentum is likely to come into play during the following trading session.
If this bullish sentiment occurs, the currency exchange rate will target the upper boundary of an ascending channel pattern at 1.3462.
However, it is expected that the USD/CAD currency pair edge lower towards a hidden base of 1.3318 today.
XAU/USD Analysis: Trades Near 38.20% Fibo
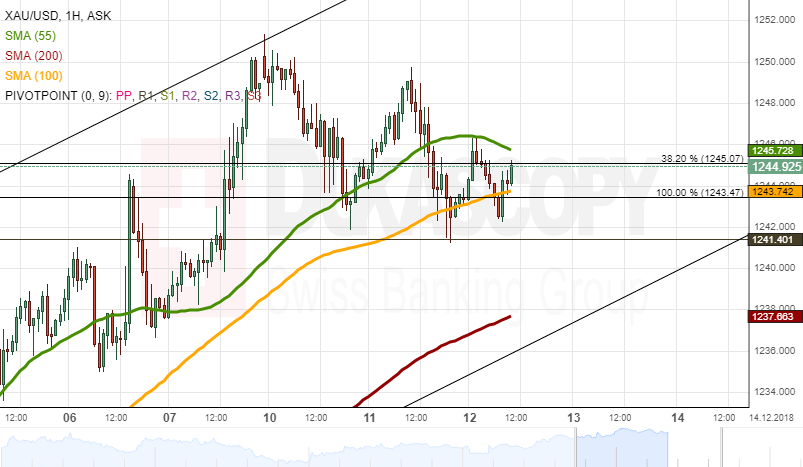
During Tuesday's trading session, the yellow metal was supported by the monthly R1 at 1,241.40 mark to break the resistance of the 38.20% Fibonacci retracement level to trade at the 1,246.36 mark. During Wednesday's morning hours, the yellow metal was supported by the 100-hour SMA to trade at the 1,244.56 mark.
In regards to the near-term future, most likely, the yellow metal will keep trading sideways to stay at the 1241.00 level due to the resistance levels of the 55-hour simple moving average and the 38.20% Fibo at the 1,245.07 mark.
On the other side, the gold could depreciate against the US Dollar during today's US CPI data release at 13:30 GMT to push the gold to trade at the 1,248.00 level.
NZD/USD Analysis: Breaches SMAs
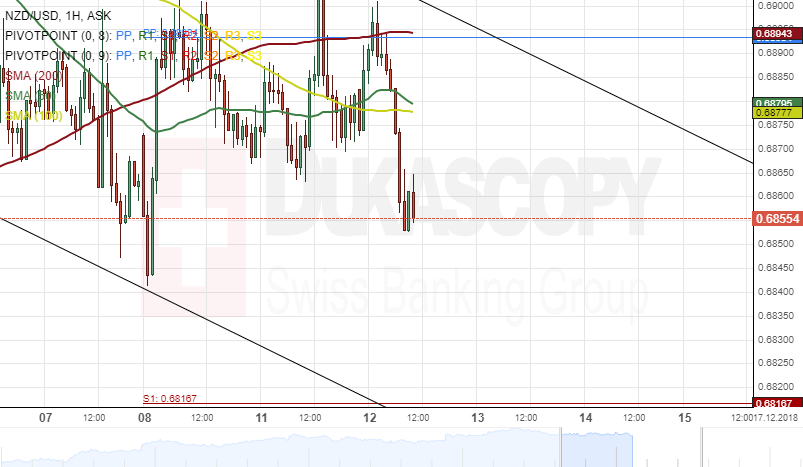
The New Zealand Dollar began today's session with a strong bearish momentum against the US Dollar. The currency pair was pressured south by the 200-hour simple moving average and the weekly pivot point at 0.6894.
As for the near future, it is likely that the NZD/USD currency exchange rate continues its decline. From a technical point of view, the potential downside target will be near a support level at 0.6840.
However, the pair could reverse from current price level and aim for a re-tests of a resistance cluster at 0.6894 today.
Positive Comment By Trump On Sino-American Trade Talks Drives Equities Higher
Positive comment by Trump on Sino-American trade talks drives equities higher
Hopes of a resolution to the US-China trade dispute appear brighter. US President Donald Trump's recent comment that talks with his Chinese counterparts are very productive, and the release of Huawei Technologies CFO Meng Wanzhou on bail, have given the markets some relief. Recent reports suggest that Chinese officials even agreed to cut tariffs on imported cars by 15% from 40% following discussions on Monday, an announcement that allowed US carmakers and EU auto stocks to rally. Germany's Daimler, BMW and Volkswagen flagship automotive companies bounced by +2.69%, +1.83% and +1.49% respectively.
Asian indices have been closing in positive territory and are green across the board. The Japanese Topix index gained +1.99%, bouncing back from an 18-month low, while Hong Kong's Hang Seng rose by +1.61% and China's mainland CSI 300 budged +0.34%. European equities are similar, with the Euro Stoxx +0.90, German DAX +0.70% and the French CAC40 +1.09%.
EUR/USD is currently trading at 1.1327, approaching 1.1340 short-term.
UK PM under threat as vote of no confidence is triggered
Following Prime Minister Theresa May's postponement of the final vote on her Brexit deal on Tuesday, rebel members of the Tory party have now decided to challenge her leadership. The rebels have the required 48 votes of party members to trigger a vote of no confidence by all 315 Conservative MP between 6 and 8 PM GMT today. A total of 158 votes would force Theresa May to step down and open the door to a party leadership contest.
Because Parliament would need weeks to find an agreed candidate, considerable time and effort would be spent on a doubtful cause since a new leader would face the same issues going forward. Under such circumstances, it seems improbable that the rebel Tories will be able to gain the support of 158 MPs.
Accordingly, despite a bounce back during this morning's trading session of the pound, we expect further volatility on the forex market. GBP/USD is currently trading at 1.2539, heading along 1.25 short-term.
USD/JPY Analysis: Keeps Surging To 113.80
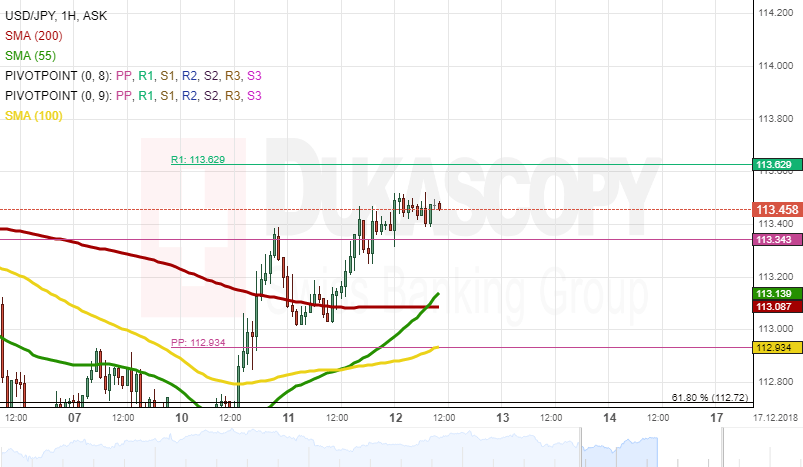
During Tuesday's trading session, the US Dollar was supported by the 200-hour SMA to help the rate to break the resistance level of the monthly pivot point at the 113.34 mark. During Wednesday's morning hours, the US Dollar was located between the monthly PP and the weekly R1 to trade at the 113.47 mark.
In regards to the near-term future, the US Dollar will keep surging upwards to break the resistance of the weekly R1 at 113.62 to push the rate to trade at 113.80 level during the day.
On the other side, the US Dollar could depreciate against the Japanese Yen during today's US CPI data release at 13:30 GMT to trade at the 113.20 level.
AUD/USD Analysis: Moving Within Range
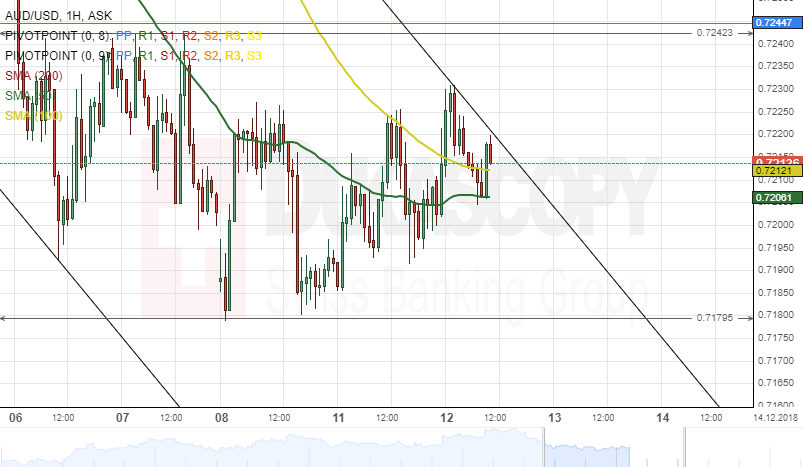
The Australian Dollar has been trading within 65 pips range against the US Dollar since the beginning of this week.
The currency pair is trading near the 50– and 100-hour SMAs during the middle of the European trading session on Wednesday. From a theoretical point of view, it is likely that the exchange rate aim north towards the 200-hour simple moving average at 0.7270 today.
However, it is important to note that the AUD/USD currency exchange rate needs to surpass the upper boundary of a descending channel pattern and the monthly pivot point at 0.7244 could hinder the pair from reaching its target.
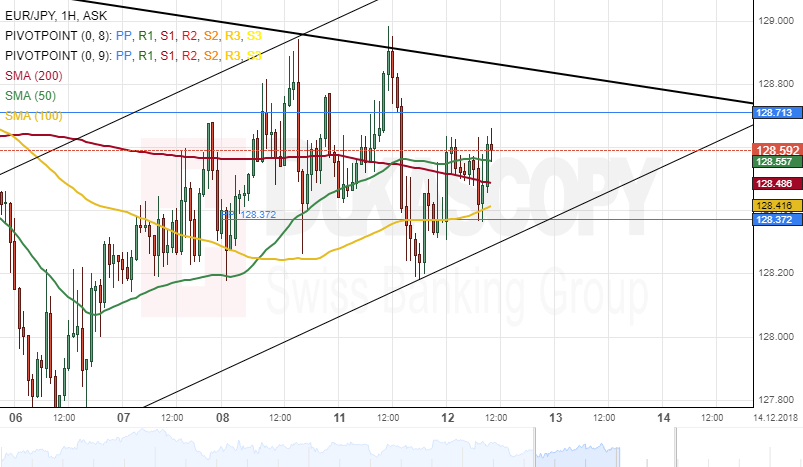
EUR/JPY Analysis: Possible Decline Today
The common European currency depreciated about 80 base points against the Japanese Yen on Tuesday. The currency pair broke the previously drawn ascending channel pattern during yesterday's trading session.
The exchange rate was stranded between SMAs during the first part of Wednesday's trading session.
Technical indicators suggest that the decline of the currency exchange rate is likely to continue within this session.
The potential downside target will be near December 7 swing low of 127.80 during the following trading hours.
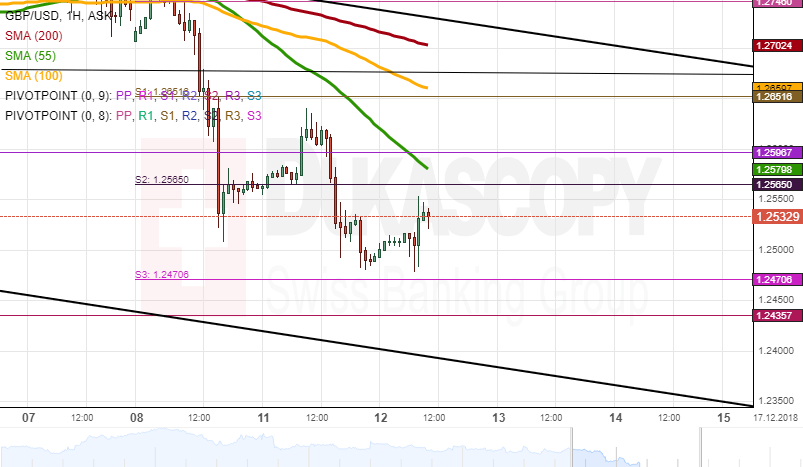
GBP/USD Analysis: Trades Sideways
During Tuesday's trading session, the currency exchange rate was resisted by the 55-hour SMA to pass through the support levels of the monthly S1 and the weekly S2 . During Wednesday's morning hours, the British Pound was located between the weekly S2 and the weekly S3 to trade at the 1.2537 mark.
In regards to the near-term future, most likely, the currency exchange rate will break the resistance of the 55-hour SMA to use the technical indicator as a support level to break through the monthly S2 at 1.2565 to trade near the 1.2555 level.
On the other side, the rate could be resisted by the 55-hour simple moving average to push the British pound to pass through the support level of the monthly S2 at 1.2435 to trade at the 1.2400 level during the trading session on Wednesday.