

Sample Category Title
SPX Bounce Expected To Fail
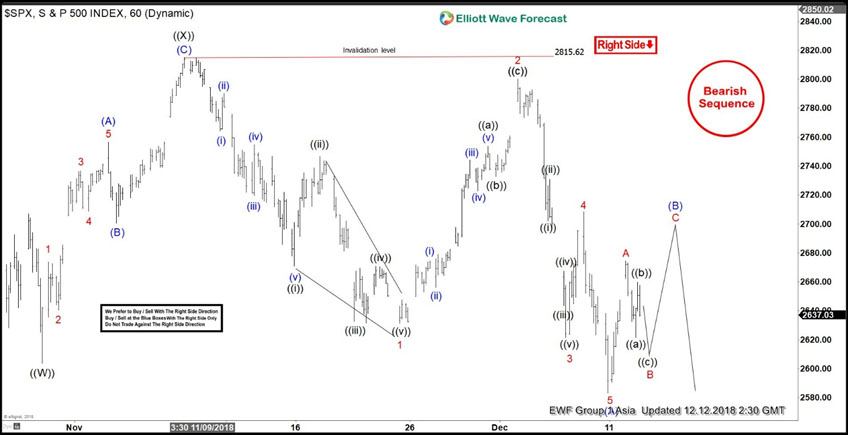
SPX has broken below Oct 30 low (2603.54), i.e. Primary wave ((W)), opening further downside with incomplete bearish sequence from Sept 21 high (2940.91). Near term Elliott Wave view suggests the decline to 2603.54 on Oct 30 low ended Primary wave ((W)). Bounce to 2815.6 ended Primary wave ((X)) as a zigzag Elliott Wave structure. Up from 2603.54, Intermediate wave (A) ended at 2756.55, Intermediate wave (B) pullback ended at 2700.44, and Intermediate wave (C) of ((X)) ended at 2815.62.
SPX has since declined from there and broken below Primary wave ((W)) at 2603.54, confirming the next leg lower has started. Primary wave ((Y)) is unfolding as a zigzag Elliott Wave structure where Intermediate wave (A) ended at 2583.23. Internal of Intermediate wave (A) unfolded as a diagonal where Minor wave 1 ended at 2631.09 and Minor wave 2 ended at 2800.18. Minor wave 3 ended at 2621.53, Minor wave 4 ended at 2708.54, and Minor wave 5 of (A) ended at 2583.23. Intermediate wave (B) is currently in progress to correct cycle from Nov 8 high (2815.62) in 3, 7, or 11 swing before the decline resumes. We expect Index to find sellers once Intermediate wave (B) bounce is complete in 3, 7, or 11 swing as far as pivot at 2815.62 high stays intact.
SPX 1 Hour Elliott Wave Chart
Trump To Intervene In Huawei Case If Necessary
Market movers today
Focus today will continue on the Brexit talks ahead of tomorrow's EU summit and the US-China trade negotiations after Trump tweeted yesterday that there will soon be 'big announcements' on this after 'very productive conversations'.
In terms of data releases, US CPI core inflation data is due out today. We estimate CPI core rose +0.2% m/m in November in line with the recent trend (2.2% y/y).
CPIF inflation data from Sweden is also due for release. We expect it to fall short of the Riksbank's forecast. We also have a budget vote to look forward to. See the Scandi section for more details.
Selected market news
US equities could not hold on to gains yesterday on the positive trade news. In Asia, however, equities are moving higher again on further trade optimism after the Huawei CFO arrested in Canada was granted bail on Tuesday and Trump said that he would intervene in the case if necessary to ensure a good trade deal , see Bloomberg article, 12 December. Yesterday, there were unconfirmed reports that China would cut US car tariffs from 40% to 15%. This would put US car tariffs in line with tariff rates for other countries, as the general car tariff rate in China was reduced from 25% to 15% on 1 July.
According to Reuters yesterday, some sources say the US considers issuing a travel warning to US citizens travelling to China as they fear a retaliation from the arrest of the Huawei CFO. Canada yesterday confirmed that one of its citizens was detained in China but that it saw no explicit connection to the Huawei case. See the South China Morning Post , 12 December, for more on this story.
In UK Prime Minister Theresa May could be facing her biggest crisis as a confidence vote could be coming, see Bloomberg , 11 December. The GBP fell yesterday in response to the high uncertainty over Brexit as it calls into question her ability to negotiate with EU leaders at the Summit on Thursday if she is to be toppled later internally. However, even if there is enough backing for a confidence vote, it is not clear that she would lose it. It would require a majority among the 315 Conservative members of parliament. EU leaders have been defiant about giving further concessions in talks with May in recent days.
On a more positive note, the German ZEW index for November surprised on the upside yesterday rising to -24.1 to -17.5. It has moved broadly sideways over the past four to five months, pointing to some stabilisation soon in the German slowdown.
Markets Buoyed By Trade War Progress
Markets buoyed by trade war optimism after Chinese tariff concession
European markets are being guided higher ahead of the open on Wednesday after China reportedly agreed to cut tariffs on US cars – from 40% to 15% - in a gesture aimed at de-escalating the trade war between the world’s two largest economies.
While the details of the cut are not yet known, the move reverses the tariff hike in July in response to those imposed by the US, which is hopefully a sign of more unwinding to come. It’s too early to be optimistic though as tensions remain high, with the arrest of Huawei CFO Meng Wanzhou further complicating the relationship, although Trump has suggested he could intervene, which makes the timing of the arrest all the more suspicious.
Trump tantrum puts government shutdown firmly on the table
Domestic issues could be more challenging for the President, after a discussion in front of the cameras with Nancy Pelosi and Chuck Schumer over border security – or more specifically the wall - turned sour. Trump appeared to be goaded into claiming that he would be proud to shut down the government, what Pelosi termed a Trump shutdown for the holidays. Fortunately, markets have become less sensitive to the prospect of a government shutdown in recent years, although in their current state it’s hard to say how they’ll respond this time around.
Brexit soap opera rumbles on as May faces leadership challenge
I’m sure Theresa May would happily trade places with Trump right now, with the UK Prime Minister facing the prospect of a no confidence vote on her return from Brussels. Reports suggest the delayed vote was the last straw and 48 letters have apparently been received – although we have heard this repeatedly before – meaning she now faces a vote that could bring her chaotic tenure to an abrupt end.
Even if the letters have been collected though, that doesn’t mean she’ll lose the vote and if she doesn’t, this could actually empower her as the threat of a challenge that’s hung over her head for so long would instantly go away for another 12 months. Assuming of course that she doesn’t survive by a fine margin at which point there could be calls for her to step down, something I’m not entirely sure she’d do.
Still, the soap opera that is Brexit goes on and it seems with every passing day the chaos is being ramped up a notch which is starting to taking its toll on the currency. The pound dipped below 1.25 against the dollar on Tuesday for the first time since April last year and in the near term at least – unless May arrives home jubilantly waving a concession on the backstop – it’s tough to build a bullish case or the currency.
GBP/JPY Daily Outlook
Daily Pivots: (S1) 141.10; (P) 142.01; (R1) 142.50; More...
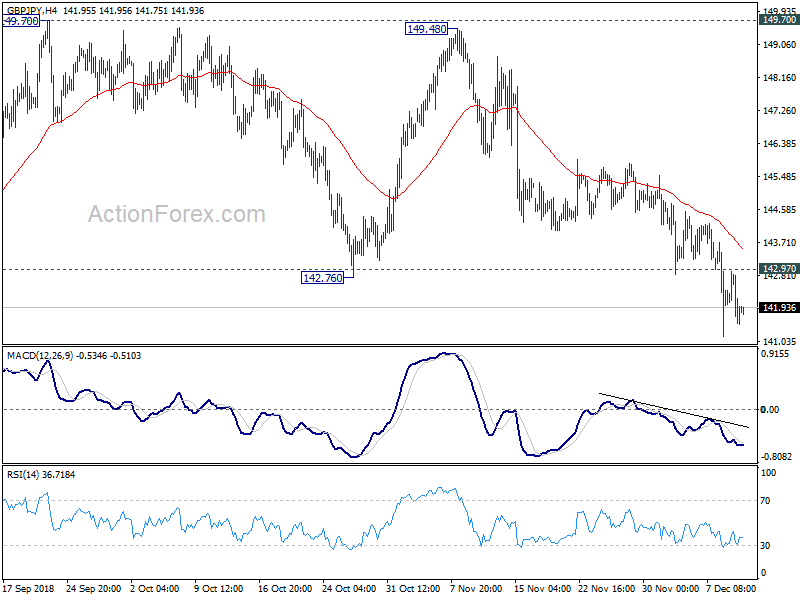
With 142.97 minor resistance intact, intraday bias in GBP/JPY stays on the downside for further fall. Current decline should target 139.29/47 key support zone. On the upside, above 142.97 minor resistance will turn bias neutral and bring consolidation first, before staging another decline.
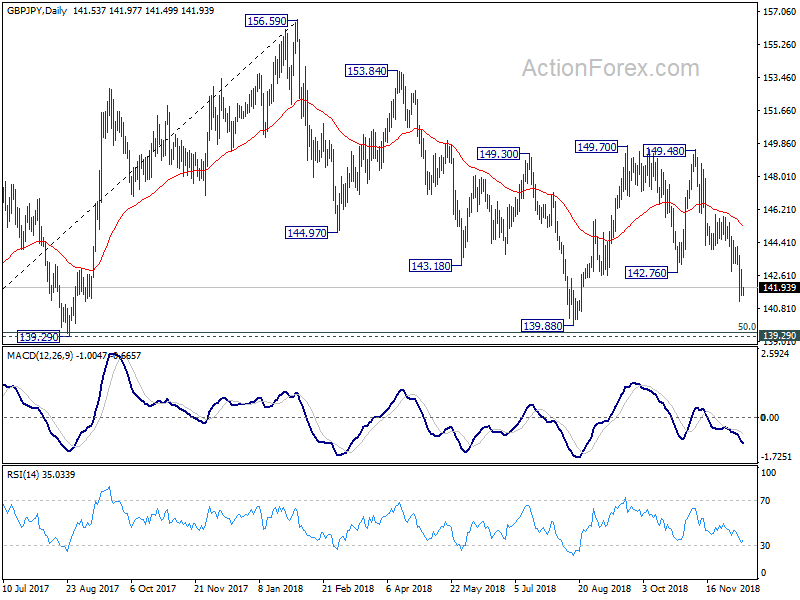
In the bigger picture, as long as 139.29 cluster support (50% retracement of 122.36 to 156.59 at 139.47) holds, up trend from 122.36 (2016 low) could still extend beyond 156.69 high. However, decisive break of 139.29/47 will suggest that such up trend is completed and turn outlook bearish. In that case, next target is 61.8% retracement at 135.43.
EUR/JPY Daily Outlook
Daily Pivots: (S1) 128.01; (P) 128.50; (R1) 128.83; More....
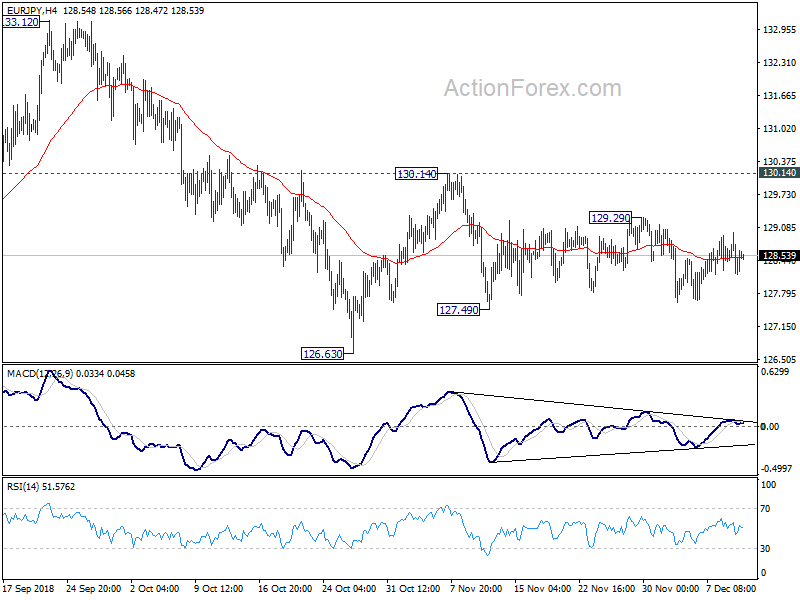
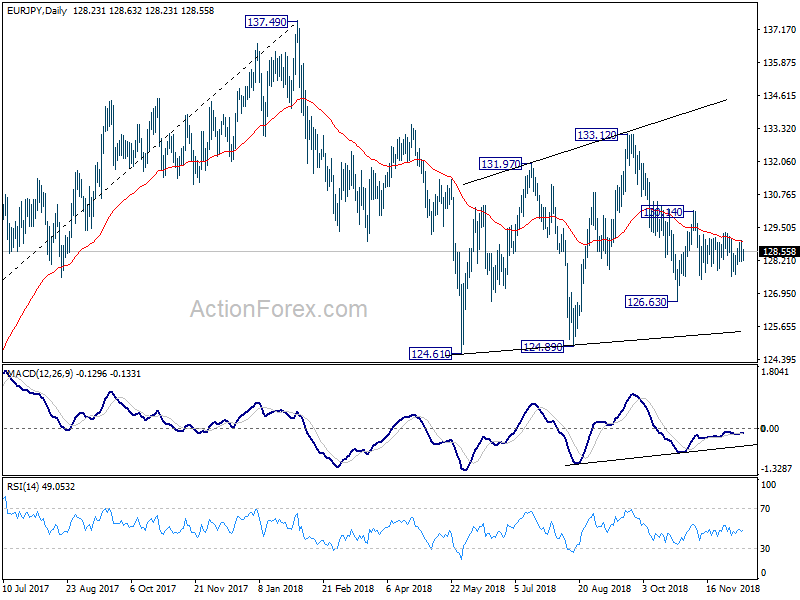
EUR/JPY is staying in range of 127.49/129.29 and intraday bias remains neutral for the moment. On the downside, break of 127.49 will target 126.63 support first. Break there will then resume the whole decline from 133.12 to 124.08/89 support zone. And, even in case of recovery, outlook will stay bearish as long as 130.14 resistance holds.
In the bigger picture, as long as 124.08 key resistance turn supported holds, larger up trend from 109.03 (2016 low) could still resume. Firm break of 137.49 structural resistance will target 141.04/149.76 resistance zone next. However, decisive break of 124.08 will argue that such rise from 109.03 has completed and turn outlook bearish. In that case, deeper fall would be seen to 61.8% retracement of 109.03 to 137.49 at 119.90.
EUR/GBP Daily Outlook
Daily Pivots: (S1) 0.9023; (P) 0.9047; (R1) 0.9089; More...
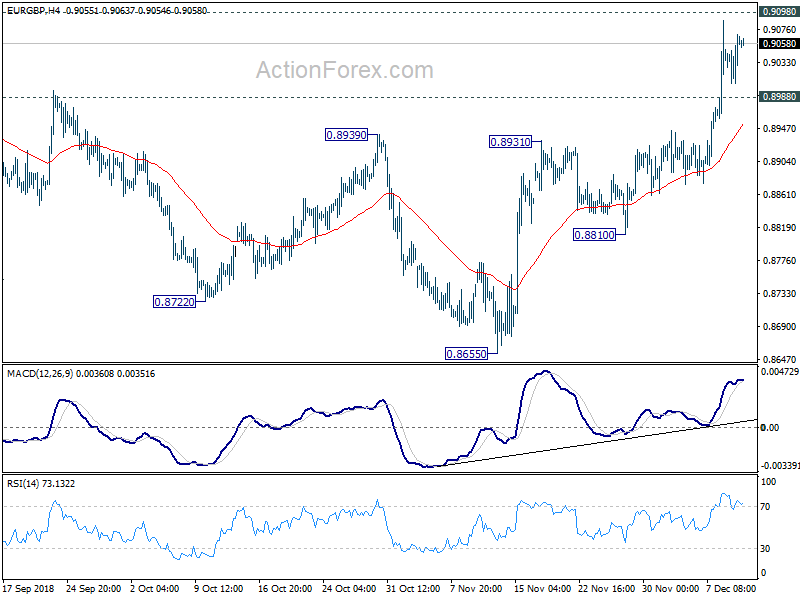
EUR/GBP lost some upside momentum but with 0.8988 minor support intact, intraday bias stays on the upside for 0.9098 resistance. Decisive break there will extend the rise from 0.8655 to 0.9304 key resistance next. On the downside, below 0.8988 minor support will turn intraday bias neutral and bring some consolidations first, before staying another rally.
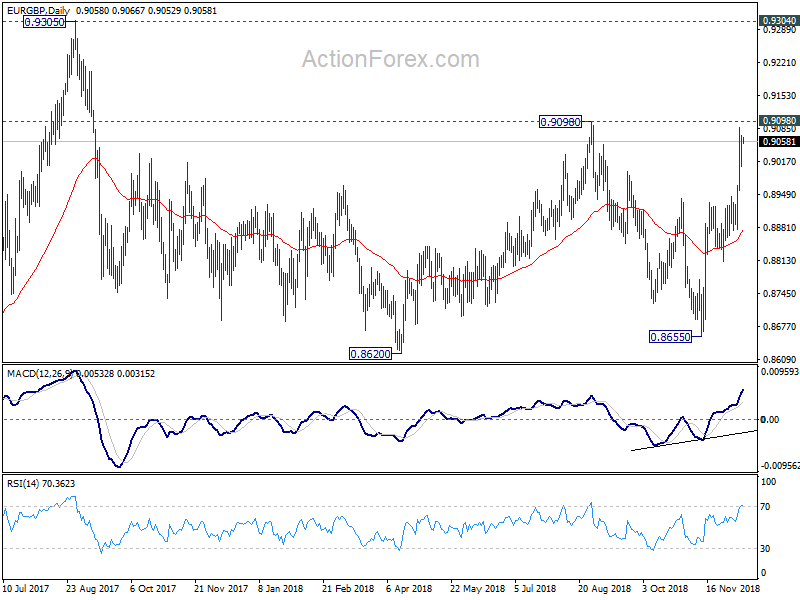
In the bigger picture, EUR/GBP is seen as staying in long term range pattern started at 0.9304 (2016 high). Sustained break of 0.8939 resistance will confirm that it's in a medium term rising leg for 0.9098 and above. And for now, in case of another fall, downside will likely be contained by 0.8620/55 support zone to bring rebound.
EUR/AUD Daily Outlook
Daily Pivots: (S1) 1.5667; (P) 1.5745; (R1) 1.5790; More....
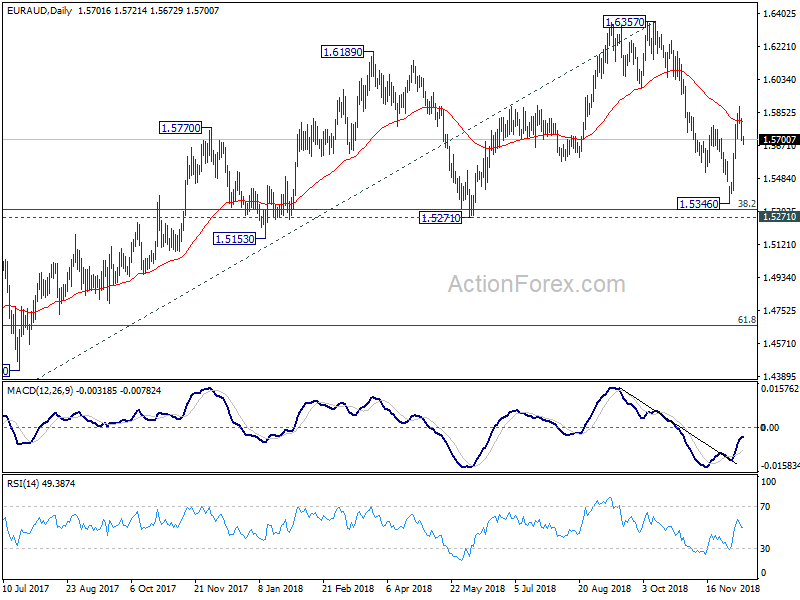
Intraday bias in EUR/AUD remains neutral as pull back from 1.5887 is in progress. Deeper decline cannot be ruled out. But downside should be contained by 1.5596 support to bring rise resumption. On the upside, above 1.5887 will resume the rise from 1.5346 to 1.5984 resistance first. Decisive break there will pave the way to retest 1.6357 high. Nevertheless, break of 1.5596 will indicate completion of the rebound and turn bias back to the downside for retesting 1.5346 low.
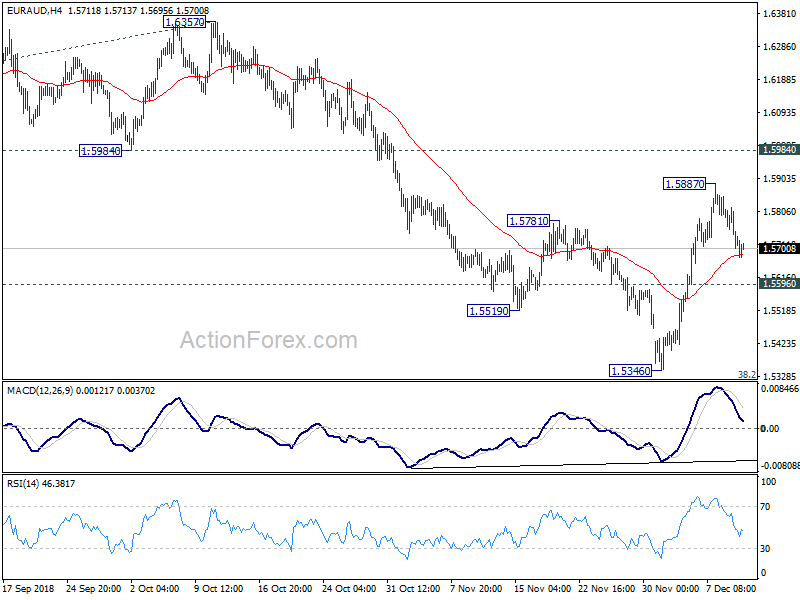
In the bigger picture, no change in the view that 1.6357 is a medium term top. But the strong rebound ahead of 1.5271 cluster support (38.2% retracement of 1.3624 to 1.6357 at 1.5313) suggests price actions from 1.6357 are developing into sideway consolidation, rather than a deep correction. The range of 1.5271/6357 is likely set for the consolidation. And we don't expect a break of the range any time soon. But decisive break of 1.6357 will resume the larger up trend from 1.3624 (2017 low) to 1.6587 (2015 high).
EUR/CHF Daily Outlook
Daily Pivots: (S1) 1.1223; (P) 1.1242; (R1) 1.1258; More...
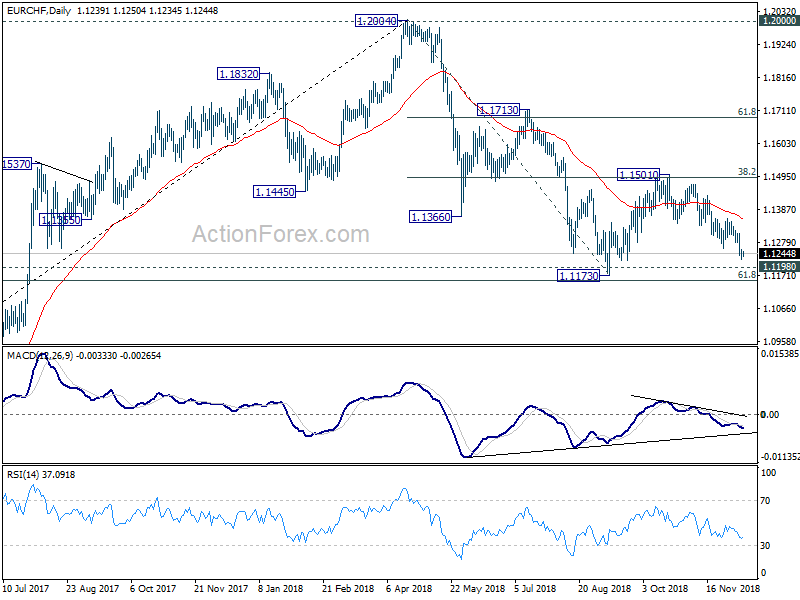
Further decline is expected in EUR/CHF with 1.1277 minor resistance intact. Current fall from 1.1501 is in progress for 1.1173 low next. For now, we'd expect strong support inside 1.1154/98 key support zone to bring reversal. On the upside, above 1.1277 minor resistance will turn intraday bias bias back to the upside for 1.1356 resistance first. Break there will indicate near term reversal.
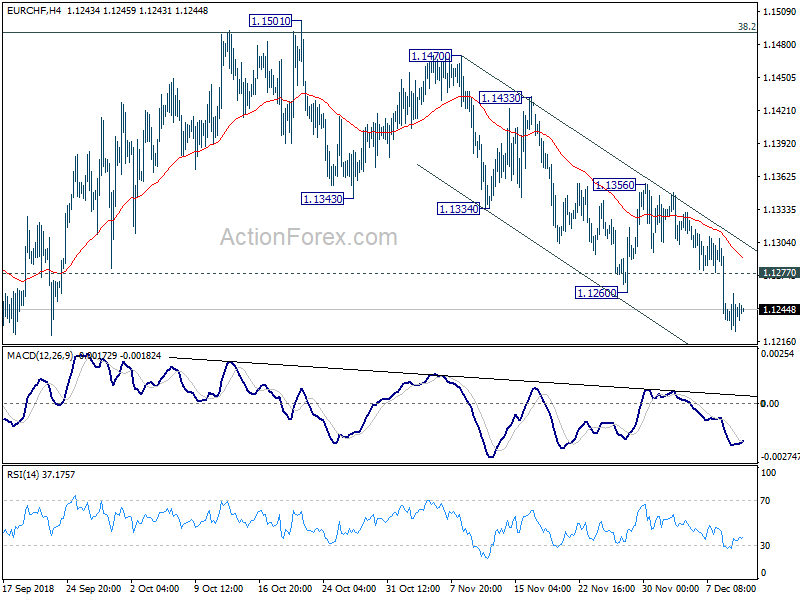
In the bigger picture, price actions from 1.2004 medium term top is seen as a correction only. Downside should be contained by support zone of 1.1198 (2016 high) and 61.8% retracement of 1.0629 to 1.2004 at 1.1154 to complete it and bring rebound. A break of 1.2 key resistance is still expected in the medium term long term. However, sustained break of the mentioned support zone will mark reversal of the long term trend. In that case, 1.0629 key support will be back into focus.
Forex Technical Analysis: EUR/USD, USD/JPY, GBP/USD
EUR/USD
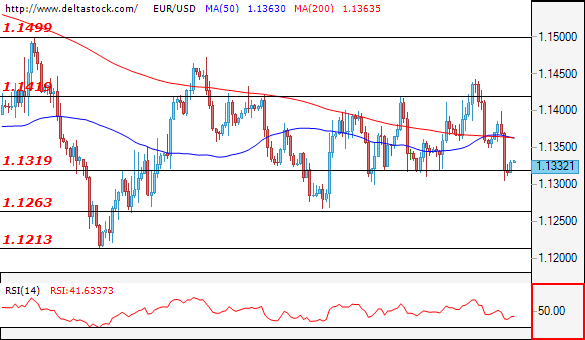
Current level - 1.1332
After the retracement to 1.3999 and the following sharp fall the expectations remain negative. It's possible to see a rise up to the 1.1350 zone and afterwards a renewal of the downtrend. The first target is 1.1260 followed by 1.1210 in extension.
| Resistance | Support | ||
| intraday | intraweek | intraday | intraweek |
| 1.1350 | 1.1450 | 1.1300 | 1.1210 |
| 1.1400 | 1.1500 | 1.1260 | 1.0850 |
USD/JPY
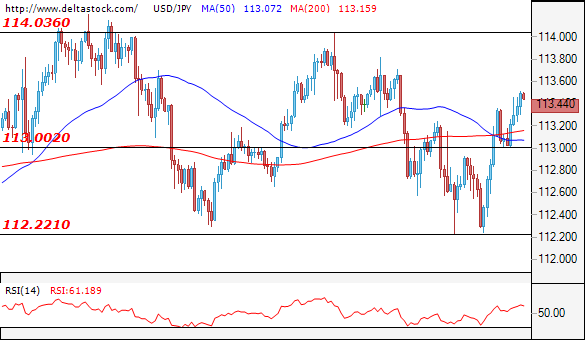
Current level - 113.44
We can say the breakthrough of 113.00 was successful. The first resistance for the move upwards is the 113.80 zone. Historically strong resistance is 114.50 and for rallies further we'll have to see a successfully break of that level otherwise a failed test can bring the pair to 112.00.
| Resistance | Support | ||
| intraday | intraweek | intraday | intraweek |
| 113.65 | 114.50 | 113.00 | 112.20 |
| 114.00 | 116.20 | 112.50 | 111.60 |
GBP/USD
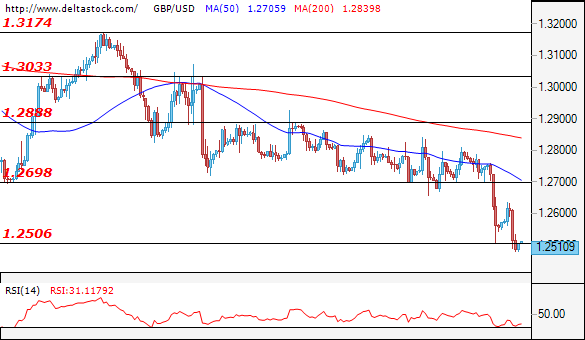
Current level - 1.2510
The powerful break of 1.2690 suggests continuation of the downtrend after the consolidation. To find hope for rising the sterling should go back above 1.2690. Political insecurity may give momentum to the downfall and we could soon observe levels around 1.2200.
| Resistance | Support | ||
| intraday | intraweek | intraday | intraweek |
| 1.2600 | 1.2880 | 1.2500 | 1.2360 |
| 1.2690 | 1.3030 | 1.2460 | 1.2140 |
EUR/USD And USD/CHF Could Climb Higher
EUR/USD retested the 1.1300-1.1310 support area and later started a decent recovery. USD/CHF climbed higher recently and dips remain supported near 0.9900 in the short term.
Important Takeaways for EUR/USD and USD/CHF
- The Euro declined heavily recently and tested the key 1.1300 support area against the US Dollar.
- There was a break below a key bullish trend line with support at 1.1340 on the hourly chart of EUR/USD.
- USD/CHF recovered recently and broke the 0.9890 and 0.9900 resistance levels.
- The pair is currently struggling to break a bearish trend line with resistance at 0.9930 on the hourly chart.
EUR/USD Technical Analysis
The Euro started a major downside move from the 1.1450 resistance area against the US Dollar. The EUR/USD pair declined and traded below the 1.1400, 1.1380 and 1.1350 support levels.
The pair even broke the 1.1320 support level plus the 50 hourly simple moving average, and traded as low as 1.1306 on FXOpen. Later, the pair formed a decent support near the 1.1300-1.1310 zone and finally started a short term upside correction.
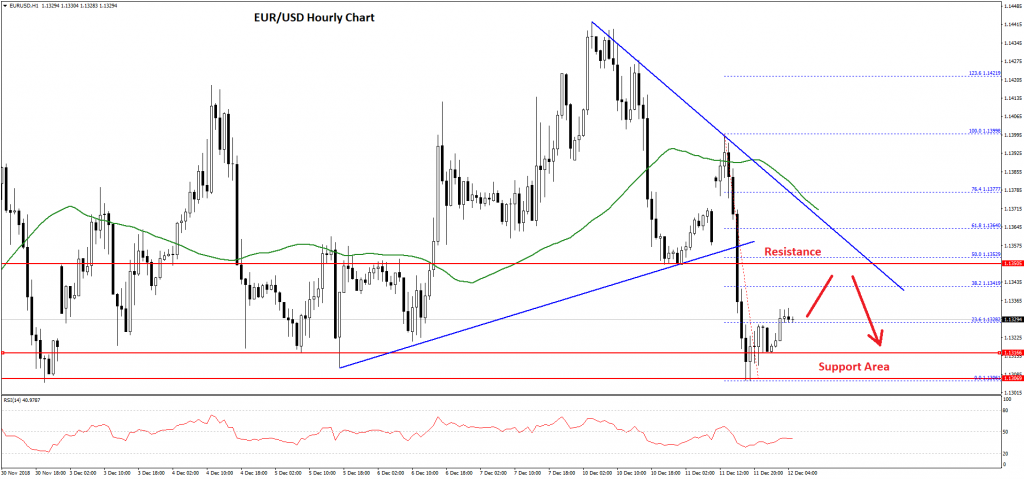
It moved above the 1.1320 level and the 23.6% Fib retracement level of the last decline from the 1.1400 swing high to 1.1306 low. However, there are many resistances aligned on the upside near the 1.1350 and 1.1355 levels.
More importantly, there is a crucial bearish trend line formed with resistance at 1.1358 on the hourly chart. The trend line is close to the 50% Fib retracement level of the last decline from the 1.1400 swing high to 1.1306 low.
In the short term, the pair is likely to continue to trade higher towards the 1.1350 and 1.1355 resistance levels. However, it won’t be easy for buyers to clear the 1.1355-60 zone, above which the pair might surge towards 1.1400.
On the downside, the 1.1320 level is an initial support, followed by the key 1.1300-10 support zone.
USD/CHF Technical Analysis
This past week, there was a slow and steady decline in the US Dollar from the 1.0000 resistance area against the Swiss franc. The USD/CHF pair declined and traded below the 0.9950 and 0.9900 support levels.
There was also a break below the 0.9880 support level and the 50 hourly simple moving average. A new weekly low was formed recently at 0.9862 and later the pair started an upside correction.
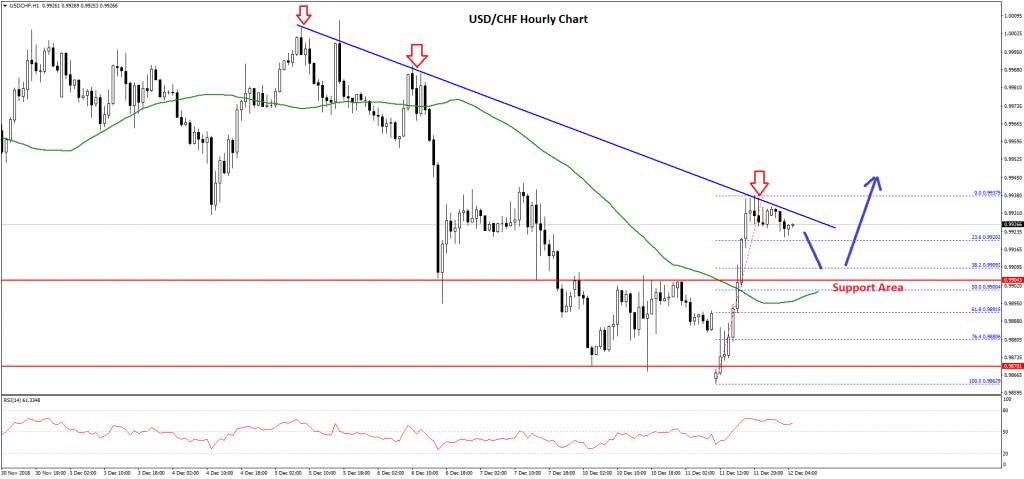
It jumped above the 0.9900 resistance and settled above the 50 hourly simple moving average. The current price action is positive, but the pair is facing a major resistance near 0.9930-35. Moreover, there is a key bearish trend line in place with resistance at 0.9930 on the hourly chart.
Therefore, a proper break above the trend line and a close above 0.9940 could open the doors for more gains towards 0.9980 or even 1.0000. On the downside, an initial support is near the 0.9920 level and the 23.6% Fib retracement level of the recent wave from the 0.9862 low to 0.9937 high.
However, the key support for buyers is near the 0.9900 level and the 5% Fib retracement level of the recent wave from the 0.9862 low to 0.9937 high, with the 50 hourly SMA.
Overall, it seems like dips remain supported in both EUR/USD and USD/CHF in the near term.