Sample Category Title
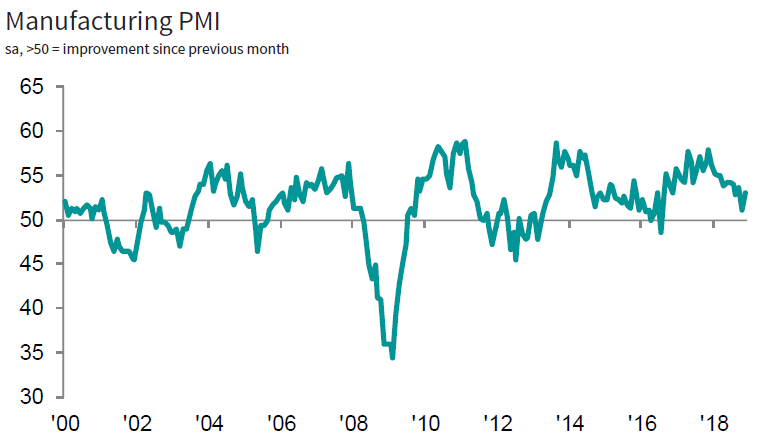
UK PMI manufacturing rose to 53.1, lacklustre picture of manufacturing sector
UK PMI manufacturing rose to 53.1 in November, up from 51.1 and beat expectation of 52.0. Markit noted that trends in output and new orders strengthen slightly. But new export orders decrease for the second month running.
Rob Dobson, Director at IHS Markit, which compiles the survey:
"The November PMI provided a lacklustre picture of the UK manufacturing sector, as ongoing global trade tensions and Brexit uncertainty weighed on current business conditions and dampened the outlook for the year ahead.
"Although November saw the headline PMI regain some lost ground and trends in output, new orders and employment picked up slightly from a weak October, growth is still among the weakest seen over the past two-and-a-half years. Based on its relationship against official ONS data, the survey indicators suggest manufacturing output is on course to make no contribution to GDP growth in the final quarter, with a clear risk of output contracting unless December proves a stronger month.
"While demand from the domestic market was a positive spur, in some cases as clients built up stocks in response to Brexit and other supply-chain uncertainties, manufacturers also reported a further decrease in new export business as slower global economic growth and Brexit worries took a bite out of foreign demand. Brexit worries also increasingly dominated the outlook for the sector. Although still forecasting growth for the year ahead, manufacturers' confidence fell to its lowest ebb since August 2016."
How to Trade on Forex Without Indicators And Still Profit
If you want to trade on Forex, you need to keep up with it — read the news, analyses, various reports, market indicators and even the actions of other traders. It's not that easy and puts people under a heavy emotional strain.
Luckily, there is another way. Price Action allows traders to predict the market using only the market itself, without any external data sources.
The Basics of Price Action
Price Action explains the events on the market via the chart patterns. These patterns are formed by the candles, which represent the values of currency pairs during different points in time. Using those patterns, the Price Action analysts can predict further events on the market and adjust their trading strategy.
Japanese Candlesticks
Japanese candlesticks are relatively new to the Western markets — they replaced the more traditional charts only during the 1990s. Unlike the bar or line charts, Japanese candlesticks report not only the opening and closing prices but also the dynamic of the trends during the timeframe.
Here's how the candlesticks represent the data:
- The body shows the price of an asset at the beginning and the end of the timeframe.
- The shadow (a thin line beyond the body) represents the maximum and minimum price during the candlestick existence.
- The color represents the direction of the price movement within the timeframe. Green candles move up, red candles move down.
Delayed Orders
There are two ways to create a Forex order:
- Market orders are executed at the current market price.
- Delayed orders are executed at the previously determined price and are ignored until the market price is the same.
When it comes to Price Action trading, using delayed orders is pretty much the only way. They help to minimize the risk and often serve as insurance against the bad judgment.
There are several types of delayed orders:
- BuyStop. A delayed purchase order for a price higher than the current one.
- BuyLimit. A delayed purchase order for a price lower than the current one.
- SellStop. A delayed sale order for a price lower than the current one.
- SellLimit. A delayed sale order for a price higher than the current one.
Delayed orders also can have StopLoss and TakeProfit modifiers.
- StopLoss. Allows setting the limit on the order loss. If the loss exceeds the limit, the order will automatically close.
- TakeProfit. Allows setting the limit on the order profits. Once the profit reaches the limit, the order will automatically close.
The Support and Resistance Levels
When a trend hits a level, it either breaks through it or changes direction. It happens because the traders put StopLoss and TakeProfit orders on those levels. So, in a way, it is the traders who determine the levels.
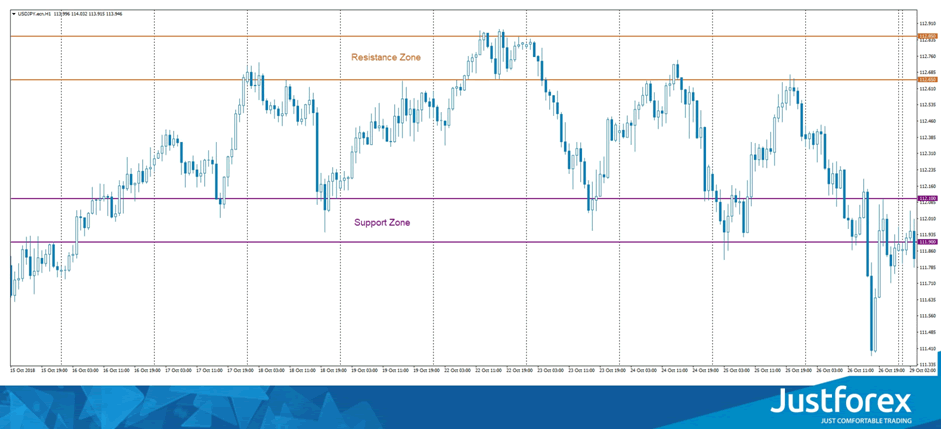
The support level represents the minimal possible price of an asset. This is where most people prefer to buy assets, which causes their value to grow and creates an ascending trend. Once this trend reaches the maximum possible price, the traders will sell the asset, which will cause the price to start descending. The point where it happens is called the resistance level.
Sometimes trends break before they hit a level — for example, due to external news or a sudden high-level player intervention. Generally, we say that a trend breaks when two consecutive candlesticks close outside of it. After a breakout, a resistance level becomes a support level and vice versa.
Sometimes there is more than one support and resistance level. For example, yesterday the price couldn't break through 1.12000, but two days ago it reached 1.12500. In that case, consider both levels when you set the orders up. Just don't put too many layers on the chart. Only layers that have formed during the last 200 candles carry any significant weight.
Different levels also have different strengths. When you are trying to see which level is stronger, consider the following:
- Is it a round number?
- Is it a returning level that was important in the past?
- Is it a local maximum?
- Is it obvious on the chart?
The more "yes" answers you get, the stronger your level is. Stronger levels are harder to break, so consider this when devising your strategy.
The Trends and How to Define Them
A trend determines the overall mood of the market. There are two types of trends:
- An ascending trend is a series of increasing minimums and maximums.
- A descending trend is a series of decreasing minimums and maximums.
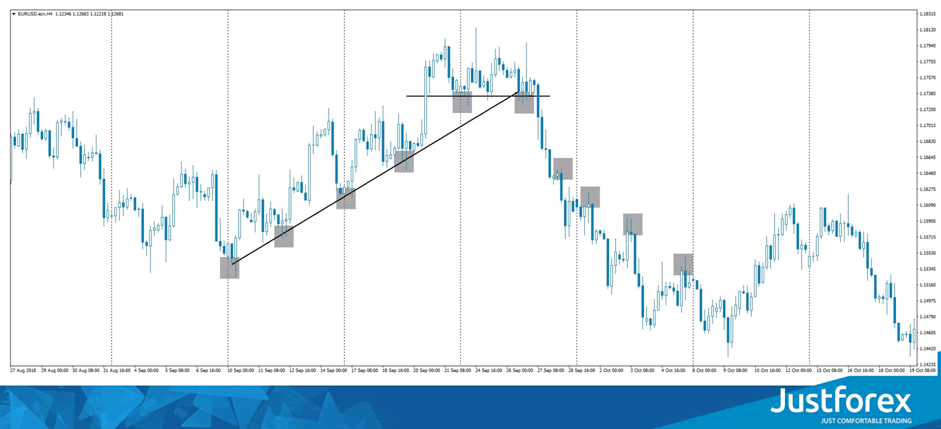
When a trend breaks through the previous minimums or maximums, it can "break out" and change into an opposite trend.
A correction is another type of movement. It is a small opposite movement that appears once the trend is over. There is also consolidation — a flat movement of the price before the trend established itself.
Trend Lines
Traditionally, traders determine the trends with moving averages — it's easier and allows to assess the situation on the market faster. However, when it comes to Price Action, moving averages are not particularly useful. Instead, you need to build the trend lines.
Imagine an ascending trend — one where both the support and resistance are growing at a steady rate. Draw a line through the minimum values of such chart. Then through the maximum.
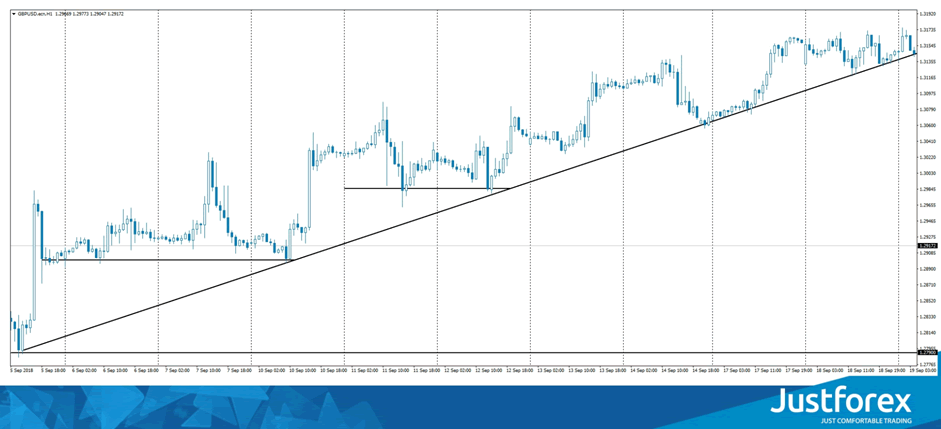
These lines are called the trend lines and by knowing how to read them, you can predict the future situation on the market.
Chart Patterns
There are two chart patterns you should know: a triangle and a flag. There are more but realistically you will never need them.
Triangle
A triangle is formed when the support and the resistance line cross over. They can form either an ascending triangle (with a static resistance and ascending support), a descending triangle (with a static support and descending resistance), a symmetrical triangle (with both support and resistance converging at one point) or a ranging triangle (with both support and resistance moving away from each other).
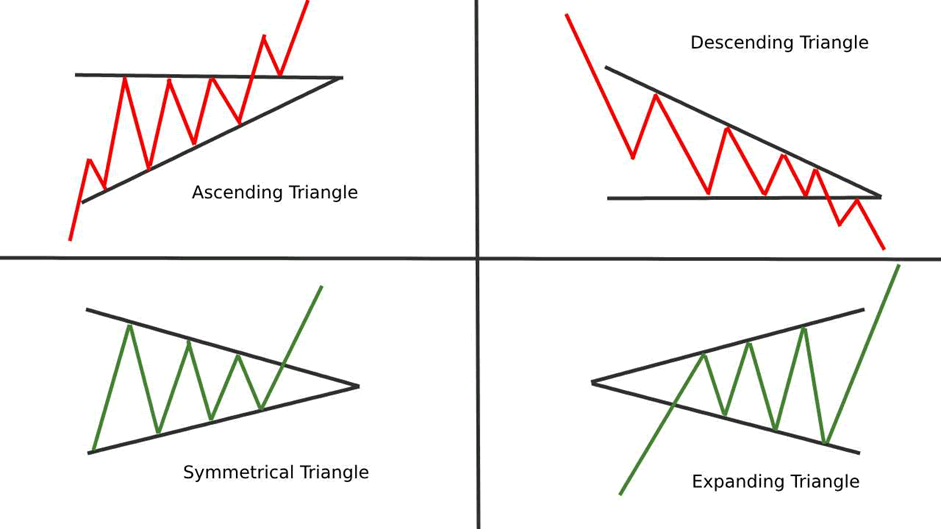
All triangles signal an upcoming breakout. The direction of this breakout is the direction of the triangle itself or, in the case of a symmetrical triangle, a direction of the trend before the triangle has been formed. The only exception is the ranging triangle, which is a signal to exit the market immediately since the trends within it become volatile and unpredictable.
Flag
A flag forms when the support and the resistance lines are parallel to each other. A flag can be ascending, rectangular or descending.
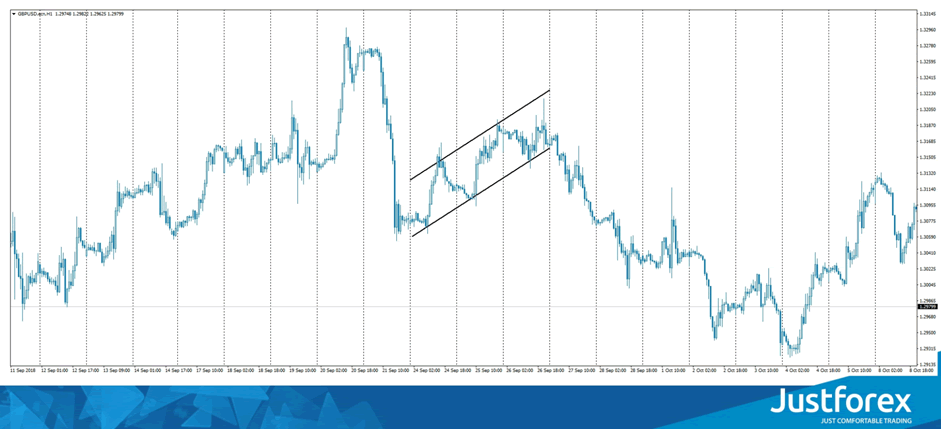
A flag is a correction pattern which means that it is bound to break out in the opposite direction. A lot of newcomers to Forex lose their money because they do not know about this, so be careful.
A rectangular flag is a signal to exit the market immediately. Just like a ranging triangle, it creates volatile and unpredictable trends.
This article was brought to you by JustForex. Our traders enjoy exclusive daily analytics, high leverage and spreads from 0 pips. If you liked what you read and want to start trading with a reliable broker with 100% bonus — check out JustForex.com.
The Candlestick Patterns
Chart patterns are great for long-term predictions, however, they often lack precision for the real-time trading. Luckily, there are also candlestick patterns — a more relevant and precise tool in a Price Action trader arsenal.
Pin bar
A pin bar is a candlestick that has no body (or an only a tiny one) and a long shadow on one side. It often precedes a change of trend.
There needs to be at least some movement before a pin bar. If the market is mostly flat, you can safely ignore any pin bar you find.
The best entry point for pin bar is in the direction of the new trend, right behind the shorter shadow. The best StopLoss point is behind the longer shadow. TakeProfit is best set up at the StopLoss value multiplied by 3.
Internal bar
An internal bar (inside bar) is a large candlestick without any shadows, followed by a smaller opposite candlestick. Ideally, the first candlestick should be at least twice the size of the second one.
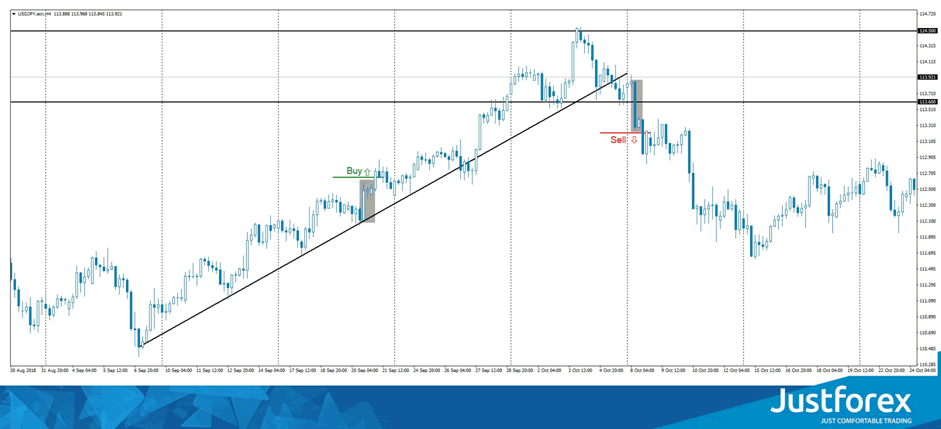
To enter the market at an internal bar, create a delayed order in the direction of the first candlestick. StopLoss should be placed right behind the shorter candlestick. Place TakeProfit on the opposite level.
Outside bar
An outside bar forms when a smaller candle is followed by a larger opposite one.
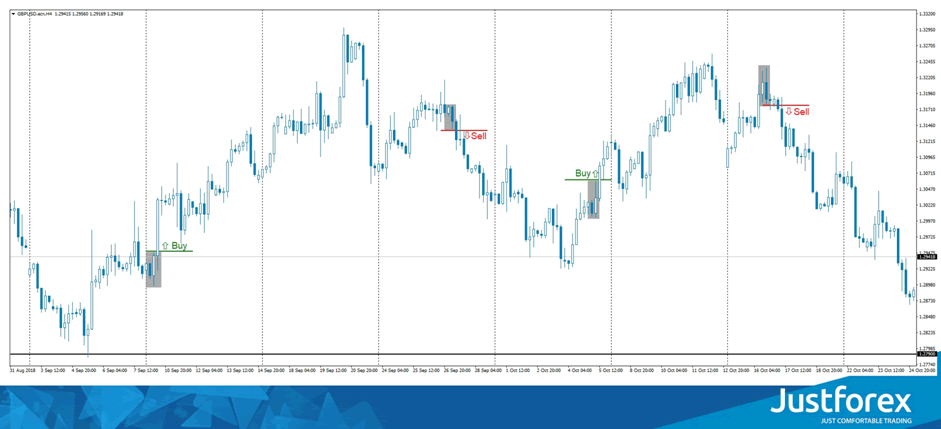
To enter a market at an outside bar, set up a delayed order in the direction of a shorter candlestick. Close by StopLoss if the price gets behind the longer candlestick. TakeProfit when the price reaches the opposite level.
Fake breakout
A fake breakout happens when a candlestick breaks the level with its shadow but closes in a different direction.
Do not enter the market during a fake breakout. Wait until the new trend establishes itself. Close by StopLoss if the price gets above the level of the breakout, close by TakeProfit once it reaches the opposite level.
Double High/Double Low
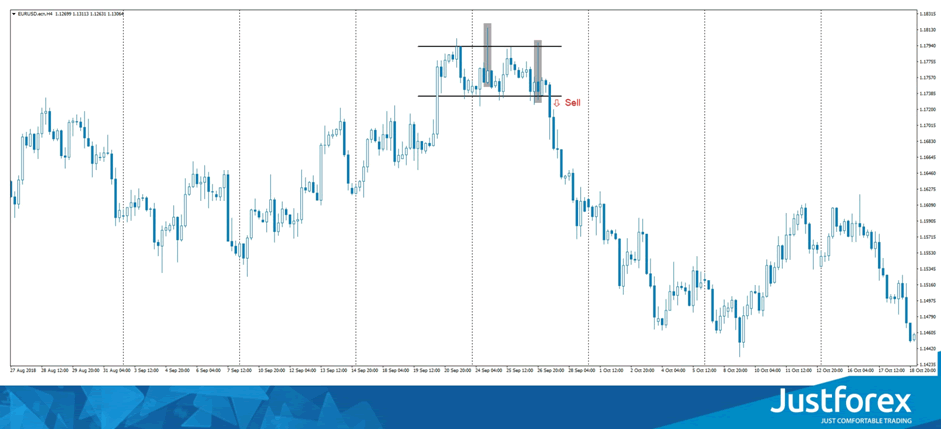
DHDL forms when two candlesticks cannot break through some arbitrary level. This patter is viable only on longer timeframes like D1 or H4.

To enter the market during DHDL, place an order limit right before the level, to trigger once the price bounces. Close by StopLoss if the price finally breaks through the level. Close by TakeProfit at the opposite level.
Conclusion
Price Action is a great way to trade on unfamiliar markets. It is also not exclusive — nothing stops you from supplementing your Price Action strategy with the real-world data. During crises, this might be the best way to so, since Price Action is not infallible and depends on the adequacy of the other traders on the market. Which is not always a given.
EUR/USD Outlook: Relief Rally On Eased Trade Tensions Faces Strong Obstacles At 1.1400 Zone
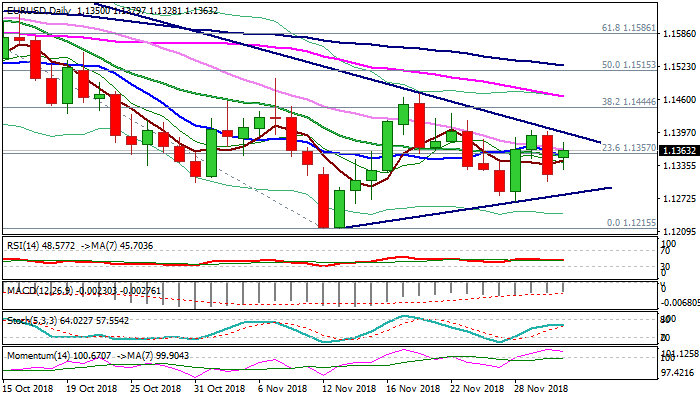
The Euro hit session high at 1.1380 at the beginning of European trading on Monday, following gap-higher opening and subsequent advance in Asian session.
The single currency benefits from renewed risk appetite after agreement of US President Trump and Chinese President Xi to put on hold new tariffs for 90 days, which sideline trade war risk, prompted investors into riskier assets.
Fresh rally left higher low at 1.1305 (posted on Friday after 0.65% fall for the day) and retraced so far 76.4% of Friday’s 1.1400/1.1305 fall and neutralized immediate downside risk, signaled by Friday’s long red daily candle.
Fading bullish momentum on daily chart warns that fresh bulls may have difficulties at strong barriers at 1.1398/1.1400 (bear-trendline off 1.1815, 24 Sep high / Thu/Fri double top).
Sustained break here is needed to generate stronger bullish signal on break above near-term triangle and expose next pivotal barriers at 1.1444 (cracked Fibo 38.2% of 1.1815/1.1215) and 1.1466 (falling 55SMA).
Failure at 1.1400 zone would keep the downside vulnerable, with increased risk towards key 1.1215 support (12/13 Nov lows) expected on firm break below Friday’s low at 1.1305.
Res: 1.1380, 1.1400, 1.1433, 1.1444
Sup: 1.1328, 1.1305, 1.1267, 1.1215
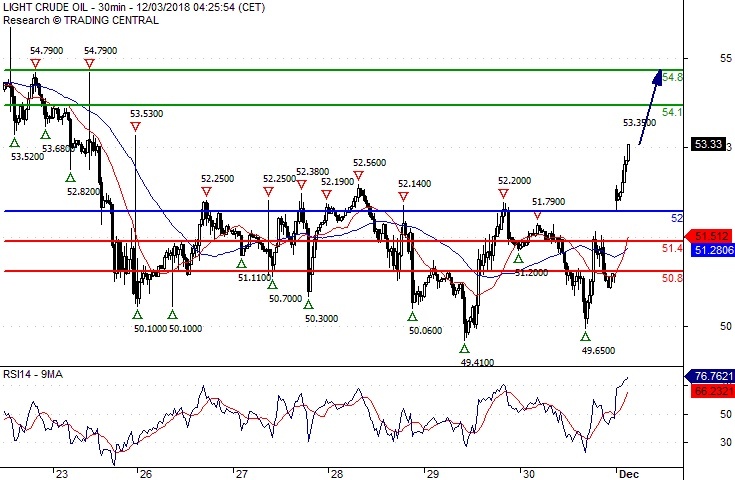
Crude Oil Further Advance
Pivot (invalidation): 52.00
Our preference Long positions above 52.00 with targets at 54.10 & 54.80 in extension.
Alternative scenario Below 52.00 look for further downside with 51.40 & 50.80 as targets.
Comment The RSI shows upside momentum.
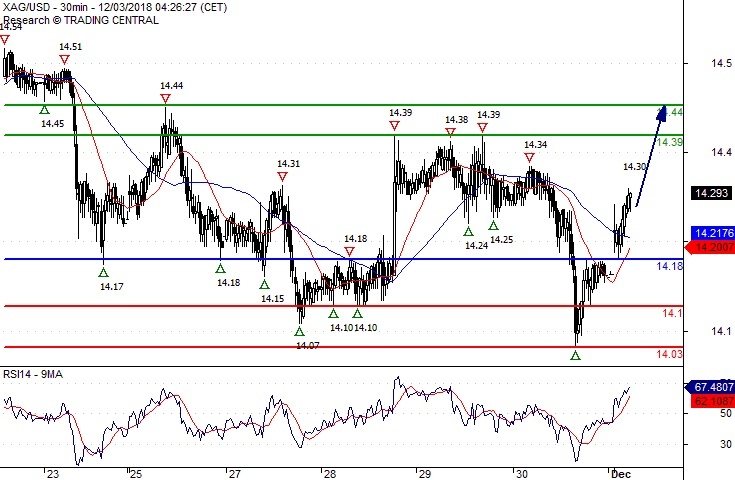
Silver Spot Further Upside
Pivot (invalidation): 14.1800
Our preference Long positions above 14.1800 with targets at 14.3900 & 14.4400 in extension.
Alternative scenario Below 14.1800 look for further downside with 14.1000 & 14.0300 as targets.
Comment The RSI is bullish and calls for further advance.
Eurozone PMI manufacturing finalized at 51.8, big four at the bottom
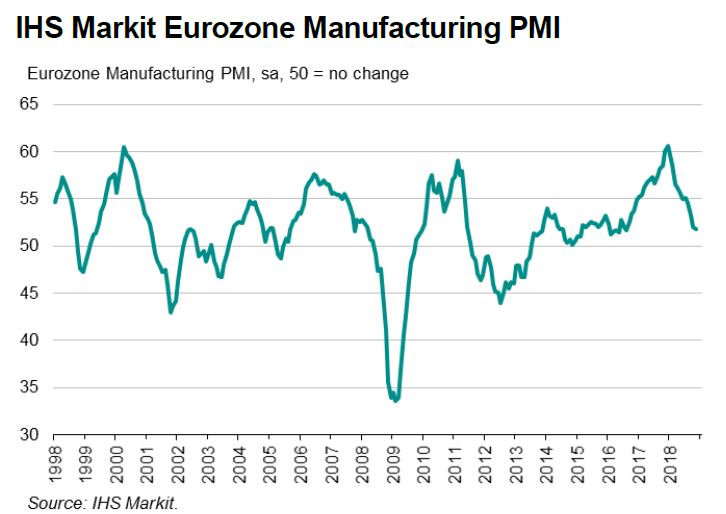
Eurozone PMI manufacturing is finalized at 51.8 in November, revised up from 51.5, down from October's 52.0. It's also the lowest since August 2016. Markit noted that growth of production is only marginal as demand continues to falter. Also, business confidence remains weakest in around six years. And, the euro area's 'big-four' economies posted the lowest manufacturing PMI readings of all countries covered by the survey during November.
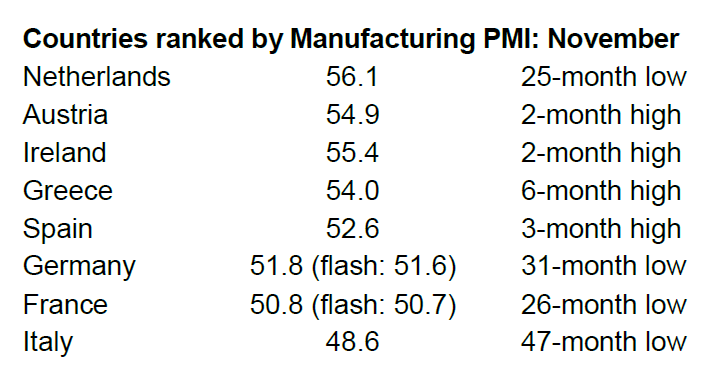
Among the countries, Italy PMI manufacturing stayed in contraction and dropped to 48.6, a 47-month low. France PMI manufacturing dropped to 50.8, a 26-month low. Germany PMI manufacturing dropped to 51.8, a 31-month low.
Commenting on the final Manufacturing PMI data, Chris Williamson, Chief Business Economist at IHS Markit said:
"November's PMI data underscore the extent to which manufacturing conditions have become more challenging, indicating that production could act as a drag on the eurozone economy in the fourth quarter.
"Manufacturers reported that demand is now falling in Germany, France and Italy, while only modest growth was recorded in Spain.
"The darker outlook is linked to trade wars and tariffs as well as intensifying political uncertainty and has led to increased risk aversion and a commensurate cutting back on expenditure, notably for investment. Producers of investment goods such as plant and machinery reported the steepest drop in demand in November, with reduced capital spending by companies compounded by on-going disruption of business in the autos sector.
"Hopes that the soft patch may prove short-lived are countered by business optimism about prospects for the year ahead remaining among the gloomiest seen since the sovereign debt crisis in 2012, suggesting companies are bracing themselves for further weak demand in the coming months.
"The survey also indicates that households could rein-in spending if companies continue to pull-back on their hiring, adding to downside risks to the outlook."
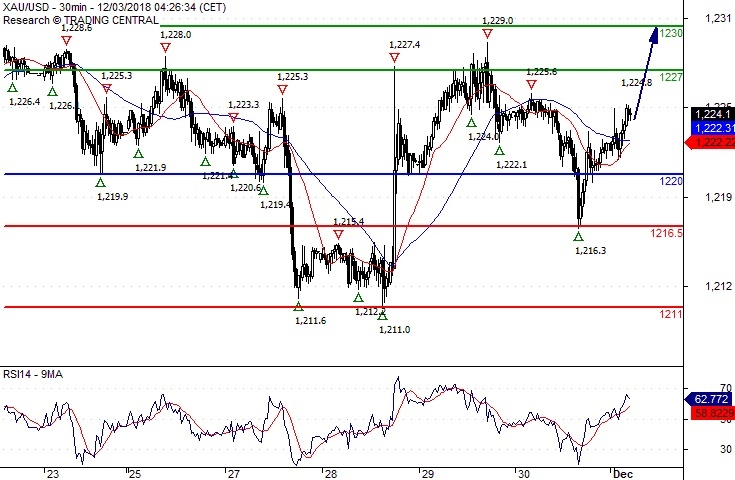
Gold Spot Further Upside
Pivot (invalidation): 1220.00
Our preference Long positions above 1220.00 with targets at 1227.00 & 1230.00 in extension.
Alternative scenario Below 1220.00 look for further downside with 1216.50 & 1211.00 as targets.
Comment The RSI shows upside momentum.
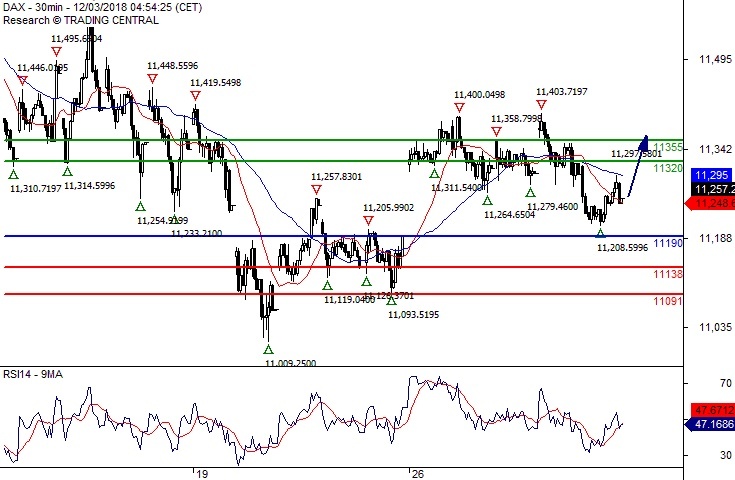
DAX Intraday Support Around 11190.00
Pivot (invalidation): 11190.00
Our preference Long positions above 11190.00 with targets at 11320.00 & 11355.00 in extension.
Alternative scenario Below 11190.00 look for further downside with 11138.00 & 11091.00 as targets.
Comment Even though a continuation of the consolidation cannot be ruled out, its extent should be limited.
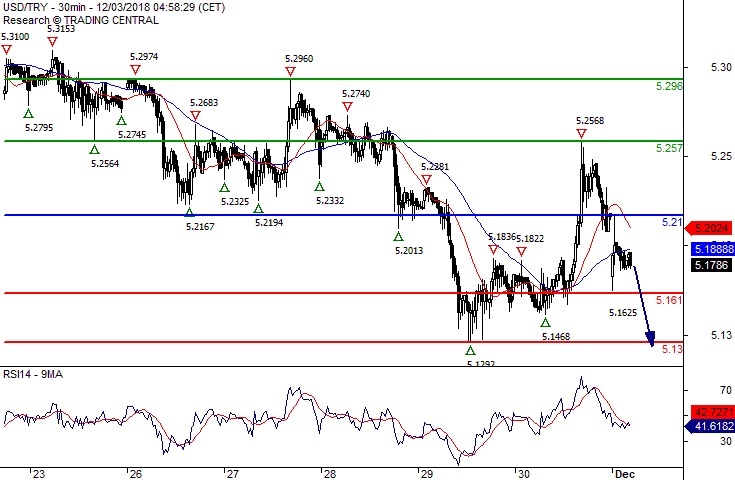
USD/TRY Turning Down
Pivot (invalidation): 5.2100
Our preference Short positions below 5.2100 with targets at 5.1610 & 5.1300 in extension.
Alternative scenario Above 5.2100 look for further upside with 5.2570 & 5.2960 as targets.
Comment The break below 5.2100 is a negative signal that has opened a path to 5.1610.
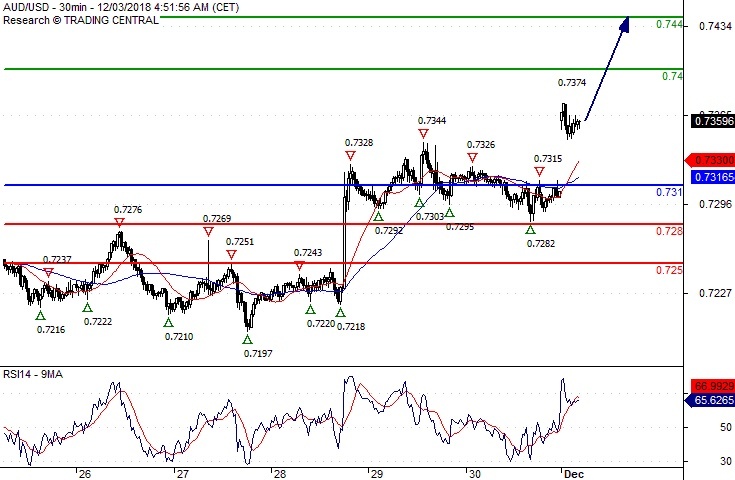
AUD/USD Further Advance
Pivot (invalidation): 0.7310
Our preference Long positions above 0.7310 with targets at 0.7400 & 0.7440 in extension.
Alternative scenario Below 0.7310 look for further downside with 0.7280 & 0.7250 as targets.
Comment The RSI advocates for further advance.