Sample Category Title
Temporary Trade Truce Provides Additional Boost To Risk
Just afew days after Fed Chairman Jerome Powell unexpectedly signaled that the Federal Reserve is turning dovish, investors received furtherpositive news over the weekend after a temporary ceasefire between Washington and Beijing regarding trade tensionswas announced after the G-20 summit in Argentina.
The two-hour dinner between senior authorities from both the United States and China, including President Trump and President Xi,that led to the announcement of a temporary trade truce was of greater importance than the G-20 communique which stated that the WTO needs to be reformed to improve its function. What was delivered over the dinner was not a breakthrough, neither a long-term solution for the ongoing trade war between the largest two economies, but a 90-day window to improve relations. Introduction of new tariffs are now shelved, and trade talks will intensify over the next three months. This outcome seems to be an optimistic one from the two leaders and more than what was priced into markets beforehand, meaning that this is enough to boost sentiment and risk-on trade.
Chinese stocks rose more than 3% and the S&P 500 futures surged 1.7% at the time of writing. While bulls seem to be well in control for now, investors need to know that what was achieved is only a short-term relief to markets. Whether this will be translated into longer-term advances depends on the path of negotiations over the next three months. For now, one obstacle has been removed, but all longer-term risks remain there.
Canada joins Saudi Arabia and Russia in managing production
The risk-on rally sent Brent Oil above $62 early Monday. The U.S.-China trade truce is not the only source of support for prices, but signals of another production cut from Russia and Saudi Arabia seem to be the key factor. OPEC’s official meeting will be held on Wednesday and markets are expecting to see a substantial production cut after Russian President Vladimir Putin said his country’s cooperation on Oil supplies with Saudi Arabia would continue. Another surprising announcement came from the government of Alberta on Sunday stating a cut of 325,000 barrels a day for three months starting in 2019. Given thiscombination of factors, Oil prices are likely to have bottomed out for 2018, but a confirmation is needed when OPEC and non-OPEC members meet in Vienna on December 6.
Dollar heads south
The demand for riskier assets sent the Dollar lower against most developed and emerging market currencies. The Dollar index fell back below 97 with commodity currencies AUD and CAD being the best performing ones. The Chinese Yuan also broke a three-week trading range to trade 0.8% higher against the Greenback. This relief rally may continue for the next couple of days, unless surprising negative news arises.
USD/CAD Daily Outlook
Daily Pivots: (S1) 1.3263; (P) 1.3299; (R1) 1.3324; More...
USD/CAD's sharp decline and break of 1.3187 support today confirms short term reversal, after rejection by 1.3385 key resistance. Intraday bias is turned to the downside for 38.2% retracement of 1.2781 to 1.3359 at 1.3138 first. Break will target 61.8% retracement at 1.3002. On the upside, break of 1.3385 resistance is needed to confirm upside momentum. Otherwise, risk will stay on the downside even in case of strong rebound.
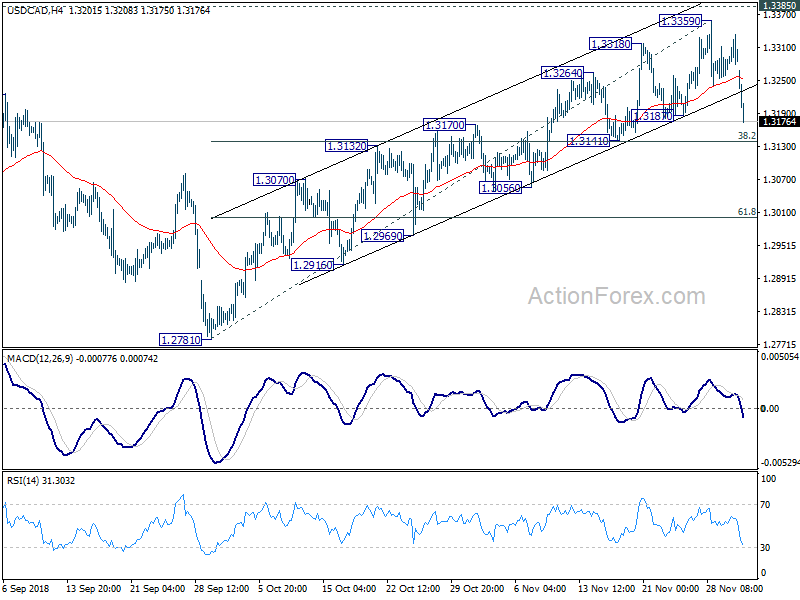
In the bigger picture, current development argues that medium term corrective pattern from 1.3385 is extending with another falling leg. While deeper decline could be seen, downside should be contained by 50% retracement of 1.2061 to 1.3385 at 1.2723 to bring rebound. An eventual upside break out is still expected to 61.8% retracement of 1.4689 (2016 high) to 1.2061 at 1.3685, at a later stage.
EURUSD Hovers Below SMAs As Negative Outlook Remains
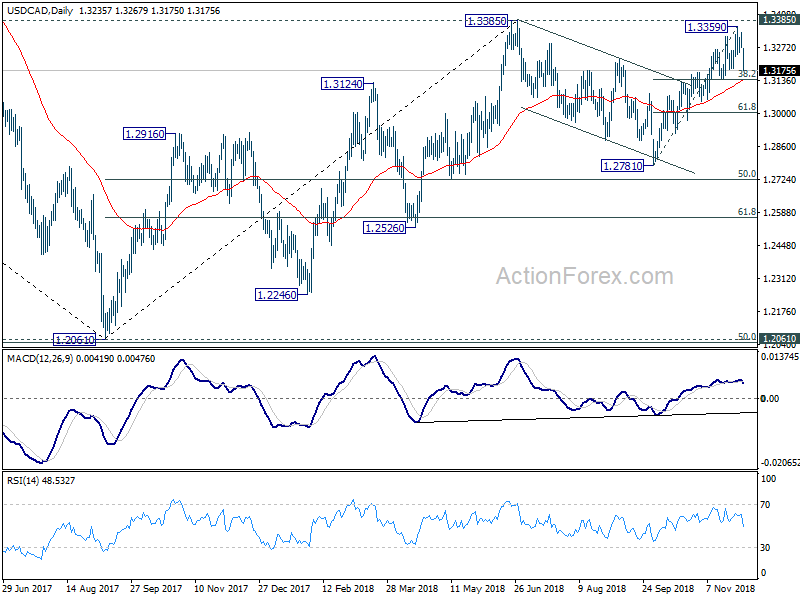
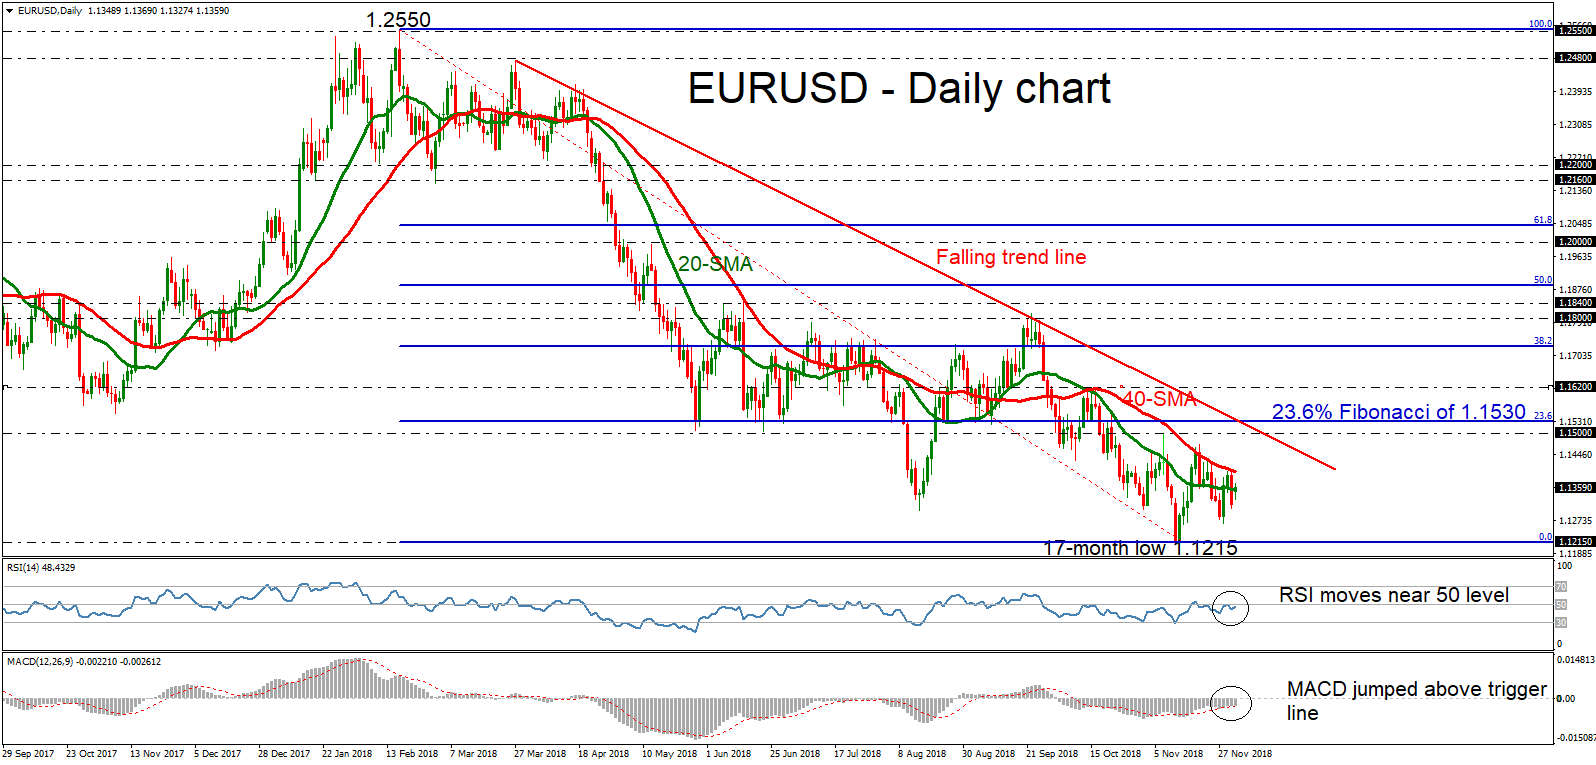
EURUSD continues the negative tendency over the last eight months and has been stuck below the 20- and 40-day simple moving averages (SMAs). Looking at momentum indicators, the RSI is pointing slightly up but is below its neutral threshold of 50, while the MACD also remains in negative territory while moving above its red signal line.
Should the pair experience more negative pressure, the market could meet support at the 17-month low of 1.1215, before the price heads sharply lower towards the 1.1115 mark, identified by the lows on June 2017. In case of steeper declines, the pair could breach this trough, diving to 1.0830, which was reached in May 2017.
In case of a climb above the aforementioned lines, the price could challenge the 1.1500 strong psychological level, registered on November 7. Slightly above this region, the 23.6% Fibonacci retracement level of the downleg from 1.2550 to 1.1215, around 1.1530 could be next level to focus on, before touching the descending trend line.
Overall, the bearish picture in the long-term looks to persist for a while longer as EURUSD has been developing in a downtrend since March of the current year.
EURUSD 1.1300 Support Holds Support Holds Firm
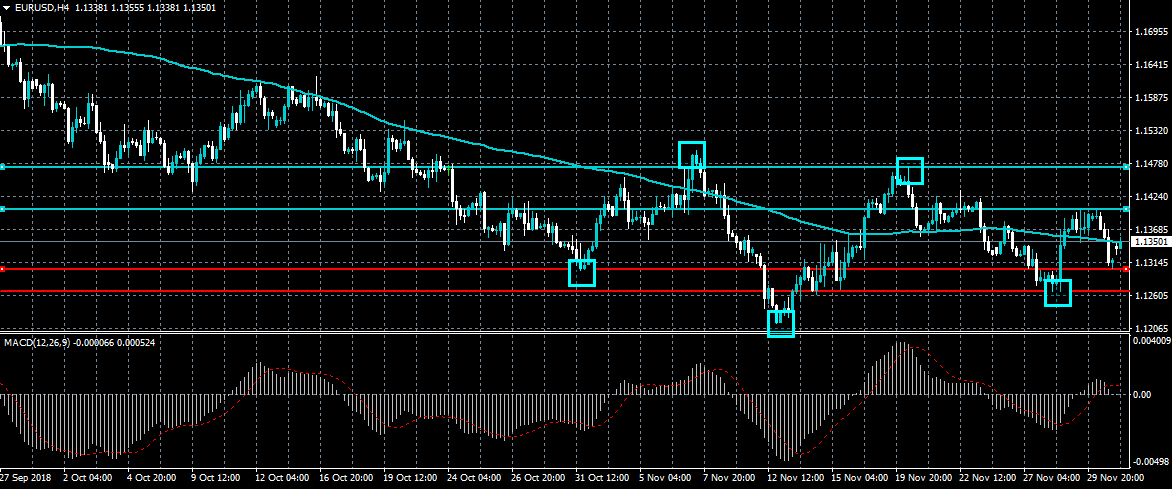
The euro has opened the new trading week on stronger footing against the US dollar currency, following a positive outcome from the weekends G20 Summit. The EURUSD pair has bounced from the 1.1300 level, putting the bullish inverted head and shoulders pattern on the lower time frames back in focus. Overall, a clear break from the 1.1300 to 1.1400 price range is needed to encourage short-term directional traders to enter into the market.
The EURUSD pair is only bullish while trading above the 1.1400 level, key technical resistance remains at the 1.1470 and 1.1500 levels.
If the EURUSD pair trades below the 1.1300 level, sellers may test the 1.1270 and 1.1216 levels.
GBPUSD Awating Key Manufacturing Data
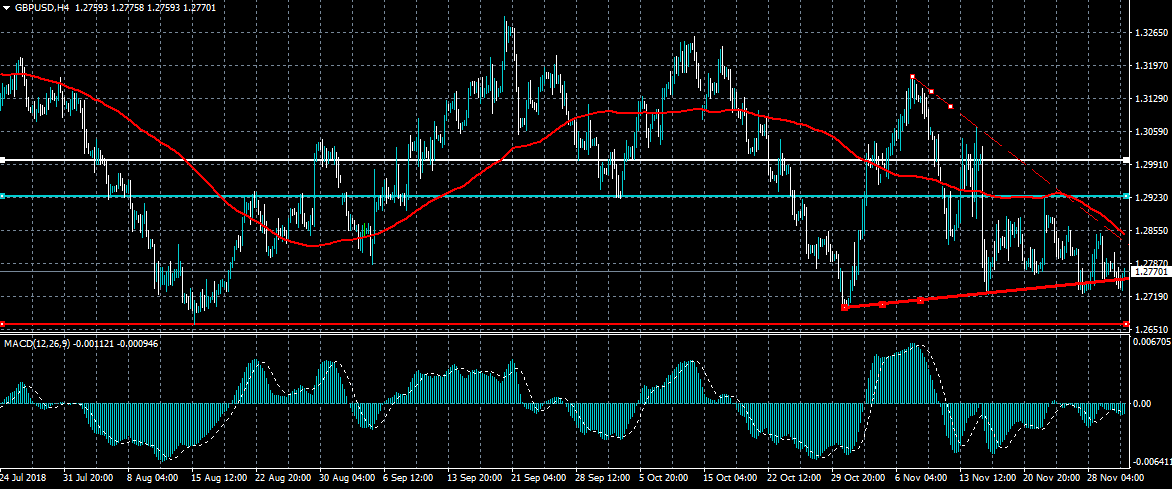
The British pound continues to trade at depressed levels against the greenback in early week trade, following a strong technical rejection from the 1.2800 level. Overall, sterling traders remain cautious ahead of the upcoming vote on British PM Theresa May’s proposed Brexit deal in UK parliament next week. The release of the United Kingdom Manufacturing PMI will likely spark the next short-term directional move in the GBPUSD pair.
The GBPUSD pair remains bearish while trading below the 1.2800 level, key technical support is found at the 1.2750 and 1.2695 levels.
If the GBPUSD pair trades above the 1.2800 level, key resistance is found at the 1.2852 and 1.2923 levels.
ETHUSD Bulls Need To Break The $125.00 Level
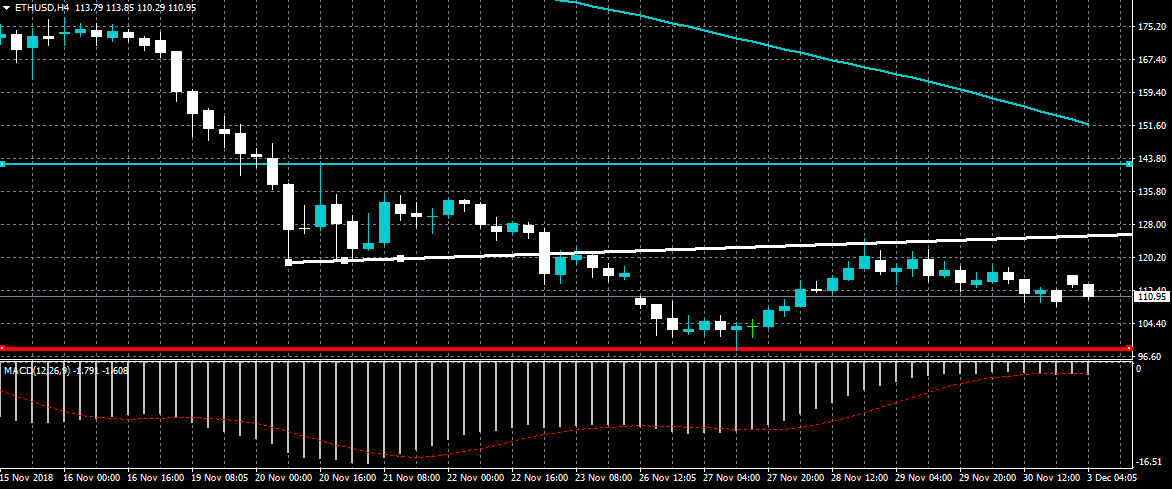
Ethereum has slipped under the $110.00 level in early week trade after the recent short-term recovery met strong technical resistance from the $125.00 level. Buyers now need to break the $125.00 level in order to find further bullish momentum for an attack on the $140.00 resistance level. A sustained loss of the $100.00 support level should put the ETHUSD pair under considerable selling pressure.
If the ETHUSD pair trades below the $100.00 level, sellers are likely to test towards the $97.60 and $90.00 support levels.
If ETHUSD buyers breach the $125.00 resistance level, further upside towards the $140.00 and $152.00 levels seems possible.
Market Excited After US-China Agreement
The price of crude oil soared in the Asian session after the US and China reached a deal to suspend trade hostilities. In a meeting between President Xi and Trump, the two leaders agreed to halt hostilities and work on developing a trade deal beneficial for the two countries. Trump agreed not to raise tariffs to 25% on Chinese goods while China agreed to increase purchases of American goods. Traders will continue paying close attention to the upcoming meeting of OPEC ministers in Vienna.
The Australian dollar rose today after the agreement between the United States and China. This is despite the relatively weaker economic data from Australia. Building approvals for October contracted by 1.5%, which was worse than the expected decline of 1.4%. In September, the approvals had increased by 5.5%. Moreover, company gross operating profits increased by 1.9% for the third quarter, which was lower than the consensus estimate of 2.9%. Business inventories were unchanged. The consensus estimate was a growth of 0.4%. On a positive note, the construction work done in the third quarter jumped by 2.7%.
The Caixin manufacturing PMI showed that activity in China’s manufacturing industry rose to 50.2 in November. This was lower than the consensus estimate of 50.0. Last week, the PMI data from Markit showed that activity had slowed down to 50. Later today, traders will receive the manufacturing PMI data from France, Germany, Brazil, and the United States.
XTI/USD
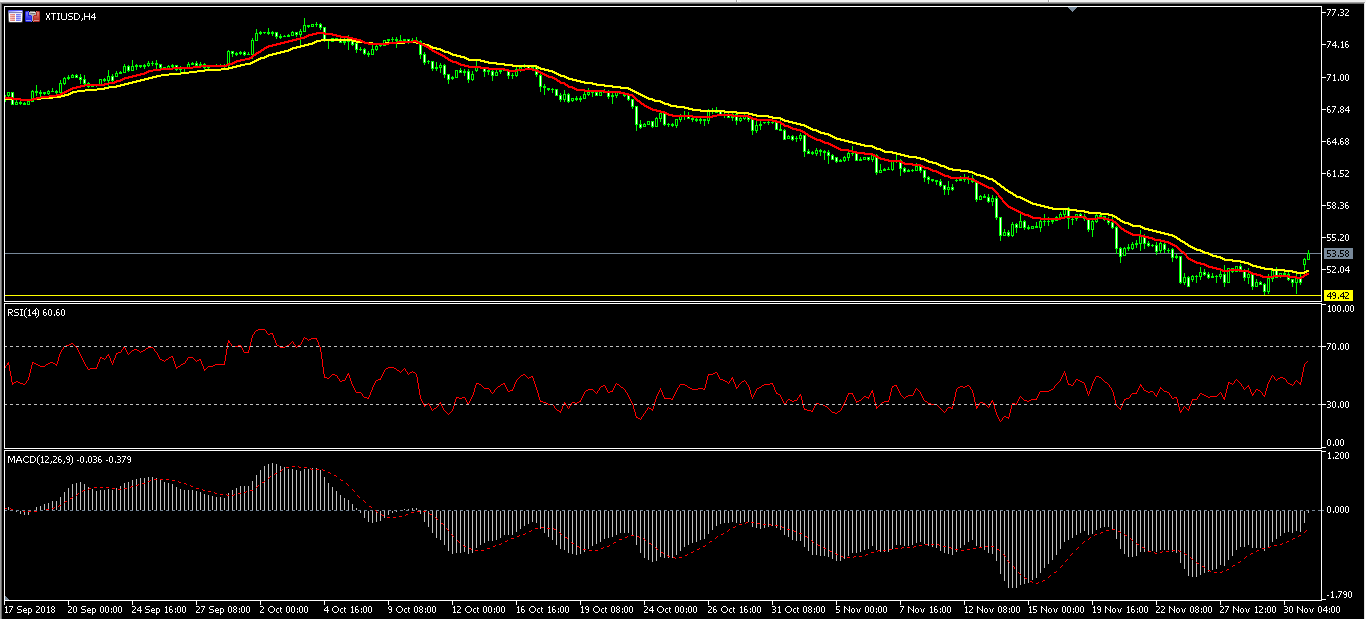
On Thursday and Friday, the XTI/USD pair traded in a narrow range between 49 and 50. This came as traders waited for the G20 meeting. Today, the price jumped to 53.9. This was the highest level in more than a week and a likely sign that the downward pressure is over. The rally could accelerate ahead and after the OPEC meeting in Vienna. On the four-hour chart, the 15-day EMA is crossing the 30-day EMA in a bullish way. The RSI has moved from 35 and is currently at 60 while the MACD is moving above the neutral level. It is likely therefore that the new upward trend will continue.
EUR/USD
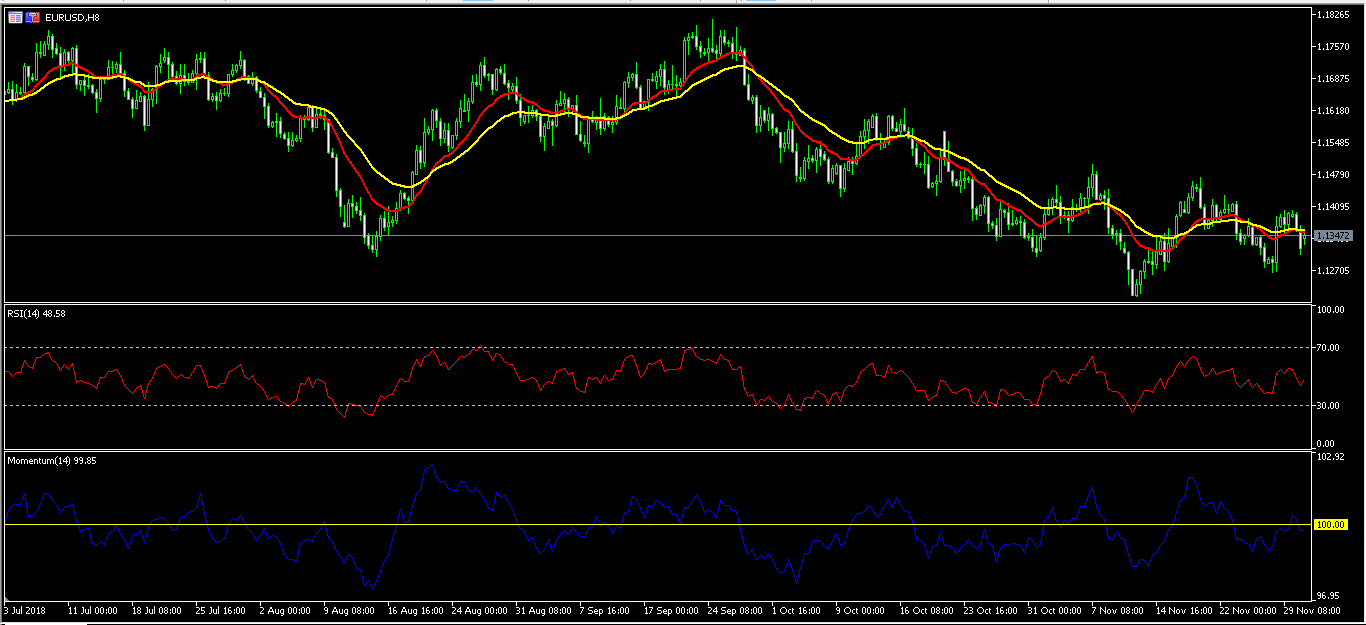
The EUR/USD pair moved up slightly today after the G20 meeting. Going forward, the pair will likely be affected by the PMI data from Europe and the US. The pair is still trading within a range as shown in the 8-hour chart below. The current price is along the 30-day and 15-day EMA while the RSI is at a neutral place. The same is true with the momentum indicator, which is at the 100 level. This is an indication that the pair could breakout in either direction.
AUD/USD
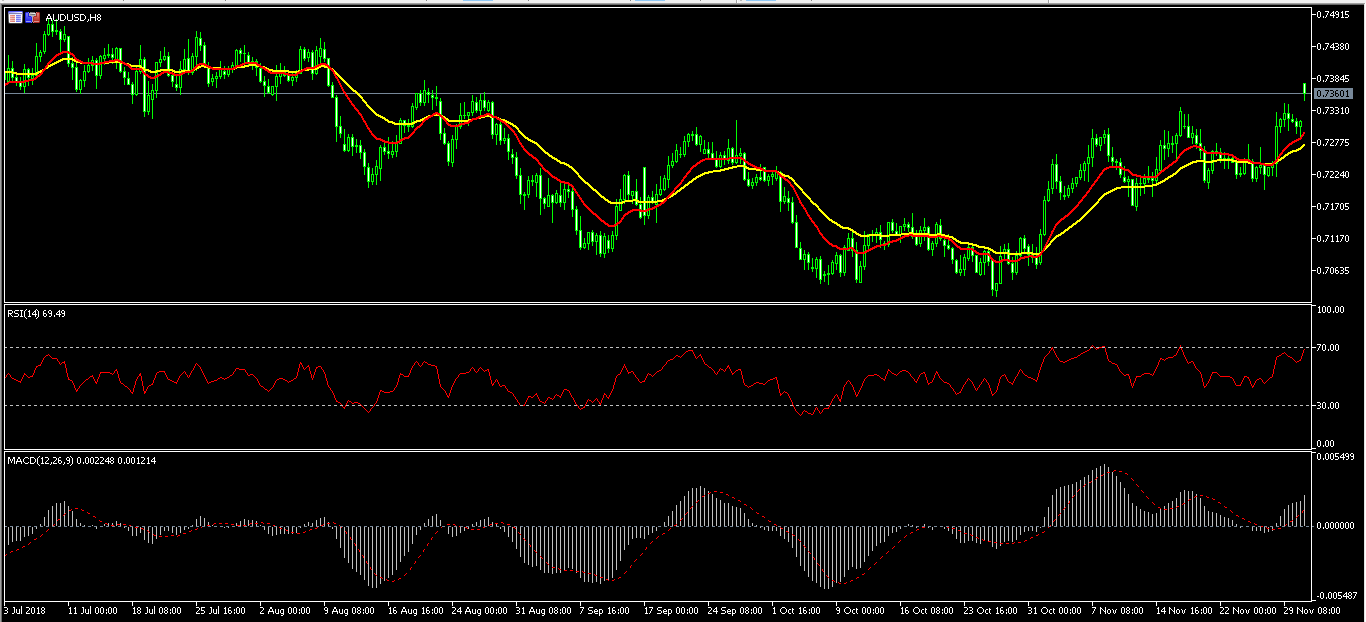
The Australian dollar rose sharply in the Asian session today. The pair reached an intraday high of 0.7380, which is the highest level since August this year. It was a continuation of a rally that started in October. The pair’s price is above the 15-day and 30-day EMA while the RSI has jumped to almost 70. The MACD too has moved above the neutral line. Therefore, it is likely that the upward rally will continue
GBP/USD And EUR/GBP Consolidating Below Key Resistances
GBP/USD declined recently and settled below the 1.2840-50 support area. EUR/GBP is currently in an uptrend, but it is struggling to break the 0.8920-30 resistance area.
Important Takeaways for GBP/USD and EUR/GBP
- The British Pound broke the 1.2800 support recently and tested the 1.2730 zone.
- There is a major bearish trend line in place with resistance at 1.2820 on the hourly chart of GBP/USD.
- EUR/GBP is currently placed nicely above the 0.8860 support area.
- There is a major resistance trend line in place with resistance at 0.8930 on the hourly chart.
GBP/USD Technical Analysis
The British Pound started a major downside move from well above the 1.2900 support area against the US Dollar. The GBP/USD pair traded lower and broke the 1.2880, 1.2850 and 1.2800 support levels.
The decline was such that the pair even settled below the 1.2800 level and the 50 hourly simple moving average. A low was formed near 1.2730 on FXOpen and later the pair started consolidating in a range above 1.2740.
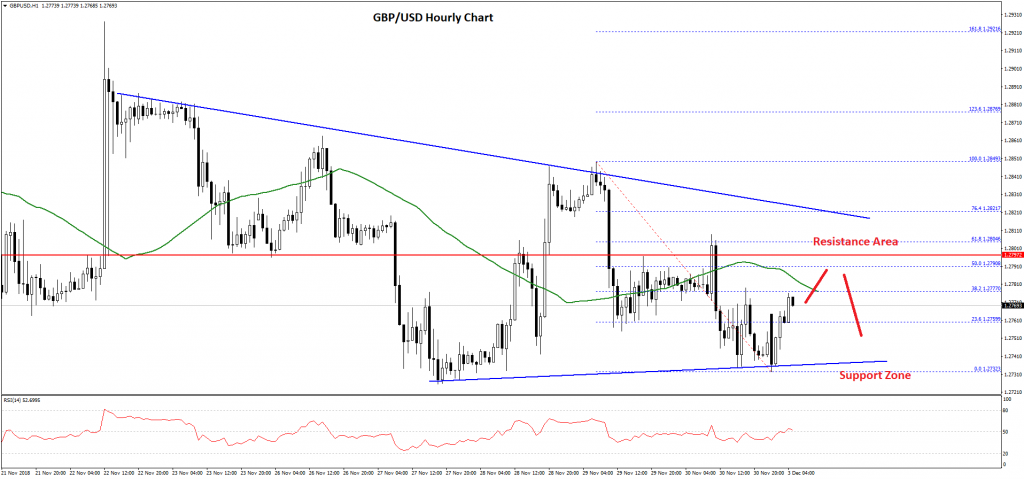
The recent swing low was 1.2732 and later the pair moved above the 23.6% Fib retracement level of the last slide from the 1.2849 high to 1.2732 low. However, there are many hurdles on the upside near the 1.2775 level and the 50 hourly SMA.
Above 1.2775, the next resistance is around 1.2795 and the 50% Fib retracement level of the last slide from the 1.2849 high to 1.2732 low. More importantly, there is a major bearish trend line in place with resistance at 1.2820 on the hourly chart.
Therefore, if the pair continues to move higher, it could find a lot of hurdles near the 1.2790 and 1.2820 levels. A successful close above 1.2820 may push the pair towards the next resistance at 1.2850.
On the downside, an initial support is at 1.2750 followed by the 1.2730 base. If there is a downside break below 1.2730, the pair could decline towards the 1.2660 support zone.
EUR/GBP Technical Analysis
The Euro remained in a major uptrend and it recently traded above the 0.8900 resistance area against the British Pound. The EUR/GBP pair traded towards the key 0.8920-30 resistance area where sellers emerged and protected more gains.
Later, the pair corrected lower and traded below the 0.8900 support area. There was a break below the 38.2% Fib retracement level of the last wave from the 0.8810 low to 0.8924 high. The pair even declined below the 0.8880 support level and the 50 hourly simple moving average.
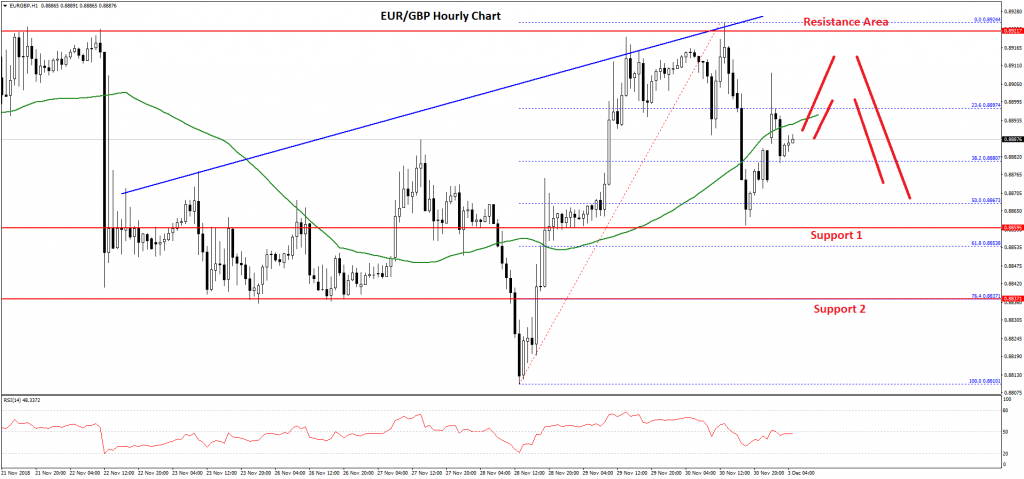
However, the decline was protected by the 0.8860 support and the 50% Fib retracement level of the last wave from the 0.8810 low to 0.8924 high.
Later, the pair bounced back and it is currently trading near the 0.8890 level. On the upside, an initial resistance is near 0.8900 and the 50 hourly SMA. Above this, the main hurdle is near a major resistance trend line in place with resistance at 0.8930 on the hourly chart.
A proper close above the 0.8930 resistance could accelerate gains towards the next key barrier at 0.9000. On the downside, the pair may continue to find support near the 0.8860 support. If sellers push EUR/GBP below 0.8860, the pair is likely to correct lower towards the 0.8840 or 0.8810 support.
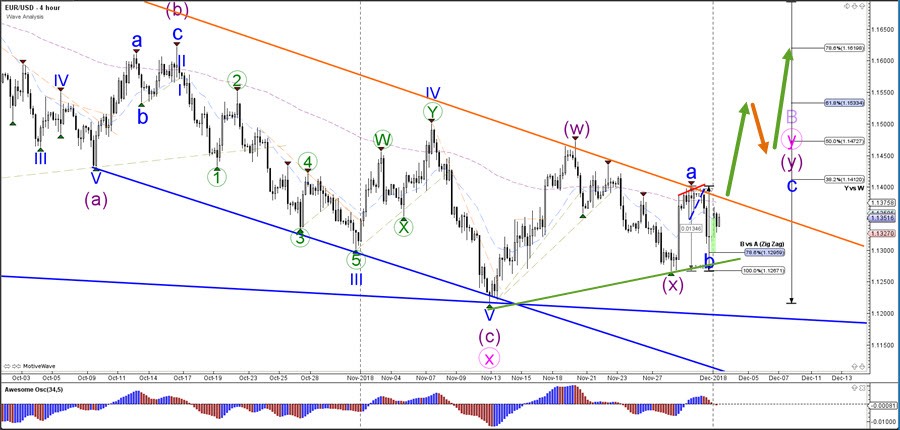
EUR/USD Bullish Reversal At 78.6% Fib Starts Wave C
The EUR/USD bullish break above the bearish channel could confirm the bullish wave C (blue) of a larger ABC zigzag pattern. Price could move up to test the Fibonacci retracement levels. A bearish break below the support trend line (green) and 100% Fibonacci level invalidates the ABC (blue) and indicates a deeper retracement within wave X (purple).
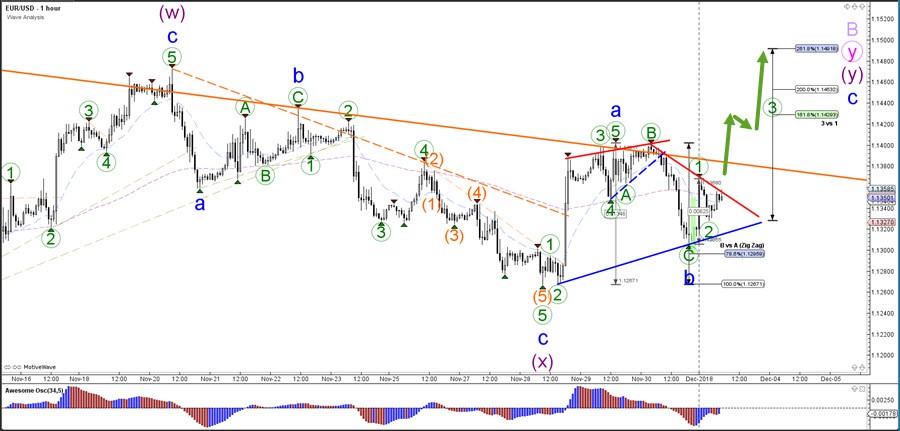
The EUR/USD broke below the support trend line (dotted blue) of the rising wedge reversal chart pattern, which seems to have completed a bearish ABC (green) zigzag within waveB (blue). The bullish bounce could be a wave 1-2 (green) pattern as long as price stays above the support line (blue).
AUD/USD Daily Outlook
Daily Pivots: (S1) 0.7289; (P) 0.7308; (R1) 0.7332; More...
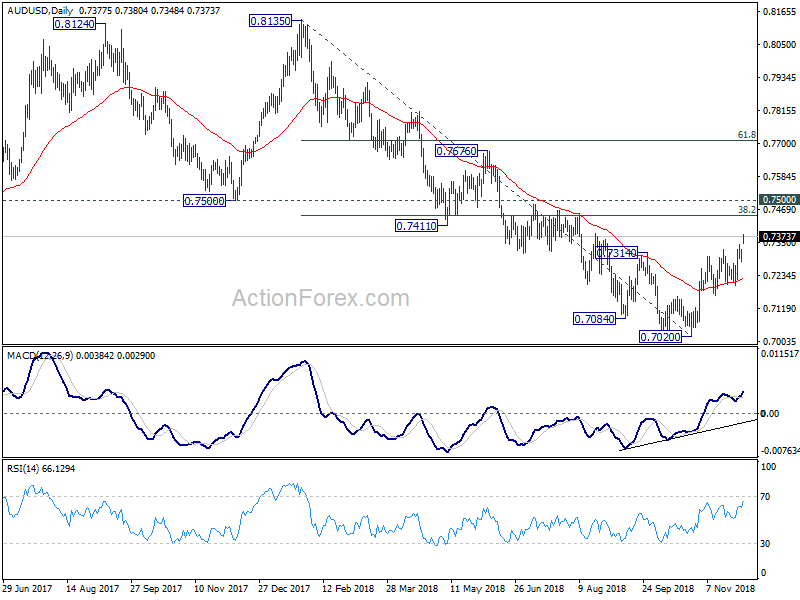
AUD/USD surges to as high as 0.7380 so far today. The strong break of 0.7314 resistance finally confirmed medium term reversal. Intraday bias is on the up side for further rally to 38.2% retracement of 0.8135 to 0.7020 at 0.7446 and above. On the downside, break of 0.7284 minor support will turn intraday bias neutral first. But near term outlook will stay bullish as long as 0.7199 support holds.
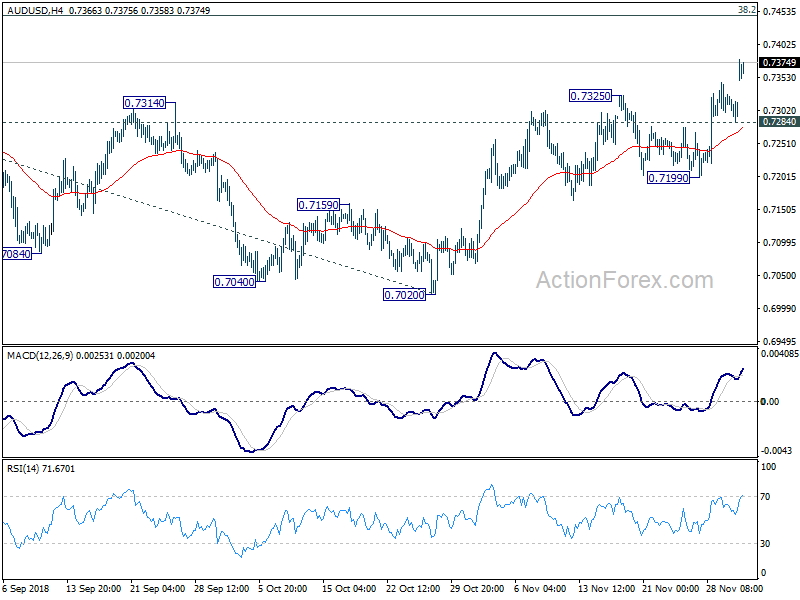
In the bigger picture, AUD/USD's decline from 0.8135 should have completed at 0.7020 already, ahead of 0.6826 key support (2016 low). Stronger rebound should be seen. But still, we'd expect strong resistance from 0.7500 support turned resistance to limit upside. Medium term fall from 0.8135 should extend to take on 0.6826 low at a later stage.