Sample Category Title
ISM Manufacturing PMI to Tick Up in November
The ISM manufacturing index, a closely watched indicator for US factory activity and thus a growth barometer will come into the light on Monday at 1500 GMT. The figure is expected to show that manufacturers regained some lost ground in November, retaining the streak of overall robust growth for months now. An upbeat report could reflect that the US is expanding at a healthy pace in the final quarter despite trade frictions and a slowing global economy.
According to forecasts, the ISM manufacturing PMI has risen a little bit in November to a reading of 57.8 from 57.7 in October. While this is below the 34-year high of 61.3 registered in September, it is still comfortably above 50, the threshold which separates contraction from expansion in the industry. If this is indeed the case, markets could feel more confident that GDP growth in the final quarter will remain robust and above the 3.0% target for 2019 set by the US administration.
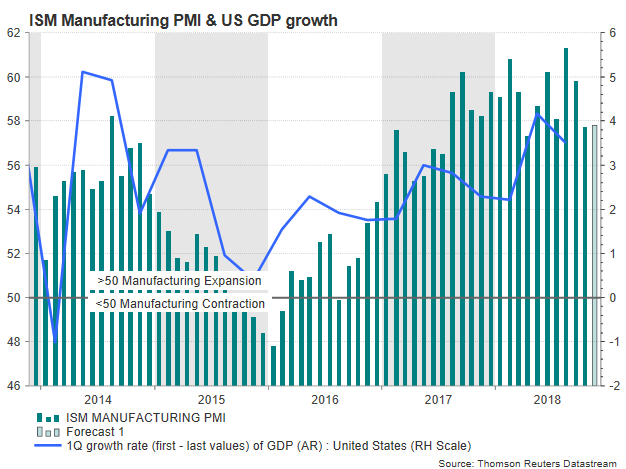
Yet, given the ongoing trade war and the fact that Trump’s Republicans don’t have the full control of Congress anymore to comfortably pass additional tax cuts, questions remain about how long the US could support manufacturers against a slowing global economy which could sooner or later drain demand for exports. Two days ago, the Bureau of Economic analysis confirmed that GDP growth pulled back to 3.5% q/q after jumping by 4.2% in Q2, the strongest pace of growth over the past four years. A deceleration in personal consumption expenditures and a downturn in exports contributed to the weakness, offsetting higher business spending on equipment.
Should Trump fail to reach a trade compromise with his Chinese counterpart by the end of the year, US businesses could face higher taxes when importing goods from China in January and thus narrower profit margins.
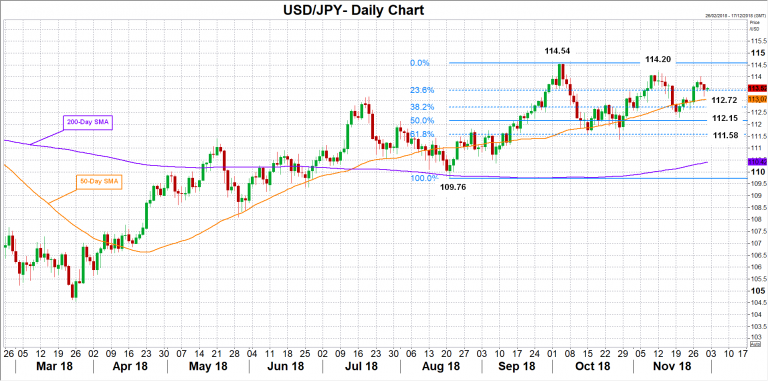
Turning to FX markets, traders continue to favour the dollar amid political risks in Europe and optimism over the still solid path of the US economy despite the Fed chief Powell communicating this week that the Fed could turn more cautious on interest rates in 2019. A better-than-expected ISM manufacturing index on Monday could help the pair crawl up to 114.20 where it found resistance on November 12, while a leg higher may also touch the 114.54 top before the 115 barrier comes under the radar.
On the other hand, if the numbers detect further deterioration in manufacturing conditions, the pair may return to the 113 round level, where the 50-day simple moving average (SMA) is currently approximately standing. Slightly lower, the price may pause between the 38.2% Fibonacci of 112.72 and the 50% Fibonacci of 112.15 of the upleg from 109.76 to 114.54. A stronger sell-off could emerge below the 61.8% Fibonacci of 111.58.
On Monday, investors will be scrutinizing the outcome of the G20 summit which kicks off today in Argentina and particularly the trade discussions between the US President and his Chinese counterpart. Positive trade news may pull funds away from safe-haven assets such as the dollar and the yen.
Elliott Wave Analysis: Correction on USDCHF Points Lower
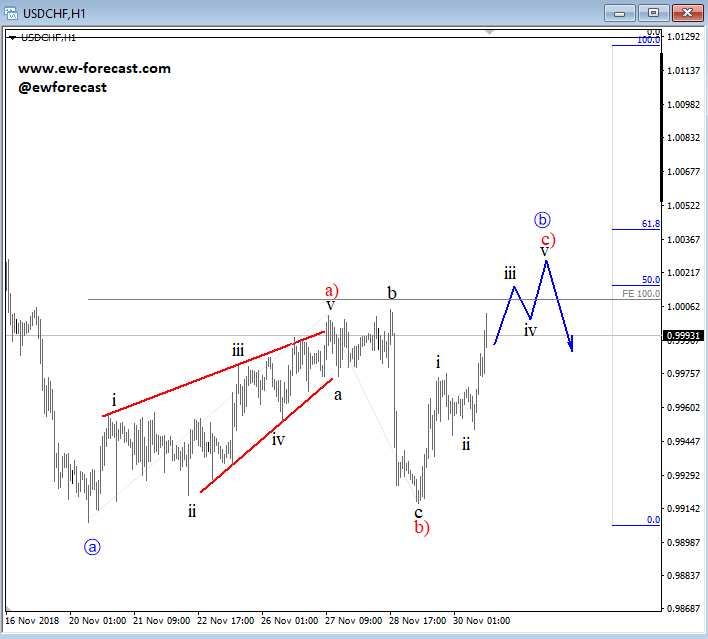
USDCHF is trading in a corrective wave b, which is unfolding a three-wave a)-b)-c) move with wave c in play. Wave c is a motive wave, which means it must unfold five legs, before we may label it as completed. At the moment we see sub-wave iii of c) unfolding, so more upside can still be expected on the pair, and resistance and a turning point can later be found around the Fibonacci ratio of 50.0 or 61.8.
All being said, a drop from the Fibonacci ratio in five waves would suggest a completed correction and further weakness.
Week Ahead – Spotlight on US Jobs Report after ‘Powell Put’; RBA and BoC Meet
The coming week will be significant both in terms of data releases as well as for central bank meetings. November nonfarm payrolls out of the US will likely be the most anticipated report but it’s going to be a big week for the Australian dollar too as Q3 GDP numbers are due along with an RBA meeting. The Bank of Canada will be the other central bank holding a scheduled meeting, though the Canadian dollar will probably be paying more attention to what OPEC and its allies decide on output levels at a meeting next week.
Busy week for aussie as Q3 data and RBA meeting eyed
Aussie traders will be treated to a barrage of economic indicators out of Australia next week, with a Reserve Bank of Australia policy meeting topping the calendar. The Australian dollar has risen by 2.9% versus the greenback from its October lows. Next week’s releases and the RBA statement could determine whether the aussie is able to sustain its latest upswing.
Starting the week on Monday are business inventories numbers for the third quarter, which will be one of two GDP components published prior to the full report on Wednesday. Other data on Monday will include the AIG manufacturing index for November and October building approvals. On Tuesday, the net exports contribution figure will be the final clue to Q3 GDP. Net exports are expected to have contributed 0.2 percentage points to GDP in Q3, higher than the 0.1% in the preceding quarter.
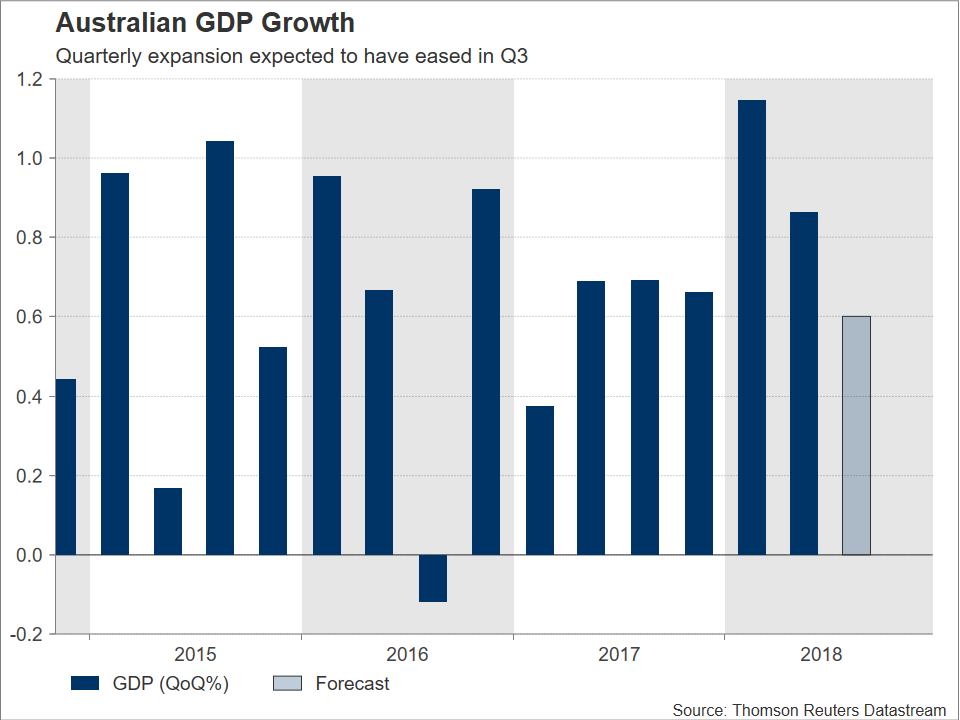
The RBA will also be in focus on Tuesday, but investors are not anticipating any surprises from the central bank, which is expected to hold rates unchanged at 1.5% and stick to recent language in its statement. On Wednesday, third quarter GDP estimates will show whether the RBA’s consistently upbeat view of the economy is justified. The Australian economy is forecast to have expanded by 0.6% q/q, something which would put the annual growth rate during the July-September quarter at 3.3%, slightly below Q2’s 3.4%. Rounding up the week will be retail sales and trade balance figures for October on Thursday.
Across the Tasman Sea, traders will be looking at a quarterly gauge for New Zealand’s terms of trade during Monday’s Asian session. With data for the third quarter so far being mixed, the terms of trade indicator will be monitored to see if export and import prices made a positive impact on New Zealand’s economy in Q3. The New Zealand dollar has had volatile tendencies to data surprises lately as doubts persist about the country’s growth outlook and amid a more dovish Reserve Bank of New Zealand.
Chinese trade figures to attract attention after Trump-Xi talks
China’s manufacturing sector has been struggling to grow since the summer as the Trump administration began slapping higher tariffs on Chinese exports to the US. The Caixin manufacturing PMI out on Monday is forecast to dip 0.1 percentage points to 50.0 in November, indicating no growth during the month. The sluggish growth comes despite exports holding up relatively well since the tariffs came into force, though this was probably mostly down to frontloading by companies to avoid upcoming levies. Those effects may have started to wane though as exports, due Saturday, are projected to have grown by 10.7% year-on-year in November, down from 15.6% in October; still the forecasted number constitutes a robust figure.
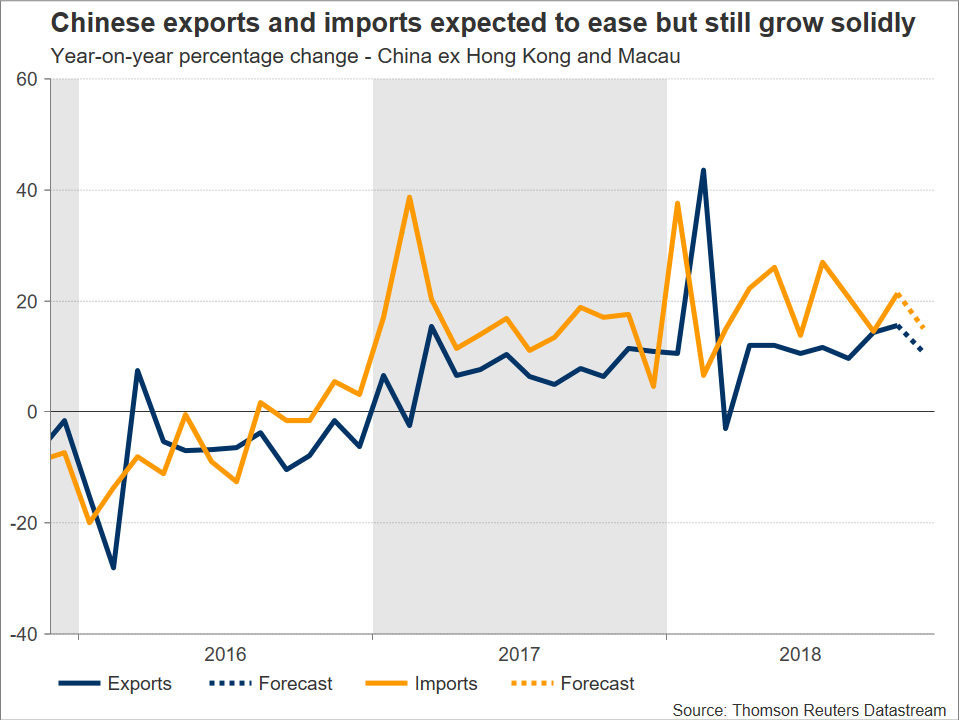
Traders could be prone to overreact to any disappointment from expectations in the PMI and trade figures if the trade talks between US President Trump and Chinese President Xi at this week’s G20 summit don’t bring about a de-escalation in trade tensions between the two countries.
Household spending and wage numbers coming up in Japan
The main releases out of Japan next week will be household spending and earnings figures for October on Friday. Nominal wages in Japan rose by a revised 0.8% in September, squeezing real earnings growth to negative territory for a second straight month. Unsurprisingly, households responded by cutting their spending by 4.5% month-on-month. A further deterioration in October would point to a weak start to the fourth quarter for consumers.
Also important will be data on capital expenditure for the third quarter on Monday as this often acts as a reliable signal to possible GDP revisions.
The yen could enjoy a modest appreciation from any positive surprises to the data. However, a bigger determinant for the yen next week will probably be the outcome of the US-China trade talks as the absence of a breakthrough would likely weigh on market sentiment and drive demand for safe-haven assets.
UK PMIs unlikely to provide much of a boost for sterling
As investors wait for the December 11 vote in the UK parliament on the Withdrawal Agreement with the EU, the November PMIs for the UK should provide some short-term distraction for pound traders. First up is the manufacturing PMI on Monday, followed by the construction PMI on Tuesday and the all-important for the UK economy services PMI on Wednesday.
A poor set of figures would increase the downside pressure on the pound but would also potentially add pressure on British MPs to back Theresa May’s Brexit deal as there are growing signs that the prolonged uncertainty is starting to have a more pronounced impact on UK businesses and consumers.
The Eurozone calendar is also looking somewhat bare next week, and the euro will probably struggle to find much direction, with Italy headlines possibly continuing to remain in the fore. The final reading of the IHS Markit PMIs for November are due on Monday and Wednesday, while Eurozone producer prices for October are out on Tuesday. Wednesday will also see the release of October retail sales followed by the third estimate of Q3 GDP on Friday.
A bigger attraction though might be German industrial orders (Thursday) and industrial output (Friday) for October as investors will be wanting to see whether the downturn in Germany is carrying through into the fourth quarter. Industrial orders are forecast to have more than reversed the prior month’s 0.3% m/m gains in October, but industrial production is expected to have risen by 0.3% m/m in October.
Bank of Canada to hold rates steady
The Bank of Canada will meet on Wednesday for its latest policy decision and is widely expected to keep its overnight rate unchanged at 1.75%. The Bank is unlikely to give much away on future policy in its statement, though the recent market rout and plunge in oil prices could lead it to adopt a slightly more cautious tone.
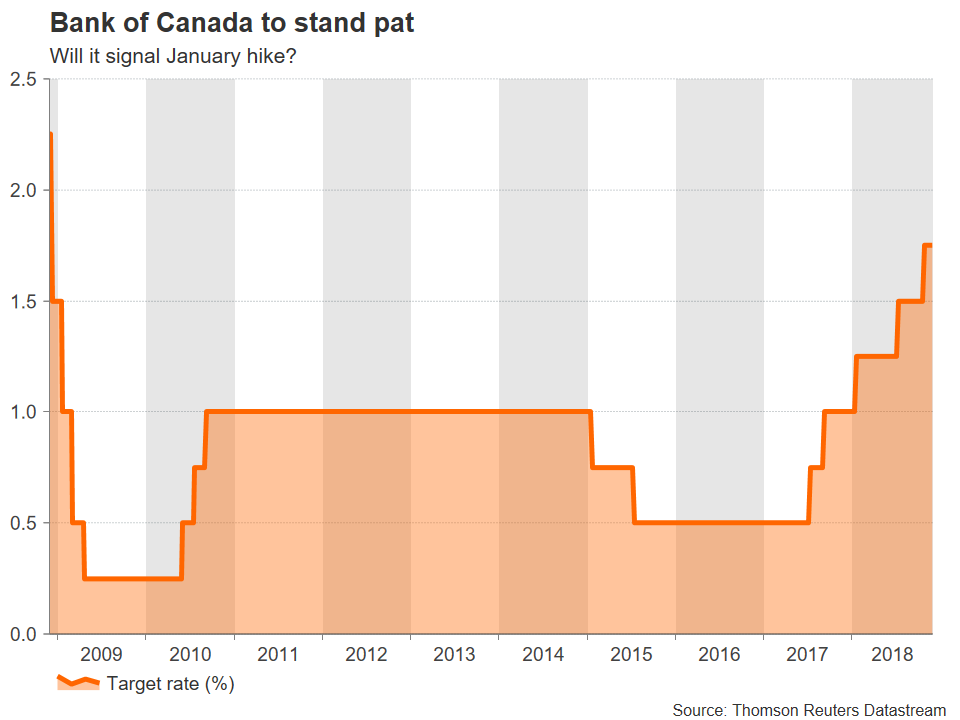
The Canadian dollar could move back towards the past week’s five-month lows versus the US dollar should the BoC drop some of its recent hawkish language. Also significant for the loonie will be the November employment report on Friday.
Ahead of that though on Thursday, is the meeting of OPEC and non-OPEC countries. The alliance of major oil producers is expected to agree to a cut in output of between 1 and 1.5 million barrels to ease the supply glut. A smaller cut would be hugely negative for oil prices, as well as for oil-linked currencies such as the loonie. But before the OPEC/non-OPEC gathering, of great interest will the meeting between Russian President Putin and Saudi Crown Prince Mohammed bin Salman at the G20 summit; oil production issues will be on the two leaders’ agenda.
Dollar to look to ISM PMIs and nonfarm payrolls for growth clues
Following the dollar’s slide on the back of the dovish-perceived remarks by Fed Chair Jerome Powell this week, traders will be turning their attention to US data for any signs that the US economy may be running out of steam. The first major release will be Monday’s ISM manufacturing PMI. While other countries have seen a marked deterioration in manufacturing activity during 2018, the US manufacturing sector has remained strong. The ISM manufacturing PMI is forecast to edge up from 57.7 to 57.8 in November. The non-manufacturing PMI will follow on Wednesday; it is expected to ease from 60.3 to 59.7 in November.
October factory orders are due on Thursday before all eyes turn to the latest jobs report on Friday. The US economy is predicted to have added 200k jobs in November, down from the prior 250k. The unemployment rate is forecast to remain at the multi-decade low of 3.7%, while average earnings are expected to rise by 3.1% y/y, unchanged from the previous month’s 9½-year high. Lastly, Friday will bring the preliminary reading of the University of Michigan’s consumer sentiment index for December.
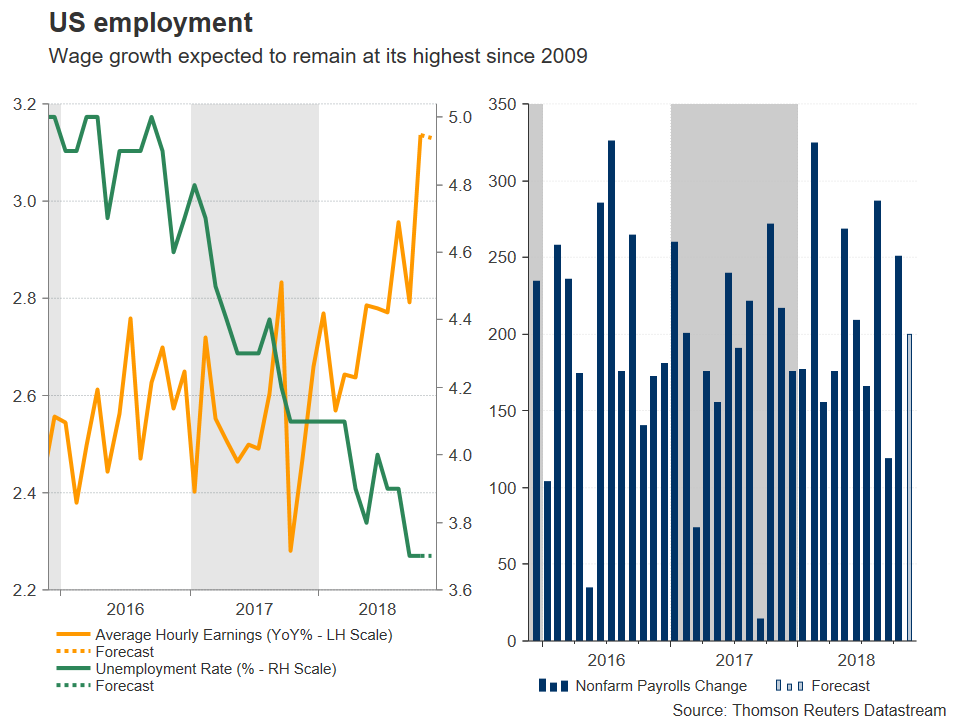
The dollar stands to decisively resume its uptrend should next week’s data suggest the US economy remains on solid track. However, any unexpected weakness in the numbers could drive the greenback further down.
Australia & New Zealand Weekly: Q3 GDP Preview, Housing Slowing Amidst Overall Robust Conditions
Week beginning 3 December 2018
- Australia: Q3 GDP preview, housing slowing amidst overall robust conditions.
- RBA: policy decision and Deputy Governor Debelle speaking.
- Australia: Q3 partials and GDP, dwelling approvals and prices, retail, trade balance.
- NZ: terms of trade, building work put in place.
- China: Caixin PMI's, foreign reserves.
- Europe: GDP 3rd estimate.
- US: nonfarm payrolls, Fed Chair Powell speaks, Federal Reserve Beige Book.
- Other central banks: BOC and RBI policy decisions, BOE Governor Carney speaks.
- Key economic & financial forecasts.
Information contained in this report current as at 30 November 2018.
Australia: Q3 GDP Preview, Housing Slowing Amidst Overall Robust Conditions
Reserve Bank in focus
The Reserve Bank Board meets this Tuesday and is certain to leave rates on hold at 1.50%. We continue to expect the RBA cash rate to remain on hold throughout 2019 and 2020.
Interest rates have been unchanged since a 25bps cut in August 2016, with the most recent hike in November 2010. That said, macro-prudential measures have seen a tightening of lending conditions for housing, triggering a cooling of the sector following a strong upswing.
The RBA expects further, but only gradual, progress in reducing unemployment and returning inflation towards the middle of the target band. A lift in wages growth will be key to achieving a sustained lift in inflation.
Q3 National Accounts
On Wednesday, the National Accounts will provide an estimate of economic activity for the September quarter. We expect output growth of 0.7%, with risks tilted to the downside. Annual growth holds steady at 3.4%, subject to revisions.
To set the scene, some key observations.
First, Australia's output performance surprised to the high side over the past year, with growth at a well above trend 3.4%, including a 4.1% annualised pace over the first half of 2018. Domestic demand grew by a robust 3.4% over the past year, including a 3.0% increase in consumer spending and a 3.0% rise in overall private demand. The unemployment rate has fallen to a six year low of 5.0%.
Second, momentum has eased back in the second half of 2018, heading in to 2019, with the cooling of the housing sector, both prices and activity.
Third, the correction in the housing market is occurring against the backdrop of a robust economy. Notably, government spending is expanding at a brisk pace; elevated commodity prices (which are expected to slip from here) have boosted profits and tax revenue; businesses are increasing investment to meet the needs of a fast growing population; and the Australian dollar has moved lower, supporting the export sector.
Fourth, wages growth while off its lows and moving higher is still running at a sluggish pace. This, and high debt levels at a time of declining house prices, is a headwind for the consumer.
We continue to expect real GDP growth to moderate to around a trend 2.7% in 2019 as world growth eases and with uncertainty around the upcoming Federal election an added headwind.
Turning to the details of the quarterly national accounts.
The arithmetic of our Q3 GDP forecast is: domestic demand 0.5%; net exports, +0.2ppts and inventories a very small negative, rounding up to -0.1ppt.
By way of context, the June quarter arithmetic was: domestic demand 0.6%; net exports +0.1ppt; inventories flat; and statistical discrepancy +0.2ppts (i.e. the income and production measures of GDP outpaced the expenditure measure).
Labour conditions were robust in Q3, evidence the economy still had solid momentum. Total employment grew by 0.7%, with full-time employment +0.8%. and hours worked +0.4%.
On national income, the September quarter was a favourable one on higher global commodity prices, providing a boost to profits. The terms of trade rose by 1.2%, we estimate, to be 3.4% above the level of a year ago. For nominal GDP, we expect a Q3 outcome of 1.2%, with annual growth at a very healthy 5.8%.
Q3 GDP, detail
Household consumption (0.5%qtr, 2.8%yr): Consumer spending remains choppy quarter to quarter, with households selective in what they buy and when. After a robust Q2 outcome of 0.7%qtr, 3.0%yr, there was some loss of momentum in Q3. Retail sales had a softer quarter, +0.2% after a +1.0% in Q2, and vehicle sales weakened. Consumer Sentiment slipped during the quarter, dipping to 100.5 in September, following the change of Prime Minister and a rise in mortgage rates, but has recovered since, to 104.3 in November.
Additional detail in the national accounts around wage incomes and the household saving ratio will also be of key interest. Over the past year, households lowered their savings rate to partially fund consumer spending.
Dwelling investment (+0.4%qtr): Home building activity advanced in Q3, but growth slowed with conditions mixed. Renovations, also choppy, jumped by 4.5%, evidence that households are not overly cautious around their spending decisions. However, in a sign of things to come given the retreat in approvals, new home building activity declined by 1.6%, a turnaround from +3.2% and +3.6% in Q1 and Q2.
New business investment (-0.8qtr, flat yr): Investment turned the corner in 2017, advancing by 7%, after four years of decline. Key to this development was a greatly diminished drag from the mining investment wind-down and an uptrend in non-mining investment. In Q3, infrastructure activity fell by a reported 7.5% (led lower by mining); and non-residential building work declined by 2.2%, while equipment spending rose strongly, +2.2%. Capex plans for 2018/19 point to a lift in business investment in 2018/19.
Public spending (1.4%qtr, 4.7%yr): The public sector - directly accounting for almost a quarter of the economy - has been expanding at a well above trend pace from 2015 onwards. Public investment is trending sharply higher, off low levels, with a focus on long overdue transport projects. Health spending is also moving higher at a brisk pace. For Q3 we anticipate a robust 1.4% rise in public demand, - although there are some downside risks given a dip in public construction. Annual growth holds broadly steady at a brisk 4.7%.
Net exports (+0.2ppt, -0.2ppts yr): Net exports, a surprisingly large drag on growth in 2017, at -1.6ppts for the year, have swung around to be a small positive over the first half of 2018. Recently, exports resumed their uptrend and imports have advanced at a more modest pace. For Q3, net exports added a forecast 0.2ppts to activity. Exports grew by a forecast 0.6%, on services, manufacturing and LNG, while imports dipped, down 0.2%, including a decline in capital goods.
Private non–farm inventories (+0.5%, -0.1ppt contribution): Over the past year, inventories increased by a moderate 1.8% in response to rising domestic demand. For the September quarter, inventories are expected to expand further, albeit at a marginally slower pace, up a forecast 0.5%. Housing and consumer spending took on a softer tone in the quarter, weighing on the need to add to inventories.
Drought conditions, centred in NSW and surrounding areas, will dent farm output in 2018/19. While the impact on growth is expected to be greatest in the December and March quarters, the September quarter will not be immune - with this factor a potential downside risk to our forecast. Some negatives from the drought are included in our Q3 figuring, notably a decline in rural exports (cereal exports are at a 8 year low but meat shipments are at historic highs), as well as indirectly via the impacts on overall consumer and investment spending.
The week that was
This week, the FOMC and Brexit have been the focus globally. On the domestic front, investment partials were received ahead of next week's Q3 GDP report.
Beginning offshore, comments by Chair Powell were taken as dovish by the market, the US 10-year touching the 3.00% level having started the week at 3.04%. Since then however, the 10-year has come back to 3.03%, leaving it effectively unchanged for the week. While Chair Powell did reference the federal funds rate as being "just below" estimates of neutral, context is key. 'Estimates of neutral' here refers to the 100bp range from 2.5% to 3.5% put forward by FOMC members, hence attaining a neutral stance could mean one hike or five. We expect that the total number of hikes to come is likely nearer the top of that range than the bottom. Our forecast is for four more, from December 2018 to September 2019. As per the FOMC's own view, this forecast rests on the strength of underlying momentum in their economy, driven by the consumer. There are, of course, risks to this view. Chief among them are household wealth and sentiment and, for the business sector, the uncertainty created by US trade policy.
For the UK, in stark contrast to the US, the uncertainty felt by the market this week is a true reflection of current conditions. The only positive is that the date of the UK Parliament vote on the draft agreement has now been set, 11 December. Other than this announcement, headlines have carried dire predictions of the economic effect on the UK economy should a no deal Brexit occur, while numerous political interests have continued voicing their displeasure with the draft agreement and process. These are clearly troubling times for the UK, and this uncertainty will remain a threat for some time yet.
While in Europe, it is also worth covering President Draghi's appearance before the EU Parliament's Economic Committee. His remarks again highlighted their confidence in the Euro Area's underlying momentum, albeit while recognising that the data received since his last appearance had been weaker than anticipated. In terms of their forecasts, one has to expect that the December ECB forecast update will see modest downward revisions; however, with regards to core inflation, their expectation of an uptrend remains intact, and with it their plans to end asset purchases at December. Whether the anticipated rate hikes past summer 2019 come to pass will depend on if the current growth slowdown leaves momentum above or below trend in 2019. We argue for the former, and hence continue to see the deposit rate inching towards zero from late-2019. Coming back to Australia, we received two opposing updates on investment for Q3 this week.
The construction work done release reported broad-based weakness across all components, with total activity down 2.8%. While we expect residential investment to continue declining over the coming year, the Q3 weakness in nonresidential construction is likely just a temporary blip given the considerable pipeline of work that remains in place for the sector. This is also the case for infrastructure investment, which is receiving material support from state government spending – particularly in NSW and Victoria.
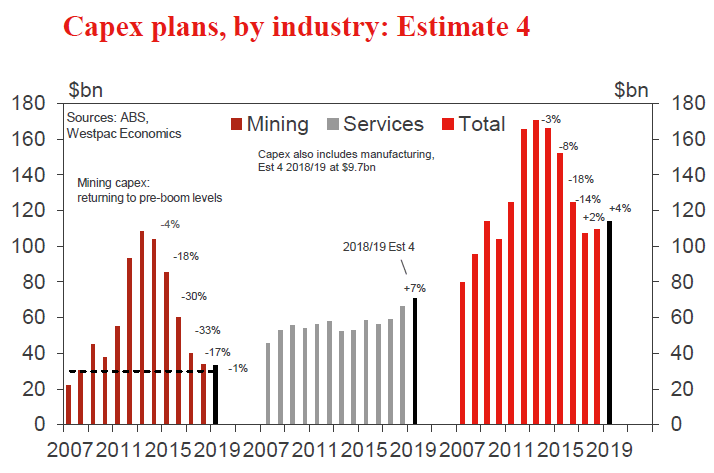
In the CAPEX survey however, offsetting strength in equipment investment was seen, +2.2%. In the quarter, manufacturing provided the strength, while services was flat and mining declined. Important for the outlook, not only was the Q3 print an upside surprise, but so too were expectations for the 2018/19 financial year. Estimate 4 points to a 3–4% gain for investment in the current financial year, up from –1% at estimate 3. Also worthy of note, the sectoral mix of investment intentions was positive, with services and manufacturing leading the way. Our core view on investment remains for a modest gain in non-mining investment, spurred by the needs of a growing population.
Looking ahead to the GDP report next week, we anticipate a 0.7% increase in the quarter, leaving annual growth at 3.4%. To this view, based on the above investment data, risks are tilted to the downside. For all the detail of our forecast, see the GDP preview in our weekly. Further updates on components of Q3 GDP will be received next Monday and Tuesday ahead of GDP on Wednesday.
Finally for the week, the RBNZ has released their latest Financial Stability Report. As expected, the RBNZ eased its loan-to-value limits on mortgage lending after price and credit growth slowed to be broadly in line with income growth. However, it was also announced that banks will be required to hold more capital. Our NZ team note that the latter is a preliminary decision with a consultation paper to follow.
Chart of the week: capex 2018/19 plans estimate 4
The Est 4 on Est 4 figures by industry are: mining -1% (vs -4% 3 months ago); services is +7% (from flat) and manufacturing +7% (from +3%). Using calculation based on average realisation ratios (RRs), we estimate that Est 4 implies capex spending in 2018/19 will be 3.4% above that in 2017/18 (broadly in line with the Est 4 on Est 4 of +4.4%). By industry, using RRs we estimate: mining -10%; services +10% and manufacturing +8%.
In terms of key themes, mining investment will move lower in 2018/19, while non-mining investment is in an uptrend. Construction of the remaining gas projects was recently completed, which will see mining capex decline near-term ahead of an emerging stabilisation. Our central case forecast is for modest gains in non-mining investment to meet the needs of a growing population. This is broadly consistent with this capex survey update and other indicators ~ notable a sizeable pipeline of non-residential building work and the uptrend in infrastructure work, particularly investment in renewables power generation.
New Zealand: week ahead & data wrap
Easy does it
The Reserve Bank has announced a further easing of its mortgage lending restrictions, as we expected. These changes, along with the recent falls in mortgage rates, are likely to see the housing market liven up over the coming months, adding to the flow of positive signals for the local economy. However, we still think that markets are misreading how the Reserve Bank will respond to the economic data, and that official interest rate hikes are some time away.
In its latest six-monthly Financial Stability Report the RBNZ announced a further easing of its restrictions on high loanto- value ratio (LVR) mortgage lending, following the modest easing that was announced a year ago. The 'speed limit' for owner-occupier loans – the share of lending that can be above an 80% LVR – will be raised from 15% to 20%. For investor loans, the effective cap on LVRs will be raised from 65% to 70%. Both changes will take effect from the start of next year.
While household debt levels remain high, the growth in house prices and credit has moderated in recent years, and is now more broadly in line with household income growth. The LVR restrictions have no doubt played a part in this moderation. But since they were first introduced in 2013, they have been joined by a range of other forces that have dampened housing demand. Policies such as the 'bright-line test' for taxing capital gains have targeted investor demand in particular, while the banking sector has moved to tighten lending standards in recent years.
We'd expect the housing market to respond to these LVR changes in a similar way to what we saw last year. Banks increased their high-LVR lending, but maintained a sizeable buffer below the maximum levels. Much of the additional leeway on owner-occupier lending appears to have gone towards first-home buyers. House price growth did pick up a little in early 2018, but it's hard to distinguish between the impact of the LVR changes and the drop in mortgage rates around the same time.
Similar conditions prevail this time – in fact, there has been quite a sharp fall in mortgage rates in recent months. Consequently, we're expecting the housing market to be a bit livelier in the next few months. However, we still expect government policies and an eventual rise in interest rates to keep house prices subdued over the next few years as a whole.
A livelier housing market would add to the signals of a stronger economy that we expect to see over 2019. Rising house prices tend to support consumer spending growth, government spending is accelerating from its previous pace, and a large pipeline of approved work will support construction activity. We're forecasting GDP growth to pick up to 3.2% next year, after slowing to 2.9% growth over 2018.
Financial markets will need to carefully consider what a stronger economy holds in store for monetary policy. We've seen some quite strong reactions to recent RBNZ policy reviews. In August the RBNZ said that it was nearing the threshold for cutting the OCR; market interest rates fell sharply, with some fixed-term mortgage rates falling to new record lows. But in November, when the RBNZ acknowledged that the economy had outperformed its forecasts, interest rates and the New Zealand dollar moved sharply higher again. Interest rate markets are now pricing some chance of an OCR hike by the end of 2019.
We're still of the view that the recent market reaction has been overcooked. The RBNZ sent a clear signal about its intentions in its November Monetary Policy Statement: when faced with a stronger outlook for the economy, it chose to take this as higher inflation (and higher employment) rather than higher interest rates. Its projected path for the OCR was identical to August, with no hikes until well into 2020.
We'd also point out that, unlike in the previous quarter, the economy is not currently outperforming the RBNZ's forecasts. This week's retail trade report showed that sales volumes were flat in the September quarter. The result was surprising given the strength in electronic card spending over the quarter, but nevertheless this is what will go into the GDP figures. Soft retail spending supports our view that September quarter GDP will see a more modest gain of 0.7% after the whopping 1% rise in the June quarter.
As for inflation pressures, recent developments have actually been to the downside. World oil prices have fallen sharply, from a peak of around US$85 a barrel for Brent crude in early October to below $60 a barrel today. Accordingly, petrol prices have fallen to their lowest levels since May (despite an increase in fuel taxes since then).
Meanwhile, the New Zealand dollar has strengthened to its highest level against the US dollar since June. Some of that is due to market perceptions that the RBNZ will hike rates sooner. But more recently we've also seen a weaker US dollar, as softer economic data in the US has led to speculation that the Federal Reserve could slow the pace of its rate hikes.
We should point out that the RBNZ's forecasts of near-term inflation are still on the low side (with a pickup in later years). But it's looking less likely that they will be grappling with upside surprises at their next review in February. And a softer US economy, lower fuel prices and a high New Zealand dollar would all make the RBNZ even less inclined to signal OCR hikes any time soon.
Data Previews
Aus Nov CoreLogic home value index
- Dec 3, Last: –0.5%, WBC f/c: –1.0%
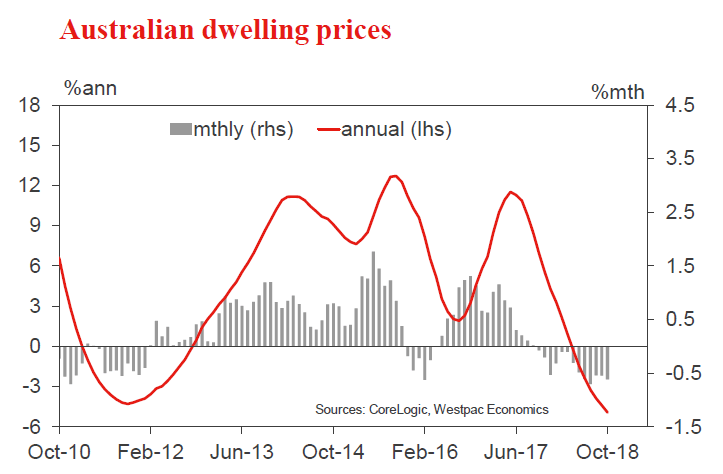
Australia's housing market continues to correct. The CoreLogic home value index fell 0.6% in October to be down 4.6%yr, revisions accentuating the annual decline. The correction continues to be more pronounced for the previously strong Sydney and Melbourne markets, with Perth's longer running adjustment continuing but prices stable across the other major capital cities.
November looks to have been an even weaker month, auction clearance rates dropping to previous cycle lows in Sydney and Melbourne. The daily index points to a 1.0% drop in prices nationally with the cumulative price adjustment across the five major capital cities now close to 6% since last September's peak.
Aus Oct dwelling approvals
- Dec 3, Last: 3.3%, WBC f/c: –3.0%
- Mkt f/c: -1.5%, Range: -4.0% to 3.0%
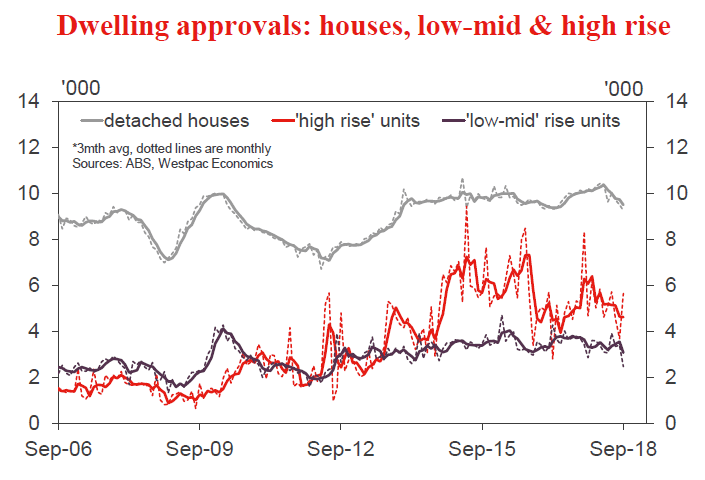
Dwelling approvals rose 3.3% in September, reversing part of the 13% slide over the previous two months. However, the detail was weak with the monthly gain centred on Victoria high rise units and approvals outside of this narrow state segment significantly weaker (our estimates suggest total dwelling approvals ex Victoria high rise were down about 7.5%mth).
The October update looks likely to show a fall with some risk that this may be sharp. Housing markets have weakened significantly since mid year. Site purchases continue to point to lower high rise activity while construction-related finance approvals suggest non-high activity will remain weak, stabilising at best. On balance, we expect a 3% decline in total approvals with risks skewed to the downside.
Aus Q3 company profits
- Dec 3, Last: 2.0%, WBC f/c: 1.3%
- Mkt f/c: 2.8%, Range: 1.0% to 4.0%
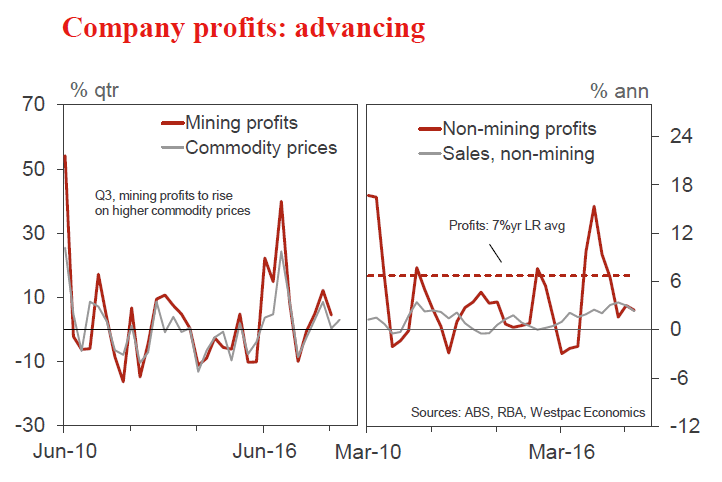
Companies are enjoying rising profits on the back of higher commodity prices and, over the past year, above trend economic growth.
In the June quarter, profits grew by 2.0%, including +4.4% for mining and +0.6% across the non-mining sectors.
For Q3, profits are forecast to rise by 1.3%.
Mining profits will likely be the source of strength, up by 3% or more, underpinned by a further lift in commodity prices.
Non-mining profits are expected to move a little higher, with the risk that results are mixed across industries. A negative is softer conditions for housing and retail, while other sectors such as manufacturing and potentially business services are likely to fare better.
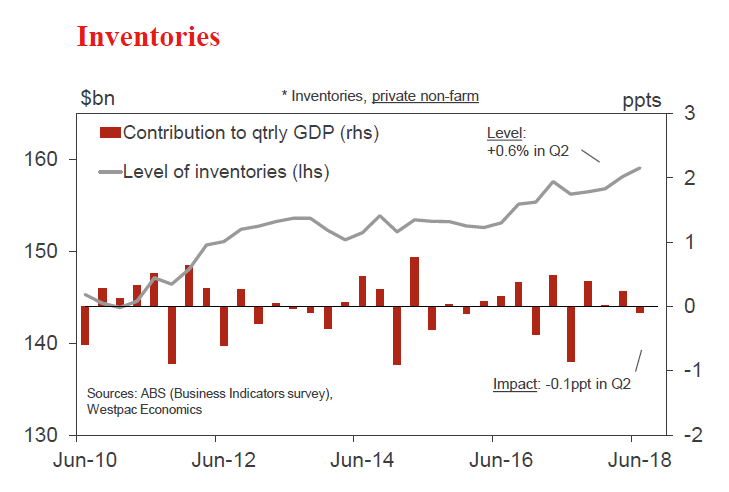
Aus Q3 inventories
- Dec 3, Last: 0.6%, WBC f/c: 0.5% (-0.1ppt)
- Mkt f/c: 0.4%, Range: -0.1% to 0.5%
Over the past year, inventories increased by a moderate 1.8% in response to rising domestic demand.
In the June quarter, inventories expanded by 0.6%, with a lift in mining (which more than outweighed a temporary dip in manufacturing) and with a 0.7% rise across other sectors.
For the September quarter, inventories are expected to expand further, albeit at a marginally slower pace, up a forecast 0.5%. Housing and consumer spending took on a softer tone in the quarter, weighing on the need to add to inventories.
This would see inventories make a very small subtraction from growth in Q3, in the order of -0.1ppt.
Aus Q3 net exports, ppt's cont'n
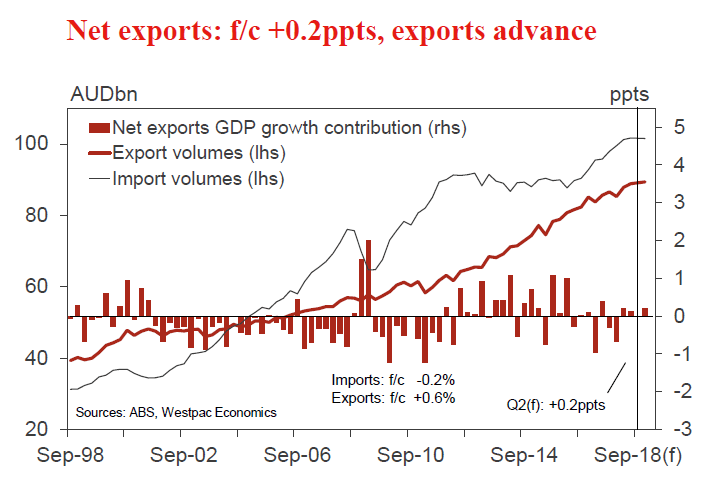
- Dec 4, Last: +0.1, WBC f/c: +0.2
- Mkt f/c: +0.3, Range: +0.1 to +0.5
Net exports were a surprisingly large drag on growth in 2017, -1.6ppts for the year. Imports accelerated, associated with a turnaround in business investment, and exports stumbled, stalling over the year.
Over the first half of 2018, net exports swung around to be a small positive for growth, +0.2ppts in Q1 and +0.1ppt in Q2. Exports have resumed their uptrend and imports advanced at a more modest pace.
For the September quarter, net exports added a forecast 0.2ppts to activity.
Exports grew by a forecast 0.6%, on services, manufacturing and LNG, while rural goods and iron ore declined.
Import volumes appear to have dipped in the quarter, down around 0.2%, including a decline in capital goods.
Aus Q3 current account, AUDbn
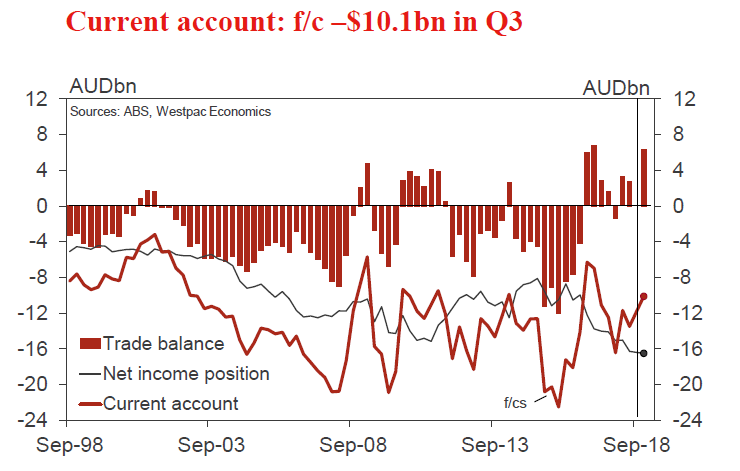
- Dec 4, Last: -13.5, WBC f/c: -10.1
- Mkt f/c: -10.2, Range: -12.2 to -9.9
Australia's current account deficit is relatively well contained currently, at 2.9% of GDP in the June quarter.
In the June quarter, the deficit was $13.5bn, with a trade surplus of $2.8bn (since upgraded to $4.2bn) and an income deficit of $16.3bn.
For the September quarter, the current account is set to narrow, improving to a deficit of $10.1bn.
Key to the improvement is a larger trade surplus, increasing to $6.4bn on higher export earnings. The terms of trade rose by 1.2%, we estimate, driven by commodity prices.
The net income deficit is expected to increase to $16.5bn, up sharply over the past two years from $10bn. Over this period, the deficit increased largely due to rising returns to foreign investors in the mining sector.
Aus Q3 public demand
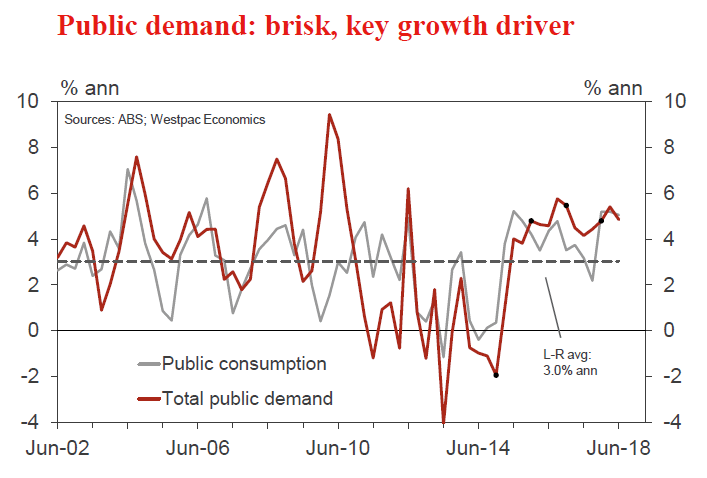
- Dec 4, Last: 0.6%, WBC f/c: 1.4%
The public sector - directly accounting for almost a quarter of the economy - is a key growth driver, expanding at a well above trend pace in 2015, 2016 and 2017, with annual growth at 4.8%, 5.5% and 4.8%, respectively. This brisk momentum has extended into 2018.
Public investment is trending sharply higher, off low levels, with a focus on long overdue transport projects. Health spending (included in 'consumption') is also moving higher at a brisk pace.
In the June quarter, total public demand grew by a more modest 0.6%, dented by a 1.3% fall in public investment.
For Q3 we anticipate a robust 1.4% rise in public demand, - although there are some downside risks given a dip in public construction work. Annual growth in public demand holds broadly steady at a brisk 4.7%.
Aus RBA policy announcement
- Dec 4, Last: 1.50%, WBC f/c: 1.50%
- Mkt f/c: 1.50%, Range: 1.50% to 1.50%
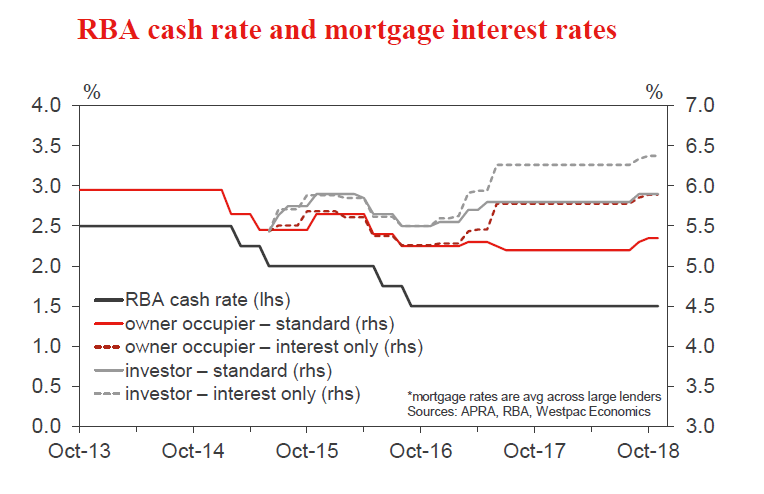
The Reserve Bank will leave interest rates unchanged at 1.50% at the December meeting. We continue to expect rates to be on hold throughout 2019 and 2020.
The last time official rates were lowered was August 2016 and the last RBA rate hike was November 2010. That said, macro-prudential measures have seen a tightening of lending conditions for housing, triggering a cooling of the sector following a strong upswing.
Notably, the correction in the housing market is occurring against the backdrop of a robust economy. Growth has been above trend and unemployment has fallen to a six year low.
The RBA expects further, but only gradual, progress in reducing unemployment and returning inflation towards the middle of the target band. A lift in wages growth, from the current sluggish pace, will be key to achieving a sustained lift in inflation.
Aus Q3 GDP
- Dec 5, Last: 0.9%qtr, 3.4%yr, WBC f/c: 0.7%qtr, 3.4%yr
- Mkt f/c: 0.6%, Range: 0.4% to 0.9%
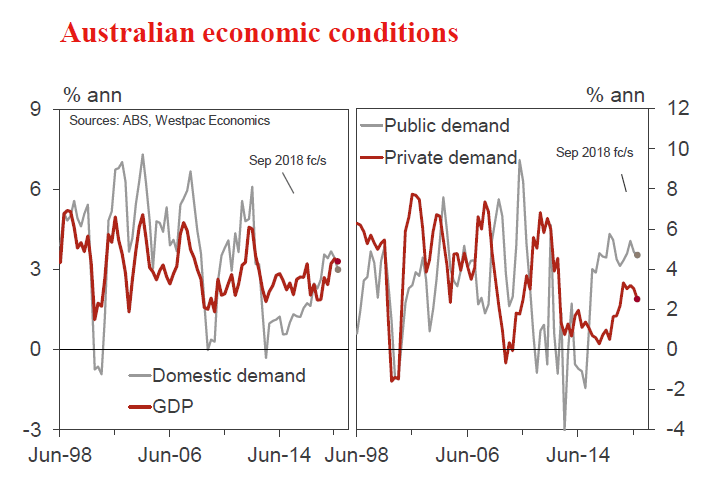
Australia's output performance surprised to the high side over the past year, at a well above trend 3.4%, including a 4.1% annualised pace over the first half of 2018.
For Q3, momentum eased back to around a trend pace, at a forecast 0.7%qtr - albeit with risks tilted to the downside. That leaves annual growth at 3.4% (subject to revisions).
Key to some slowing between Q2 and Q3 is the cooling of the housing sector, both prices and activity, as well as an ongoing choppy profile for consumer spending.
The arithmetic of our GDP forecast is: domestic demand 0.5%; net exports, +0.2ppts and inventories a very small negative, rounding up to -0.1ppts. Labour conditions were robust in Q3, employment +0.7%, evidence that the economy still had solid momentum.
Aus Oct retail trade
- Dec 6, Last: 0.2%, WBC f/c: 0.1%
- Mkt f/c: 0.3%, Range: 0.0% to 0.5%
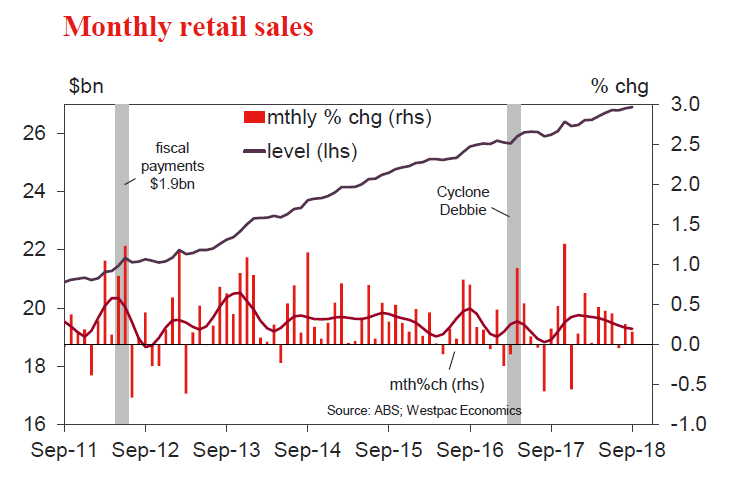
September retail sales were on the soft side, rising 0.2% in the month, holding annual growth at 3.7%yr. Sales have been tracking closer to a 3.3% annual pace over the last six months. The detail showed gains in the month concentrated in food categories (up 0.5% on a combined basis) with non food retail declining 0.2%mth.
Indicators have been mixed in October. Consumer sentiment lifted a little to be slightly above average. Private business surveys showed soft readings amongst retail responses to the NAB survey but a lift in the AiG PSI. Anecdotal reports have tended to be on the soft side. Weakening housing markets may also be starting to affect demand with vehicle sales suggesting spending on big ticket discretionary items has weakened (although this may also be due to changes to vehicle finance). On balance, we expect October to show a subdued 0.1% gain taking annual growth to 3.3%yr.
Aus Oct trade balance, AUDbn
- Dec 6, Last: 3.0, WBC f/c: 3.5
- Mkt f/c: 3.0, Range: 2.0 to 3.7
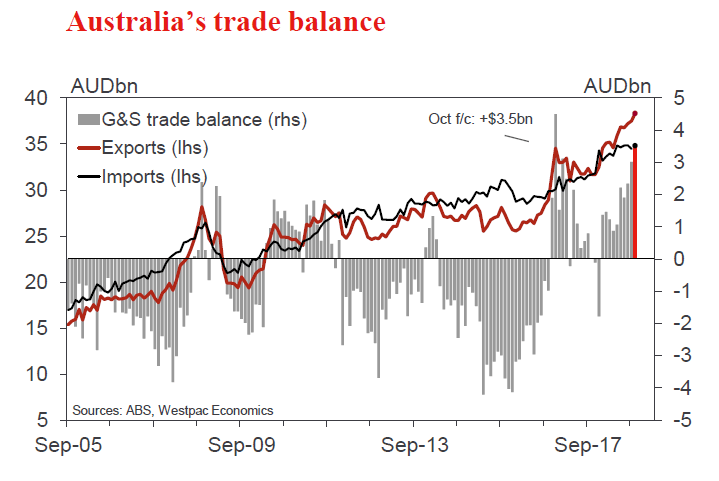
Australia's trade account has been in surplus every month so far in 2018.
In September, the surplus climbed to $3.0bn.
For October, we expect the surplus to rise higher, to $3.5bn, the largest surplus since the end of 2016.
Export earnings are up a forecast 2.2%, +$0.8bn. Key is a rebound in coal volumes from the supply disruptions of the past couple of months. Commodity prices were also higher in the month.
The import bill is forecast to rise by around 1.0%, +$0.3bn. Volumes are expected to resume their uptrend, emerging from the softness of Q3, while prices are higher associated with rising global energy prices and a lower dollar (down 1.4% against the US dollar to 71¢ in October).
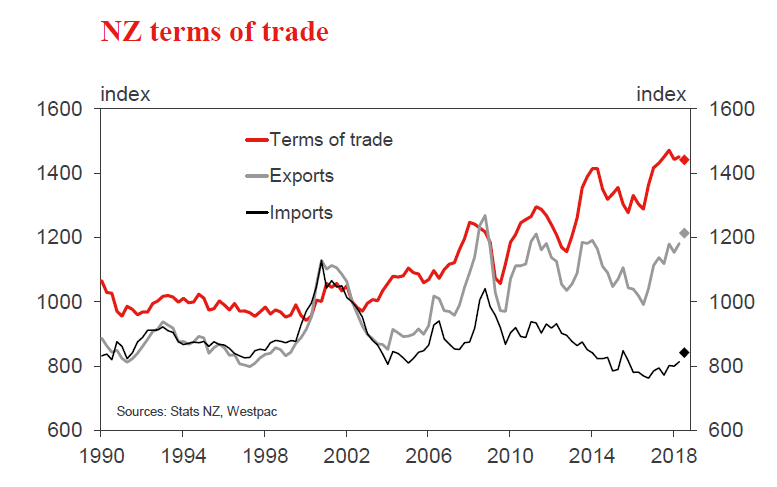
NZ Q3 terms of trade
- Dec 3, Last: +0.6%, WBC f/c: -0.7%, Mkt f/c: 0.2%
New Zealand's terms of trade have edged back slightly after reaching an all-time high in 2017. We expect a 0.7% drop for the September quarter, unwinding the 0.6% rise in the June quarter.
We expect a 2.7% rise in export prices overall, led by a 7% rise in dairy prices. Other commodity exports saw modest price gains, largely as a result of the lower New Zealand dollar over the quarter.
The rise in dairy export prices is likely to be outweighed by a 14% surge in oil import prices. We also expect small price gains for other imports (mostly manufactured goods), again due to the lower exchange rate.
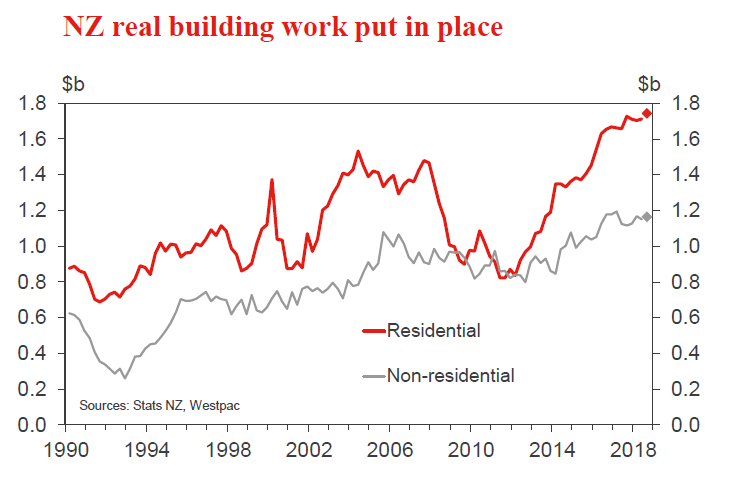
NZ Q3 building work put in place
- Dec 5, Last 0.8%, Westpac f/c: +2.3%, Mkt f/c: 2.3%
Building activity rose by 0.8% in the June quarter, reversing the small drop in the previous quarter. Underlying this rise was a 1.2% increase in non- residential activity, as well as a 0.5% increase in residential construction.
We're expecting a 2.3% increase in overall building activity in the September quarter, supported by gains in both residential and non-residential building. On the residential front, we expect building levels to increase by 1.8% in September with gains centred on Auckland. That follows a large pickup in dwelling consent issuance in the region over the past year. This is helping to offset the continued softening in Canterbury, while conditions in other regions remain firm. We also expect a 3% increase in non- residential construction, with increases spread across the retail, industrial and accommodation sectors. Public sector building work is also increasing slowly.
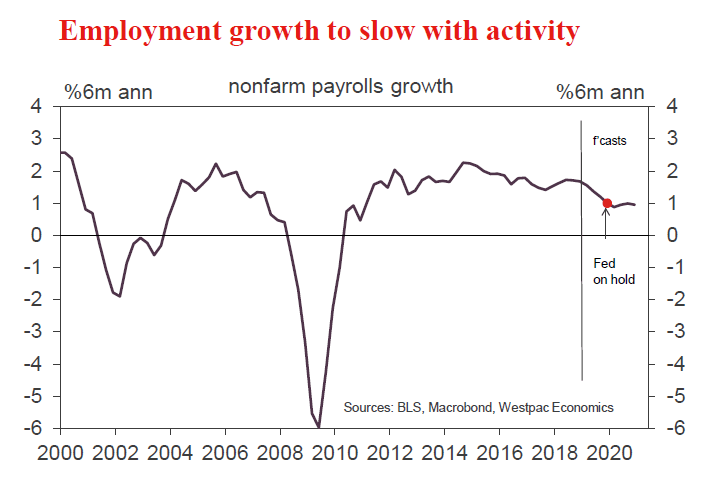
US Nov employment report
- Dec 7, nonfarm payrolls, last 250k, WBC 200k
- Dec 7, unemployment rate, last 3.7%, WBC 3.7%
- Dec 7, hourly earnings %yr, last 3.1%, WBC 3.2%
The average monthly gain for nonfarm payrolls has been very steady this year. On a 3 and 6 month basis, and for the year to date, the month-average pace is 218k, 216k and 213k respectively. All of these outcomes are well above the pace necessary to keep the unemployment rate unchanged, indicating demand for labour remains strong.
This strength in employment will see downward pressure remain on the unemployment rate, though the next step lower is more likely in a few months time than November.
Hourly earnings have been picking up momentum over the past year and, given full employment, this is expected to continue. An annual rate a little above 3.0%yr is expected near term, before a further firming to circa 3.5% mid-2019.
Weekly Focus – Growth Weakness ahead of Trade Talks
Market Movers ahead
The meeting between Donald Trump and Xi Jinping this weekend could be a turning point in the trade war and there is a good chance of a deal despite more sabre rattling this week.
Markets have reacted strongly to Fed Chair Jerome Powell's words this week and next week he is due to testify in Congress. The jobs report is likely to confirm that wage growth is strong in the US.
We also expect data to show increasing wage growth in the euro area in Q3.
There is a high risk that the Chinese Caixin PMI will drop below 50.
In Norway, the important regional network survey should still point to growth above trend, while there is a considerable risk of weaker growth indicators from Sweden.
Weekly wrap-up
There is considerable doubt about whether the Brexit deal will pass in the British parliament and what will happen if it does not.
Weak macro data in Europe helped push oil below USD60.
The Italian government showed signs of yielding to pressure from the markets and the EU to tighten fiscal policy plans.
Swedish GDP declined 0.2% in Q3 due to temporary factors but also with underlying weakness. Indicators for Q4 do not look too promising either.
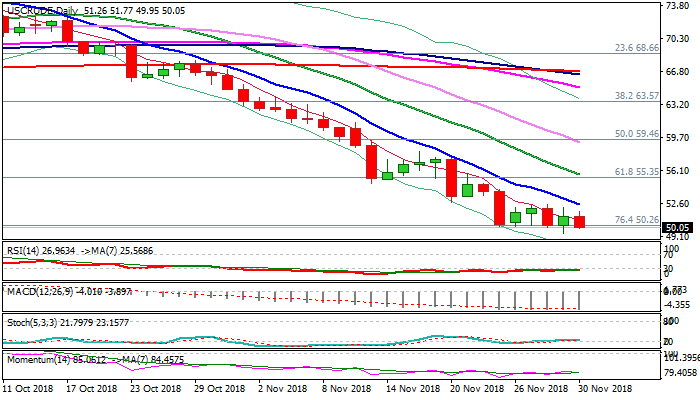
WTI OIL Outlook: Extended Consolidation Awaits for a Catalyst to Establish in Fresh Direction
WTI oil stands at the back foot on Friday but holding above psychological $50 support, which was cracked on Thursday's dip to $49.40.
Failure to eventually close below $50 trigger, kept the price in extended consolidation during this week.
Long-legged Doji is forming on weekly chart and supports signals of strong hesitation at $50 level and directionless mode on mixed key fundamentals.
Oil was in for seven straight weeks steep downtrend, which started showing initial signs of fatigue.
Strong signs of global oversupply and projections for lower global demand in 2019, kept oil price under strong pressure, with fears of further weakness on escalation of trade conflict.
On the other side, signals that OPEC and Russia may reduce an output, with today's signals that Russia would back the agreement, adding to positive signals. The upside was so far capped by broken 200WMA ($52.30) with sustained break above needed to generate stronger bullish signal. An outcome of G20 summit during the weekend is expected to provide stronger direction signal.
Res: 50.87; 51.77; 52.30; 52.53
Sup: 50.00; 49.40; 49.10; 48.58
Sunset Market Commentary
Markets
Global core bond trading was mainly driven by investor sentiment. Investor caution prevailed in the run-up to the long-awaited meeting Trump-Xi meeting. If anything, the eco news flow should be considered as bond supportive with the Italian Q3 GDP downwardly revised into contraction territory. EMU core inflation also slightly missed market expectations as core inflation eased from 1.1% to 1.0% in November. So, at least for now, there is no reason for markets to front-run on any ECB policy tightening. The German yield curve bull flattens with 10/30-yr yields declining 1.2 bps. German bunds still slightly underperform US Treasuries despite soft eco data, probably as the 10-y German yield is nearing key support in the 0.30% area. US yields are declining up to 2 bps with the 10-yr slightly outperforming. Intra-EMU 10-yr yield spread changes versus German bunds are negligible.
The dollar traded with a tentative positive bias today. The repricing after Wednesday’s perceived soft comments from Fed chairman Powell has apparently run its course. Global (equity) markets apparently took a cautious approach ahead of tomorrow’s meeting between US president Trump and Chinese president Xi Jinping. This investor caution slightly favours the dollar. On the euro side of the equation, a slightly softer than expected EMU November (core) CPI also dampened investors’ appetite to build on the post-Powell EUR/USD rebound. The pair lost slightly ground after the CPI release. The dollar also profited from a strong Chicago PMI. EUR/USD trades currently in the 1.1350 area. The yen again doesn’t profit from global investors caution. USD/JPY follows the broader intraday USD rebound. The pair trades in the 113.55 area.
EUR/GBP basically hovered sideways today in a relatively tight range in the 0.89 area. EUR/GBP revised stop highs in the 0.8920/25 area, but a real test of the 0.8940 resistance didn’t occur. Trade Secretary William Fox supported his PM and asked party members to support the Brexit deal. However, sterling traders clearly didn’t see this as meaningful factors in solving the Brexit stalemate. EUR/GBP is trading close the 0.89 pivot. Cable (1.2770 area) is losing a few ticks, but this is a USD move rather than a sterling move.
News Headlines
Eurozone headline inflation slowed in November to 2.0% from 2.2%, as expected, as the rise in energy prices and unprocessed food eased. However, the core inflation also unexpectedly declined from 1.1% to 1.0%. So, for now, the jury is still out whether inflation will accelerate toward the 2% target as the ECB prepares to reduce monetary stimulus.
Italian GDP contracted (0.1% Q/Q) in Q3, the first quarterly decline since Q2 2014. Y/Y-growth was also downwardly revised from 0.8% Y/Y to 0.7% Y/Y. Weak consumer spending and investments were to blame for the poor growth performance.
India’s Q3 growth slowed in the July-September period from 8.2% Y/Y to 7.1% Y/Y. The market expected a more modest slowdown (7.5% Y/Y). With growth slowing down, the RBI is expected to hold its policy rate unchanged at 6.50-à)) after tightening policy earlier this year as inflation is also slowing down.
Canadian Q3 GDP Growth Slows
Highlights:
- Canadian Q3/18 GDP growth slowed as expected to 2.0% from 2.9% in Q2 though with a much weaker composition of output indicating flat final domestic demand and most of the growth coming falling imports, which enter the GDP add-up with a negative sign, boosting net exports.
- Income details from the quarterly GDP add-up left our tracking of the Bank of Canada’s ‘wage-common’ measure at 2.5%, slightly higher than the 2.4% we were previously tracking.
Our Take:
Canadian Q3 GDP growth moderated as expected to 2.0% from the 2.9% gain recorded in Q2 though with the details suggesting a further slowing in Q4. Over the first three quarters of this year quarterly growth has averaged 2.2% which is down from the 3.0% annual growth recorded in 2017. With that earlier above-average growth pushing the economy to its capacity limit, the moderation to date this year closer to the economy’s long-run average, or potential, rate of 1.8% is what the Bank of Canada is striving to achieve. However, the details in today’s report are indicative of growth likely slowing further in Q4 closer to a 1% rate. This was in part conveyed by a disappointingly weak composition of Q3 GDP output with business investment unexpectedly declining by a sizeable 7.1%, reportedly weighed down by softer oil & gas investment. Though residential investment was expected to decline, the reported 5.9% drop in Q3 was larger than expected. Similarly the slowing in consumer spending to 1.2% was greater than anticipated. Equally disappointing was the monthly GDP detail which indicated Q3 ended on a weaker-than-expected note dropping 0.1% with broad-based declines among all major goods-producing sectors. The projected further weakening in Q4 will be abetted by the transitory downward impact from the recent postal strike. As well, the slump in oil prices could weigh on activity as well though with the duration a function of how long the slump persists. These developments imply a clear downside risk to the Bank of Canada’s current forecast of Q4 growth bouncing back to 2.3%. Our expectation is that the central bank is still likely to move the current overnight rate of 1.75% to within its estimate of ‘neutral’ within a range of 2.50% to 3.50%. However, such will be dependent on indications that any slowing in Q4 proves transitory.
USD/JPY Mid-Day Outlook
Daily Pivots: (S1) 113.22; (P) 113.45; (R1) 113.72; More..
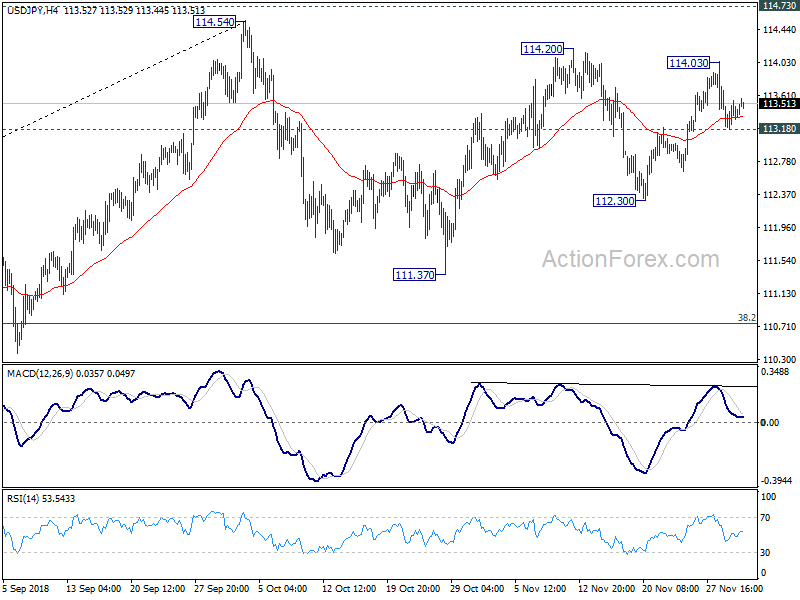
Intraday bias in USD/JPY is turned neutral as it recovers after hitting 4 hour 55 EMA. On the downside, below 113.18 will target 112.30 support first. Break there will target 111.37 and possibly below. On the upside, above 114.03 will target a test on 114.54/73 key resistance zone. Overall, price actions from 114.54 are seen as a consolidation pattern. Hence, even in case of deep decline, downside should be contained by 38.2% retracement of 104.62 to 114.54 at 110.75 to bring rebound.
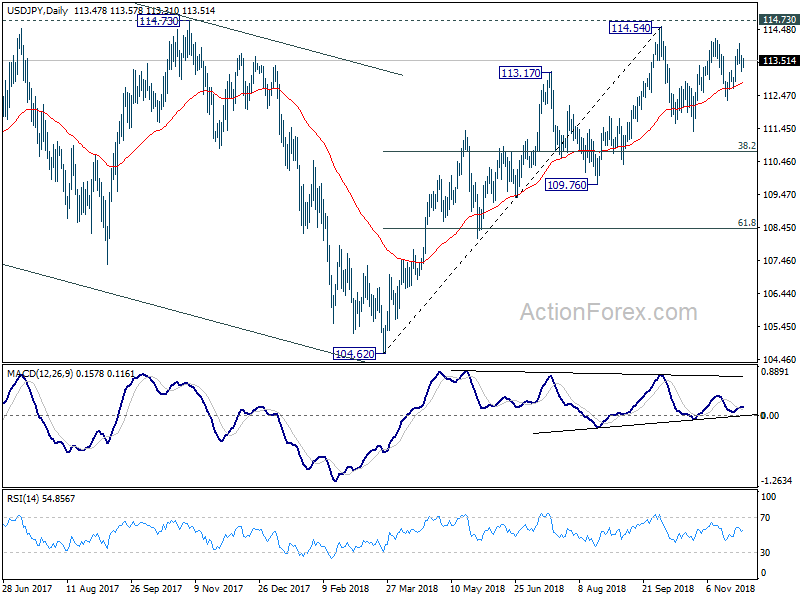
In the bigger picture, corrective fall from 118.65 (2016 high) should have completed with three waves down to 104.62. Decisive break of 114.73 resistance will likely resume whole rally from 98.97 (2016 low) to 100% projection of 98.97 to 118.65 from 104.62 at 124.30, which is reasonably close to 125.85 (2015 high). This will stay as the preferred case as long as 109.76 support holds. However, decisive break of 109.76 will dampen this bullish view and turns outlook mixed again.
USD/CHF Mid-Day Outlook
Daily Pivots: (S1) 0.9926; (P) 0.9951; (R1) 0.9986; More...
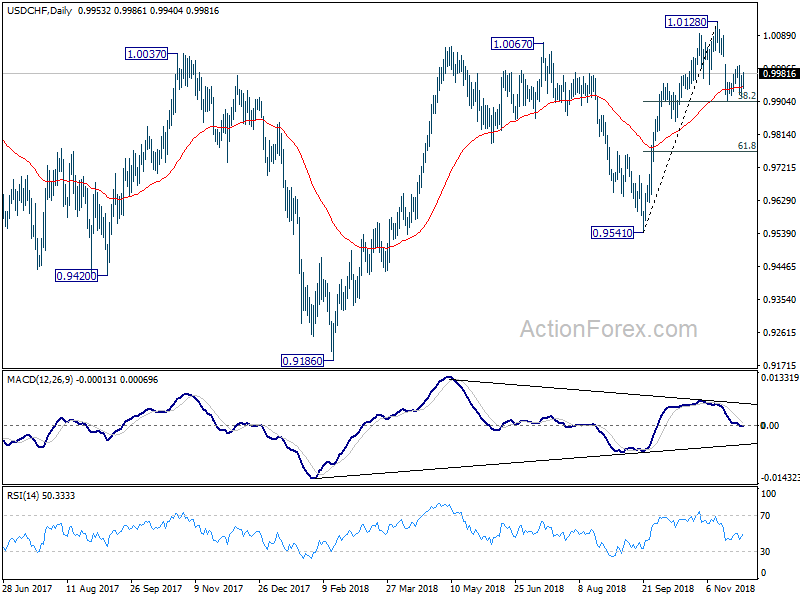
Intraday bias in USD/CHF remains neutral at this point. On the downside, break of 38.2% retracement of 0.9541 to 1.0128 at 0.9904 will resume the fall from 1.0128 to 0.9848 key support level. Break there will indicate near term reversal and target 61.8% at 0.9765. On the upside, break of 1.0006 will argue that the pull back from 1.0128 has completed. Intraday bias will be turned back to the upside for retesting 1.1028.
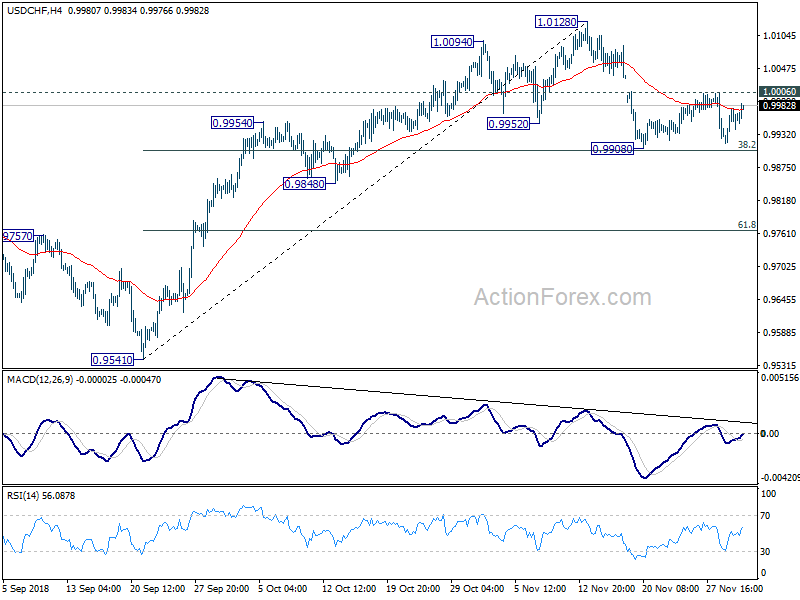
In the bigger picture, rise from 0.9541 could have topped at 1.0128. But as long as 0.9541 support holds, we'd still expect rise from 0.9186 to resume at a later stage. Break of 1.0128 will target 1.0342 key resistance. However, break of 0.9514 will pave the way back to 0.9186 low.