Sample Category Title
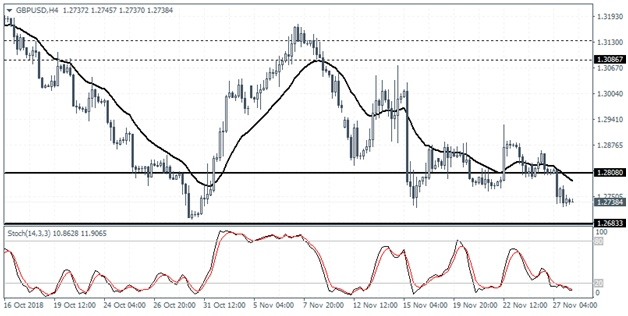
GBPUSD Intraday Analysis
GBPUSD (1.2738): The British pound finally gave way near the support level of 1.2808 as prices slipped lower back into the major support area. We expect the declines could push the pound sterling down to the 1.2683 level of lower support. In the near term, however, price action could turn rather flat. Any reversal in price action could be seen retesting the 1.2808 level where resistance could be established.
EURUSD Intraday Analysis
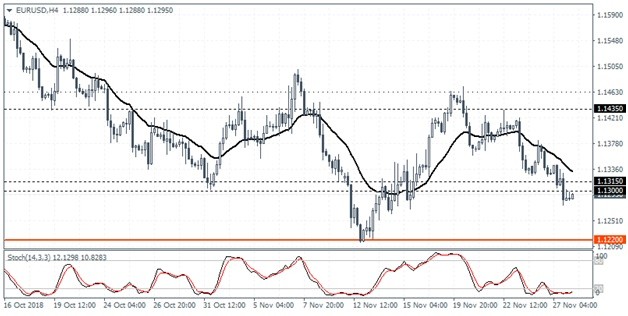
EURUSD (1.1295): The EURUSD currency pair posted declines with price action seen falling back to the support area of 1.1315 - 1.1300. A brief decline drop this level has seen the common currency clearing the support level. This could potentially expose the lows of 1.2200 that was tested in early November. The declines could stall at this level in the near term as the common currency could establish a new range. If the EURUSD manages to break past the current support area, we expect the sideways consolidation to continue.
U.S. Third Quarter GDP Expected To Be Revised Slightly Higher To 3.6%
The U.S. dollar was seen rallying to previously established highs from just a few weeks ago. The strong rally in the USD sent most of its peers back to their lows. Economic data from the Eurozone was relatively quiet for the most part.
The NY trading session saw the National House Price index falling for the sixth consecutive month. Reports showed that housing prices rose 5.5% on an annualized basis in September. This was weaker than the 5.7% increase registered in August.
The weaker NHPI report echoes similar views as existing home sales; housing starts fell sharply in September. The declines were attributed to the higher costs for borrowing.
The Fed vice chair, Richard Clarida was speaking yesterday. He supported the Fed’s view for gradual rate hikes noting that it was appropriate for interest rates to rise as it moves closer to its optimal setting.
Looking ahead, the markets seem to a somewhat busy day today. In the overnight trading session, the RBNZ Governor Orr was speaking. The RBNZ head said that the central bank would ease lending restrictions from January next year while requiring higher capital requirements for banks.
The European session will see the release of the German Gfk consumer climate. Economists forecast the consumer climate to ease to 10.5 from 10.6. Meanwhile, in the NY trading session the, second revised GDP estimates will be coming out. There is an expectation for the third quarter GDP to be revised slightly higher to 3.6% from the initial estimates which showed a 3.5% increase.
The GDP report is later followed by the new home sales report which is expected to rise to 583k on a seasonally adjusted basis. The Richmond Fed manufacturing index is expected to edge higher to 16 from 15 previously.
Wrapping up the day, Fed Chair, Jerome Powell is expected to speak late in the evening.
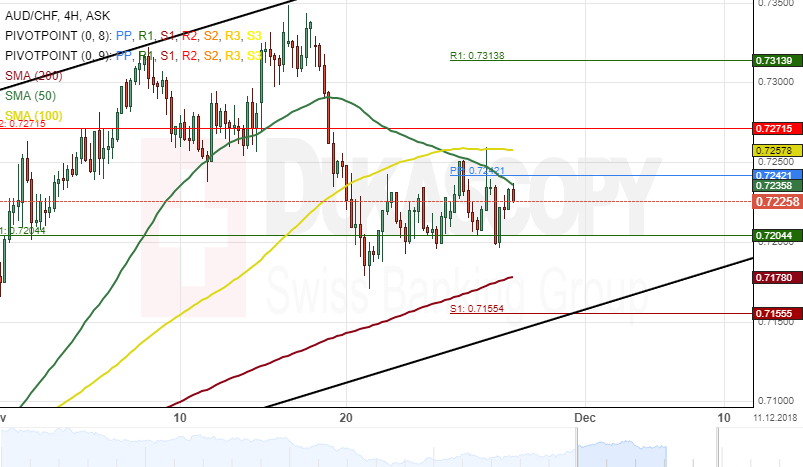
AUD/CHF 4H Chart: Short-Term Decline Expected
The Australian Dollar has been appreciating in a medium-term ascending channel pattern against the Swiss Franc. This increased in price range began when the currency pair reversed from the lower boundary of a dominant descending channel at 0.6858.
The exchange rate tested a resistance cluster formed by the weekly PP and the combination of the 50– and 100-hour SMAs at 0.7237 during Wednesday's morning hours. The common scenario would be a decline towards the lower boundary of the medium-term ascending channel at 0.7155.
However, a support level set by the 200-hour simple moving average at 0.7177 could prevent the price from hitting target today.
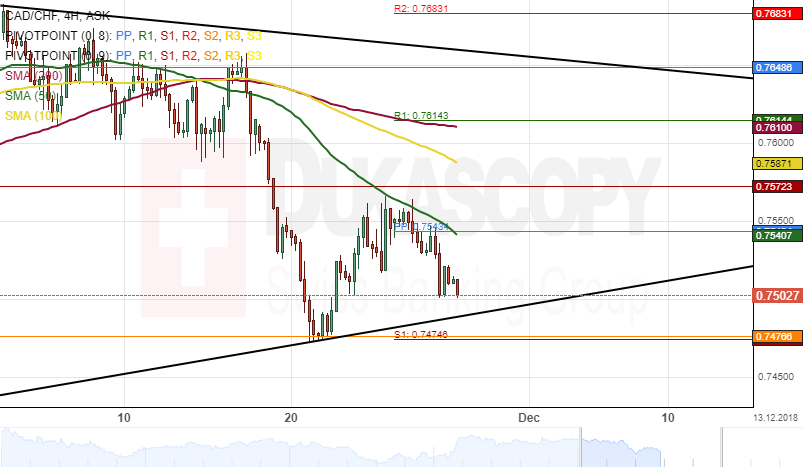
CAD/CHF 4H Chart: Triangle Pattern
The Canadian Dollar has been depreciating massively against the Swiss Franc since the middle of November. The decline has been bounded by a triangle-like formation pattern.
Assuming that this triangle pattern is to hold intact for a couple of sessions, the Canadian Dollar should gain momentum and aim for its upper boundary near the 0.7648 region.
However, technical indicators suggest that the assumptions might not occur during the following trading session.
Technical sentiment demonstrates that a decline towards a support cluster at 0.7474 is likely today.
US Dollar Pauses Ahead Of Key Fed Chair Speech
The US dollar was largely unmoved overnight after the US President continued to criticize the Federal Reserve and the Chairman he selected. In an interview with Washington Post, the President said that he was ‘not even a little bit happy’ with Jerome Powell and the Fed in general slating the recent rate hikes. Under his presidency, the Fed has hiked rates six times and is expected to do the same in December. Today, traders will look forward to Powell’s statement at the economic club of New York. They will also focus on housing market data and the second preliminary reading of the second quarter GDP.
Larry Kudlow, Trump’s top economic advisor talked to reporters at the White House about the upcoming meeting between the US President and China’s Xi Jinping. In the interview, he raised the possibility of a breakthrough in the talks that will happen on Saturday night. His interview came a day after the president told the Wall Street Journal (WSJ) that he believed he was unlikely to suspend the proposed $261 billion tariffs that are expected to go into effect in January. According to WSJ, Chinese officials have complained about the proposed tariffs and said that they won’t negotiate under threats.
The price of crude oil remained at session lows after data from the American Petroleum Institute (API) showed a significant rise in inventories. Over the past week, oil stocks rose to 3.45 million barrels, which was higher than last week’s drawdown of 1.54 million barrels. This data was released ahead of the official government data on inventories. Later today, the EIA’s data is expected to show an increase of inventories by 0.769 million barrels, which will be lower than last week’s increase of 4.85 million barrels. Oil investors are also cautious ahead of the G20 meeting this week and OPEC’s meeting the following week.
EUR/USD
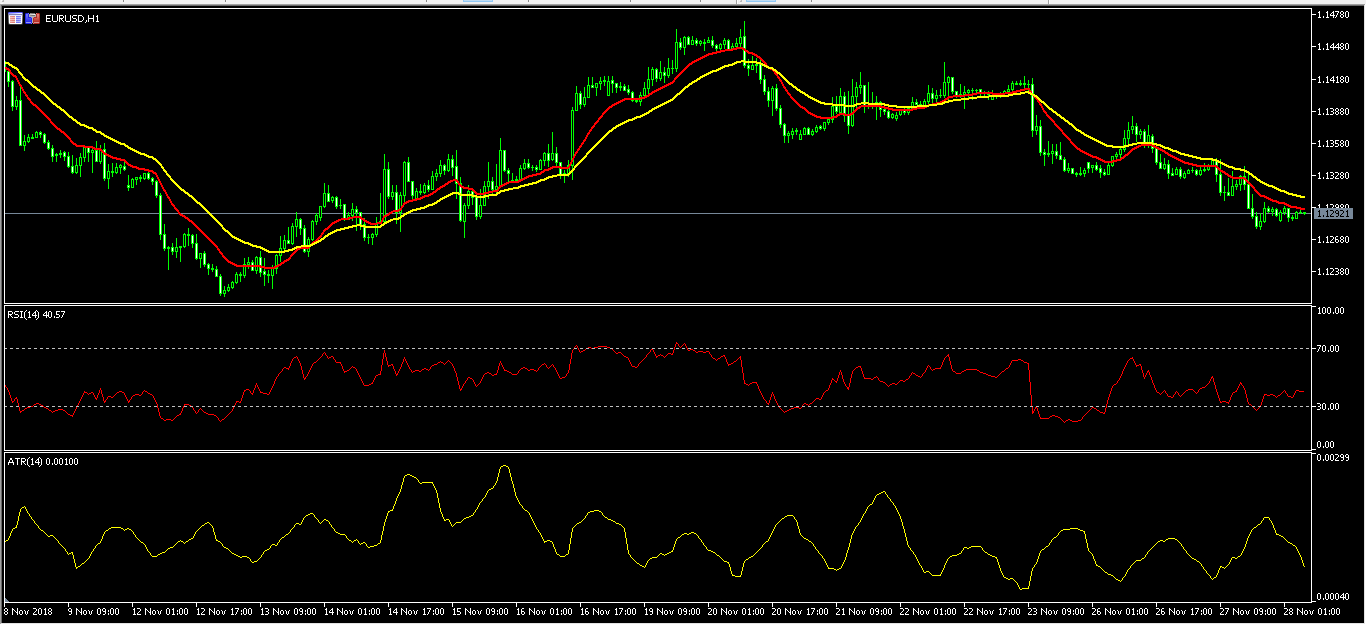
The EUR/USD pair was unmoved in overnight trading as traders waited for US GDP numbers. As of this writing, the pair is trading at 1.1290, which is close to the lowest level since November 16. This week, it has continued with a downward trend that was started on Tuesday last week. The 15-day and 30-day EMA on the hourly chart show that the pair could continue the downward trend. The overnight pause has led to reduced volatility in the pair as shown by the Average True Range indicator below. With no major data expected from the EU today, focus will be on the United States, which will release the GDP and housing data.
XBR/USD
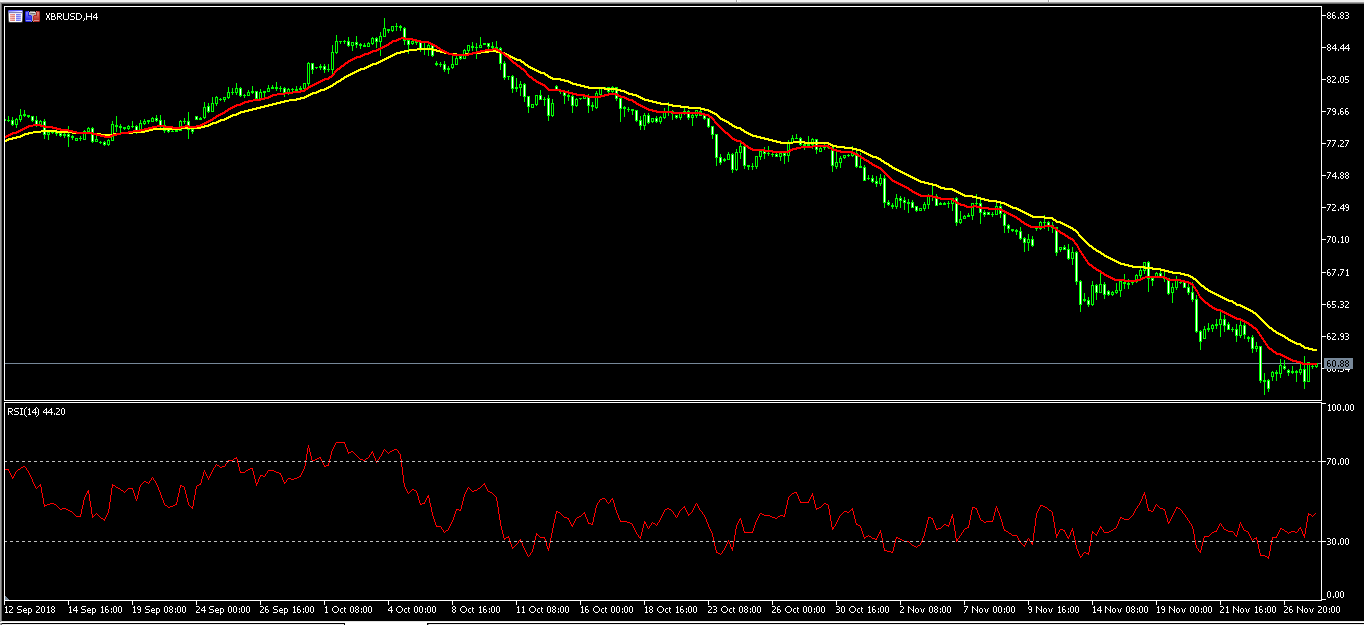
The price of crude oil was unchanged in overnight trading even after the API inventory data. The XBR/USD pair is trading at 60.80, which is close to the yearly low of 58.65. The double EMA show that the pair could have reached a bottom as the 15-day EMA try to cross the 30-day EMA on the four-hour chart below. This could be the case because of the upcoming OPEC and G20 meetings.
GBP/USD
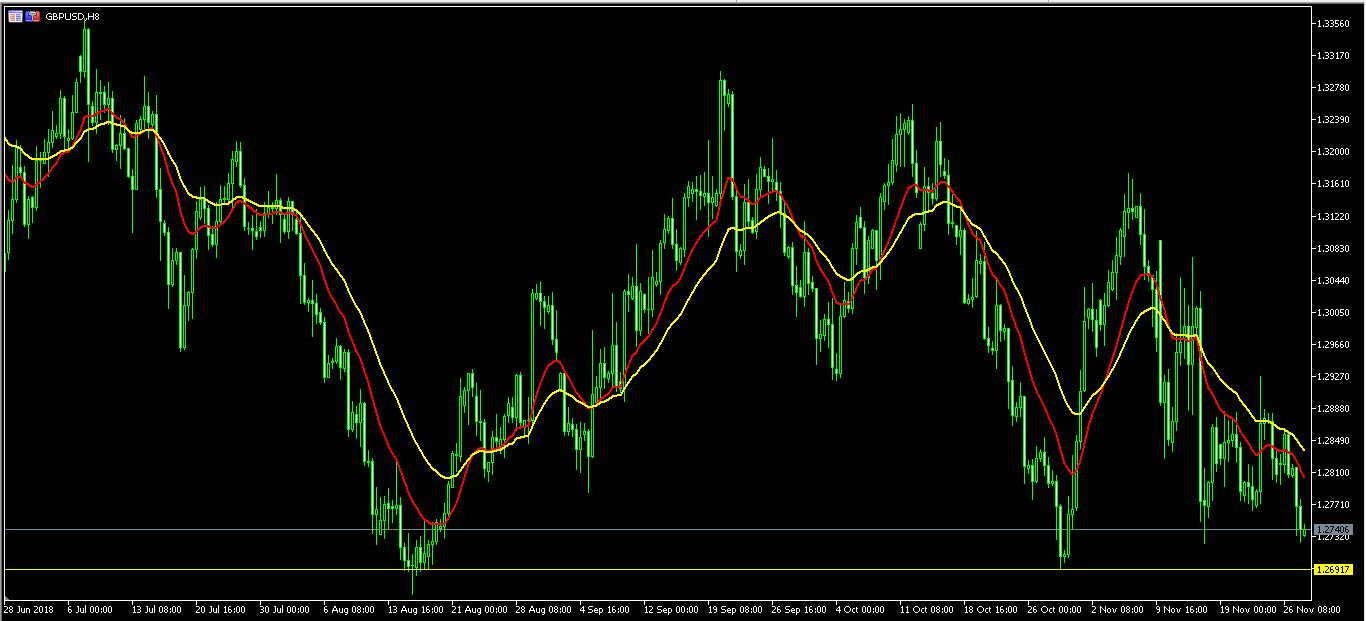
The volatility in the GBP/USD pair has continued as traders take time to analyze the odds of a no-Brexit deal. This has made the pair make some extreme upward and downward swings as shown in the eight-hour chart below. In the past two days, the 15-day and 30-day EMA have pointed to a continued downward trend. This could continue as the pair tries to test the important support of 1.2690. However, because of the news that could arise on Brexit, the pair will likely have more swings.
Spotlight On Reasons Behind Crypto Volatility
The price of Ethereum jumped overnight as traders started to buy cryptocurrencies in the lows. Other cryptocurrencies too like Bitcoin and Ripple jumped by more than 4%.
Even with the rally, the price of cryptocurrencies has been battered over the past week. It all started with the forking of Bitcoin Cash, a currency that was derived from Bitcoin in 2017. The creation of a new currency led many to believe that digital assets held little value if a new crypto could crop up so easily.
The focus within the crypto sphere has very much been on how ‘bubbles’ begin and how they burst. Such trends have been observed for hundreds of years. In the Netherlands during the 17th century, people bought tulips in what was known as tulip mania. People believed that tulips had a lot of value, until the price dropped and they lost money. In the 90s, after technology companies saw increased success, Wall Street investors started throwing money at any dot-com-related company. This led to a massive overvaluation of many companies that had no reasonable sales. Ultimately, the bubble burst and investors lost a lot of money.
This is likely what happened in the cryptocurrencies market. Since the release of Bitcoin, the ease of creating new cryptocurrencies had led to the industry being oversaturated. It also led to the creation of many currencies that had no value. A good example of this was the Useless Coin that raised more than $35000 despite telling investors the following:
You're going to give some random person on the internet money, and they're going to take it and go buy stuff with it. Probably electronics, to be honest. Maybe even a big-screen television. Seriously, don't buy these tokens.
In 2017, as the price of cryptocurrencies rose, people from around the world started to invest in them. They did this not because of the value they were buying but because they were afraid of missing out. This pushed the price of ETH to more than $1300 and Bitcoin to almost $20K. As the price started to drop, the same investors started to sell their coins, which has pushed their prices lower.
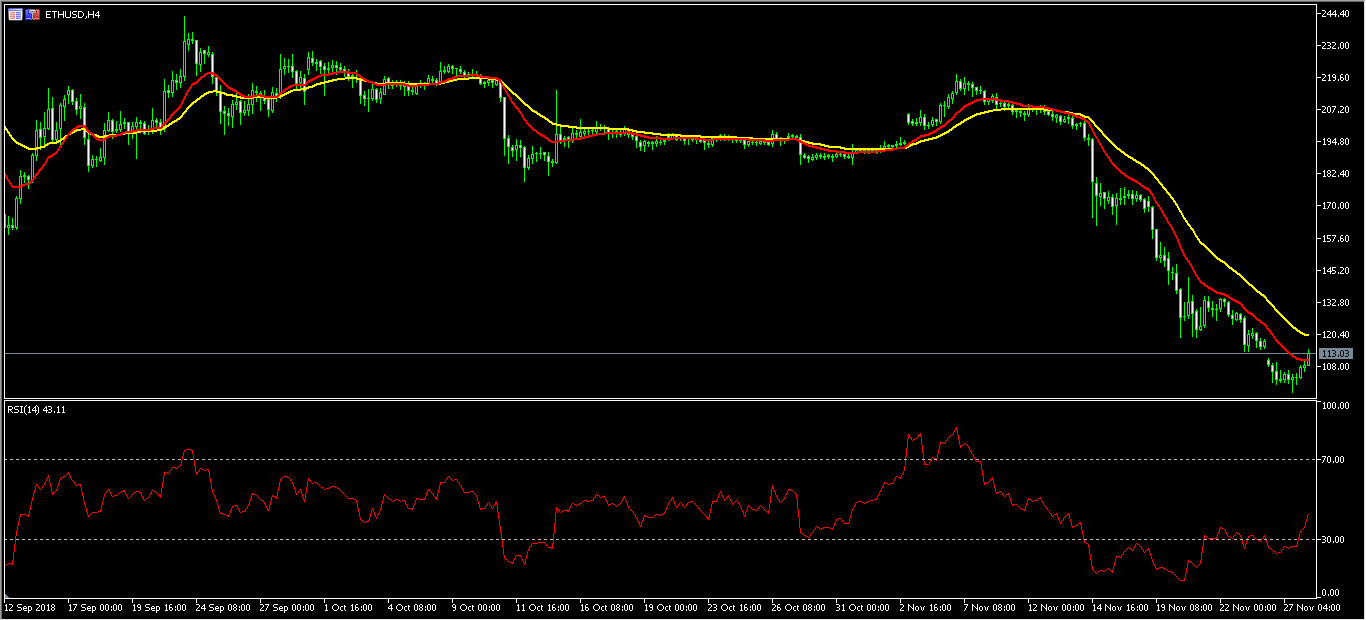
As of this writing, the ETH/USD pair has risen to 114. This is higher than the weekly low of 97. The RSI has moved from 7 to 44. The double EMAs appear to be cooling down, with the 15-day EMA starting to cross the 30-day EMA. In the short term, the pair could see a relief rally. However, in the medium-term, the weak sentiment will likely see the pair continue the downward trend.
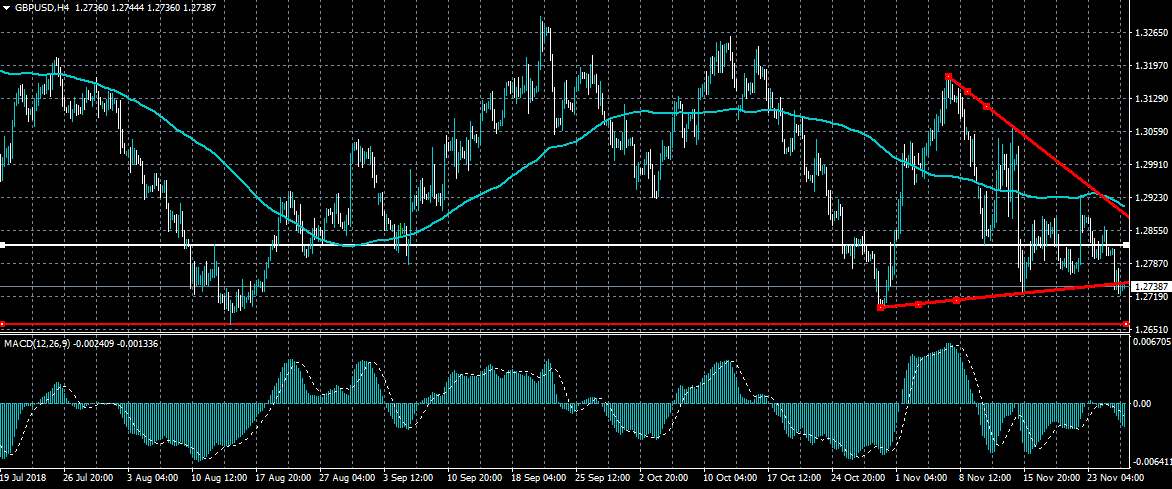
GBPUSD Heavy Losses Expected Below 1.2740
The British pound has continued to slump lower against the US dollar in early Wednesday trade, with price now trading below key trendline support. Sterling risks heavy technical selling while trading below the 1.2740 level, while the pair is also approaching the neckline of a bearish head and shoulders pattern. Only a move above the 1.2882 resistance level can negate short-term selling pressures on the GBPUSD pair.
The GBPUSD pair is strongly bearish while trading below the 1.2740 level, key technical support is found at the 1.2695 and 1.2662 levels.
If the GBPUSD pair trades above the 1.2800 level, key resistance is found at the 1.2882 and 1.2900 levels.
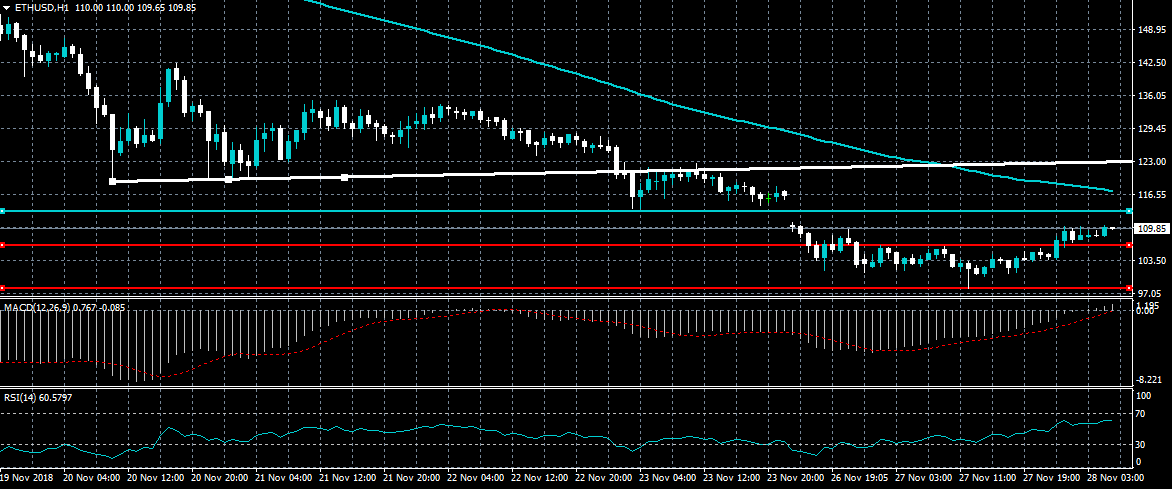
ETHUSD Finds Buying Demand Below $100.00
Ethereum is recovering towards the $110.00 level in early Wednesday trade, after finding strong dip-buying demand below the psychological $100.00 level. The MACD and RSI indicators on the one-hour time frame are also signalling that short-term bullish momentum is building. A sustained move below the $106.00 level may prompt another technical test of the $97.60 support level.
The ETHUSD pair is only bullish while trading above the $113.00 level, key resistance is found at the $117.00 and $123.00 levels.
If the ETHUSD pair trades below the $106.00 level, sellers are likely to test towards the $100.00 and $97.60 support levels
EURUSD Strongly Bearish Below 1.1300
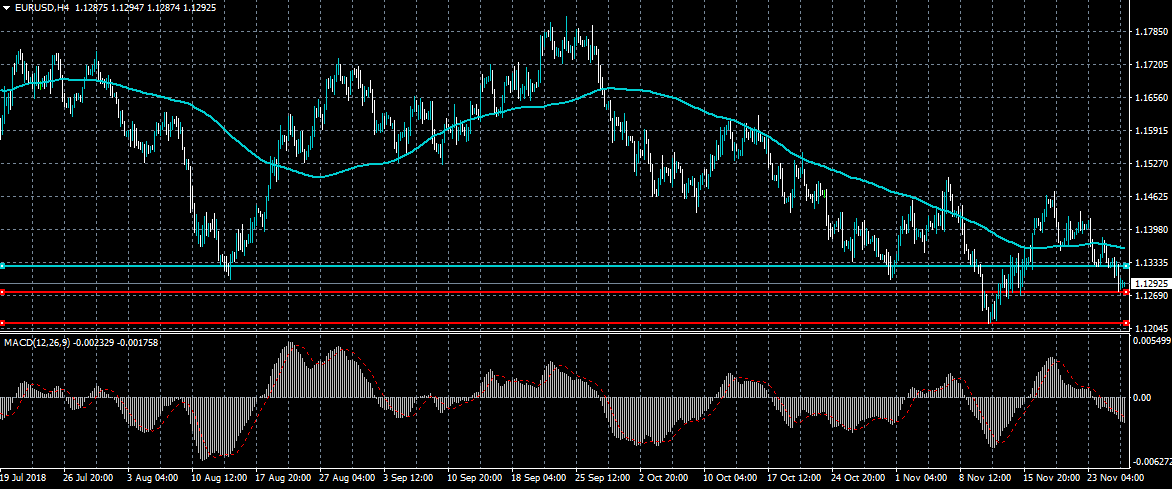
The euro currency is trading below the important 1.1300 level against the US dollar after key Federal Reserve members Evans and George called for further US interest rates hikes. Bearish pressures are continuing to build on the EURUSD, with the pair strongly intraday bearish while trading below the 1.1300 level. A breach of the 1.1216 support level is likely to spark heavy technical selling in the EURUSD.
The EURUSD pair is strongly bearish while trading below the 1.1300 level, key technical support is found at the 1.1270 and 1.1216 levels.
If the EURUSD pair trades above the 1.1300 level, key technical resistance is found at the 1.1330 and 1.1370 levels.