Sample Category Title
GBP/USD Trades Below Weekly S1
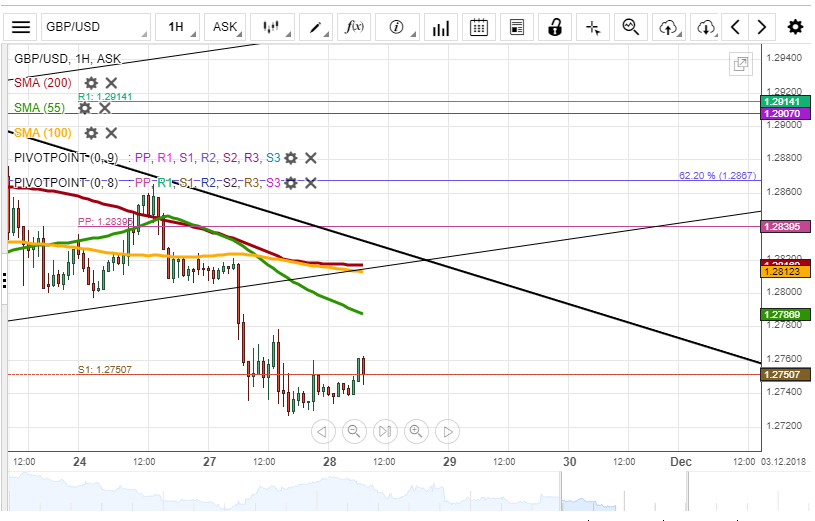
During Tuesday's trading session, the currency exchange rate was trading near the weekly S1 at 1.2750 to end the trading session at the 1.2737 mark. On Wednesday morning, the British Pound was located at the 1.2746 mark.
In regards to the near-term future, most likely, the resistance of the weekly S1 at the 1.2750 mark will push the British Pound to decline towards the weekly S2 at the 1.2676 mark during the trading session on Wednesday.
However, today's UK Bank Stress Test Results could affect the rate to change its trading direction towards the 55-hour simple moving average at the 1.2789 mark.
USD/JPY Surges At 113.80 Level
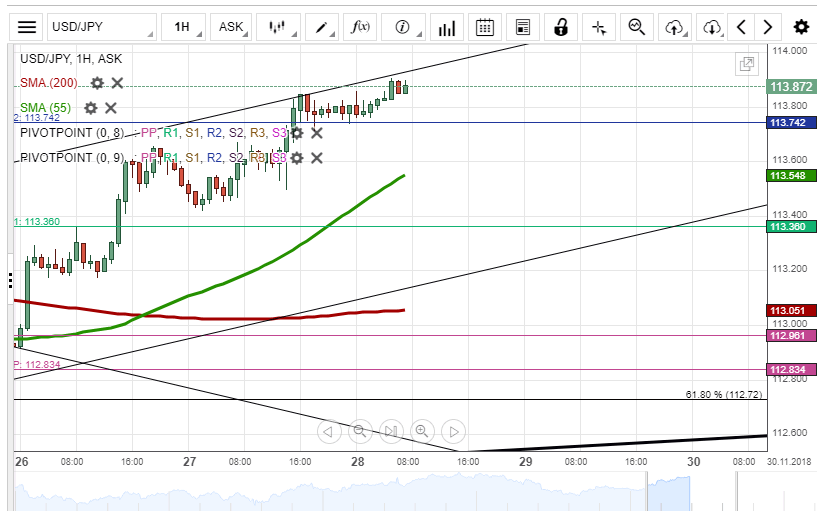
During Tuesday's trading session, the currency exchange rate broke the resistance of the weekly R2 to end the trading session at the 113.75 mark. On Wednesday morning, the US Dollar was kept surging upwards to trade at the 113.86 mark.
In regards to the near-term future, the US Dollar will keep surging upwards to trade at the 114.00 level on Wednesday. The 55-hour simple moving average will try to catch up the rate during the day.
On the other side, the US Dollar could depreciate against the Japanese Yen during today's US Prelim GDP and Crude Oil Inventories data releases to push the rate to pass through the support of the weekly R2 at 113.74 to trade at the 113.60 level.
XAU/USD Falls To 1,214.00 Level
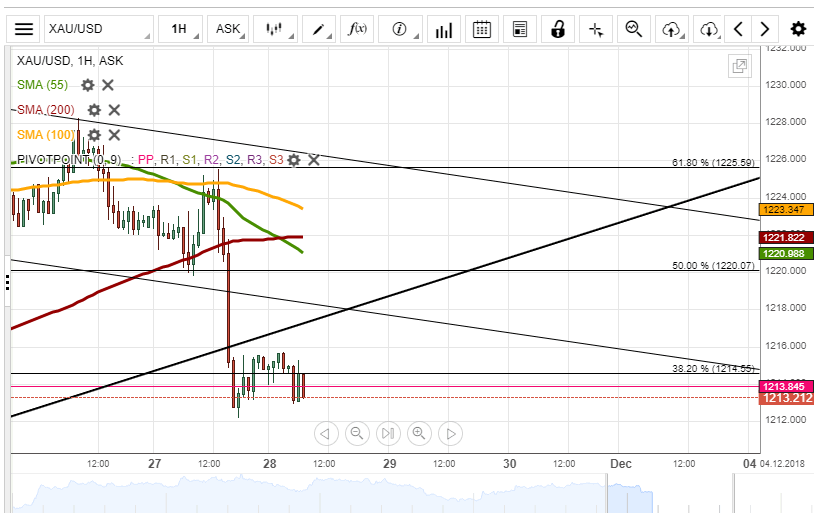
During Tuesday's trading session, the yellow metal depreciated by 1339 pips or 1.09% to end the trading session at the 1,213.88 mark. During Wednesday morning hours, the gold was trading near the 38.20 % Fibonacci retracement level at the 1,214.48 mark.
In regards to the near-term future, most likely, the 38.20 % Fibonacci retracement level at 1,214.55 should resist the yellow metal to trade downwards to reach the 1,210.00 level during the trading day.
On the other side, the yellow metal could appreciate against the US Dollar during today's US Prelim GDP and Crude Oil Inventories data releases to trade at 1,218.00.
German Gfk consumer climate: Weak period of economic activity visible in consumer mood
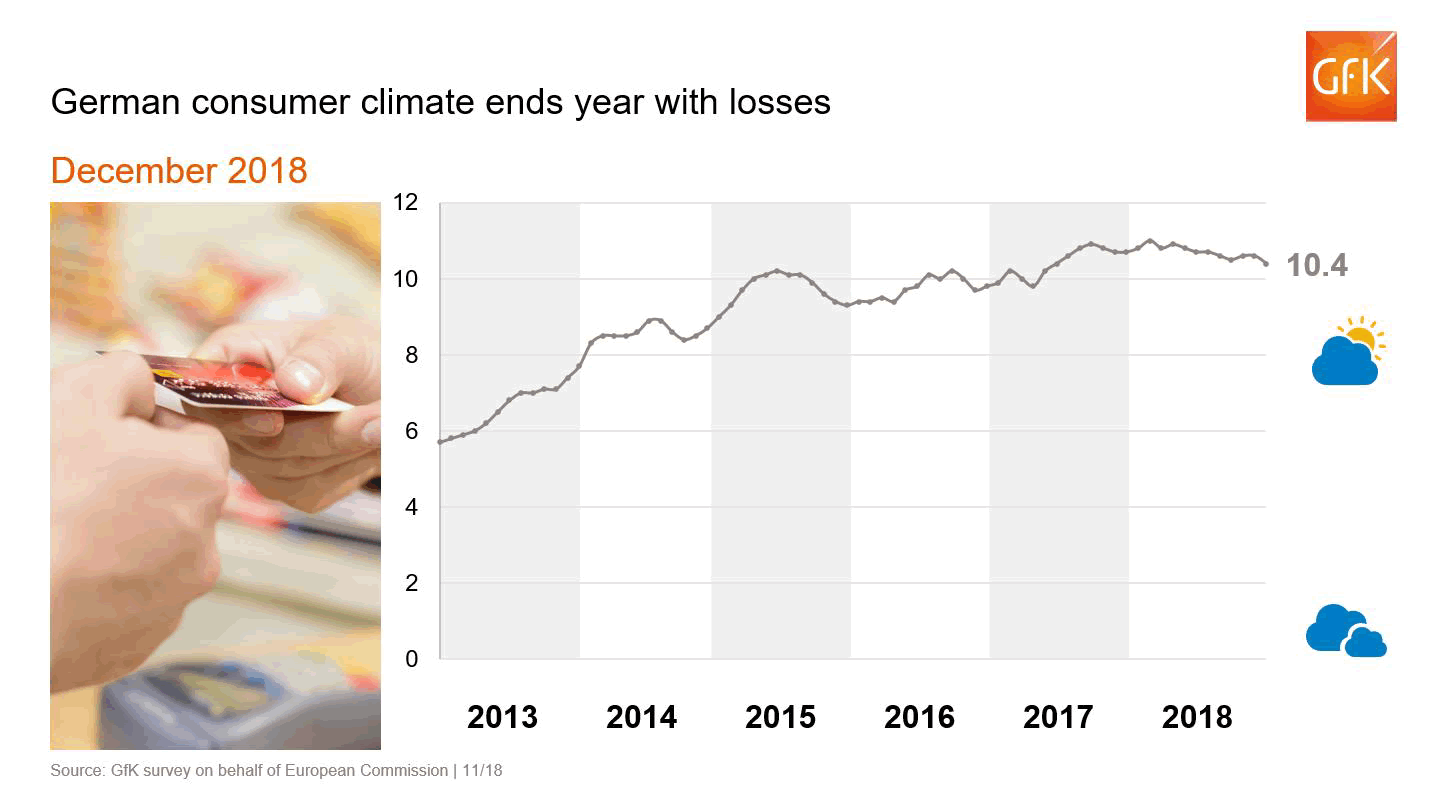
German Gfk consumer climate for December dropped -0.2 to 10.4, slightly below expectation of 10.6.
Gfk noted that:
- "The weak period of economic activity has also been visible in consumer mood in November. Neither economic activity nor income prospects were able to quite maintain the level of the previous month and have decreased slightly"
- "Global economic turbulence, such as the trade conflict between the USA and China and the EU, or Brexit are increasingly concerning German consumers. They see weakening economic momentum and the first dark clouds on the economic horizon. "
- "Moreover, the trade conflict between the EU and USA has not yet been fully resolved. Higher customs duties on important exports to the USA continue to pose a threat here.
- Finally, the impending Brexit is also creating uncertainty since it is still not clear whether Great Britain will leave the EU with or without a deal.
AUDUSD Loses Momentum For Bullish Correction, Indicators Signal Some Gains
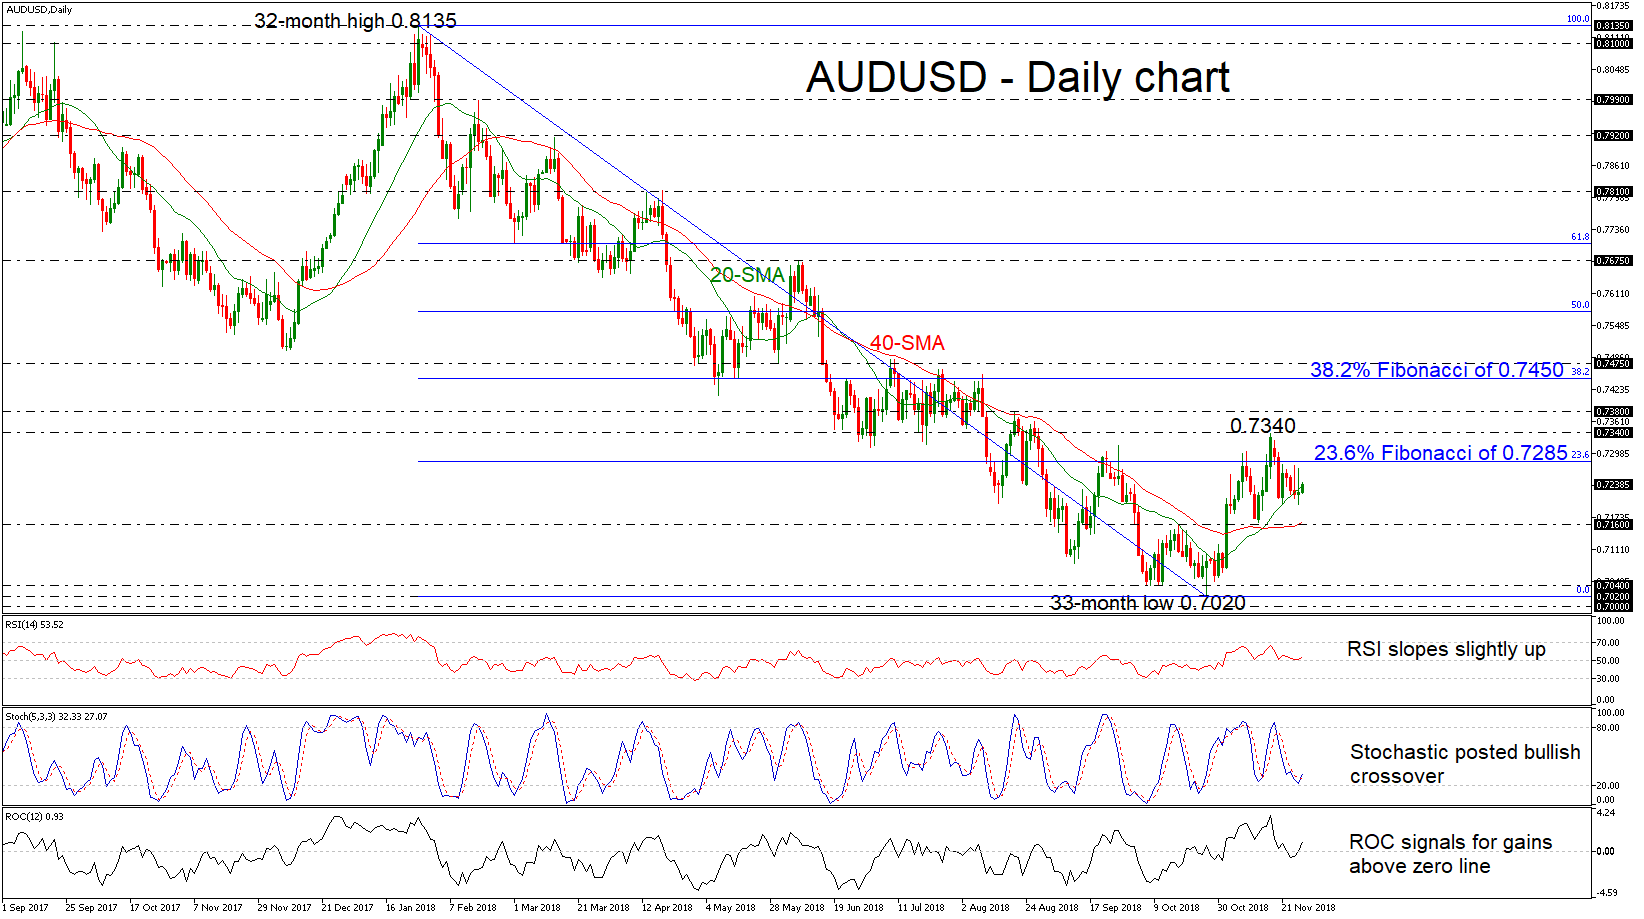
AUDUSD lost its strong upward momentum over the last week after its fall from the two-and-a-half-month high near 0.7340, reducing the chances for a strong bullish correction. The price started the day in bullish territory, however, it is finding some resistance around the 20-day simple moving average (SMA) near 0.7240.
In the short-term, the technical indicators remain in bullish mode with the RSI pointing slightly up, above the neutral threshold of 50, while the red %K line of the stochastic oscillator recorded a positive crossover with the blue %D line above the oversold zone. Moreover, the ROC oscillator surpassed the zero line, signaling possible gains.
On the upside, the 23.6% Fibonacci retracement level of the strong downward movement from 0.8135 to 0.7020, near 0.7285 could be the next immediate resistance for investors to have in mind. Beyond this region, resistance could then run towards the 0.7340 – 0.7380 zone before the 38.2% Fibonacci of 0.7450, which overlaps with the highs on August 8, comes into play again.
On the flipside, should the price fail to climb above the 20-day SMA, it would be interesting to see a retest of the 0.7160 support level, which roughly coincides with the 40-day SMA. Even lower, the market would increasingly eye the 0.7000 – 0.7040 significant support area, which encapsulates the 33-month low of 0.7020.
Summarizing, AUDUSD seems to be in bullish retracement mode after the rebound on the 0.7020 support but it has not given concrete signals for a strong upside movement in the short term.
GBP/JPY Daily Outlook
Daily Pivots: (S1) 144.44; (P) 145.09; (R1) 145.58; More...
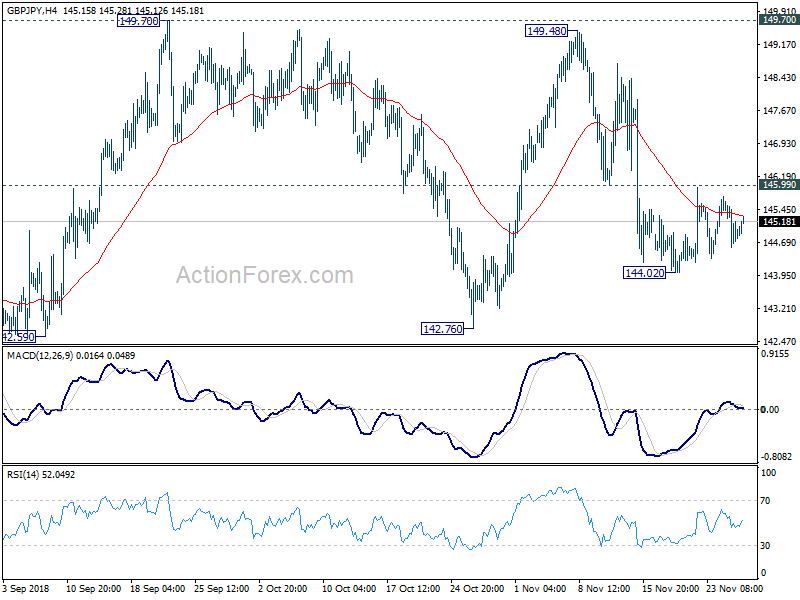
Intraday bias in GBP/JPY remains neutral as consolidation from 144.02 is still in progress. As long as 145.99 resistance holds, further decline is mildly in favor. On the downside, break of 144.02 will resume the fall from 149.48 and target 139.39/47 key support zone. On the upside, above 145.99 support turned resistance could bring stronger rebound. But near tem outlook will be neutral at best as long as 149.70 key resistance holds.
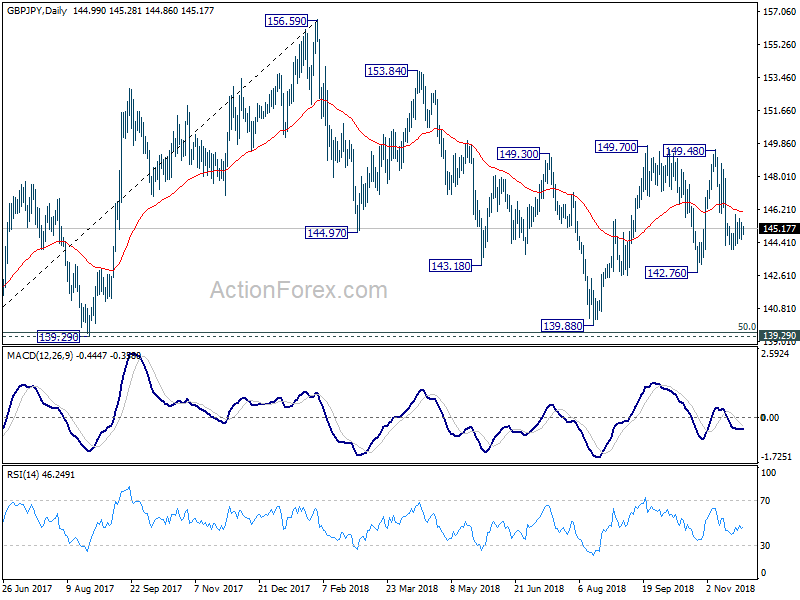
In the bigger picture, as long as 139.29 cluster support (50% retracement of 122.36 to 156.59 at 139.47) holds, up trend from 122.36 (2016 low) would still extend beyond 156.69 high. However, decisive break of 139.29/47 will suggest that such up trend is completed and turn outlook bearish. In that case, next target is 61.8% retracement at 135.43.
EUR/JPY Daily Outlook
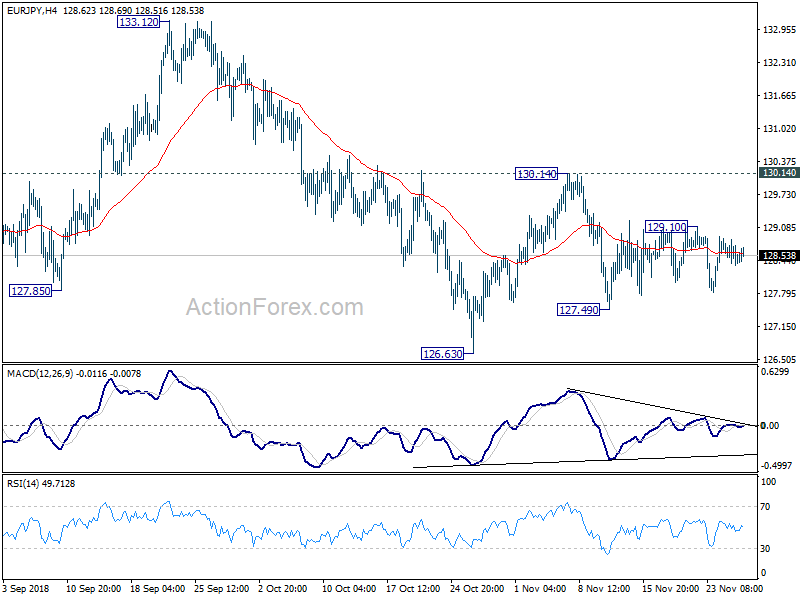
Daily Pivots: (S1) 128.24; (P) 128.54; (R1) 128.75; More....
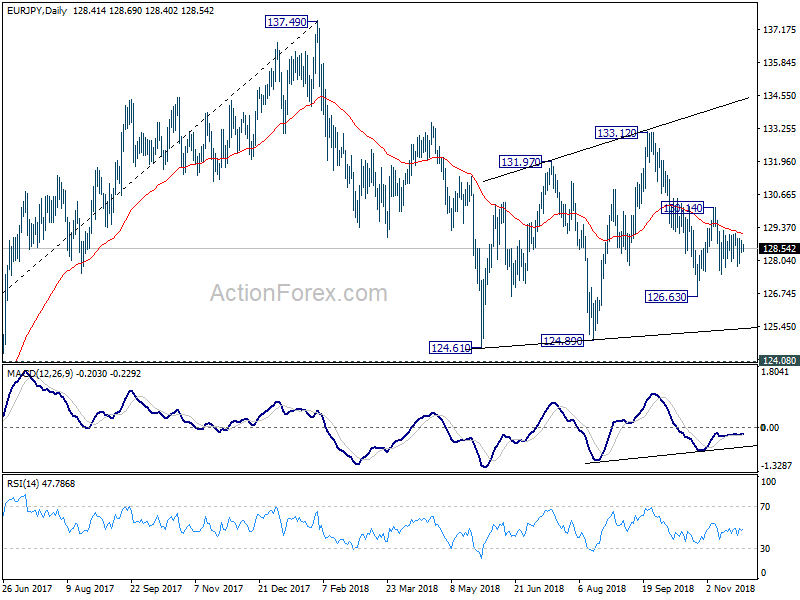
Intraday bias in EUR/JPY stays neutral for the moment. Also, near term outlook remains mildly bearish as long as 130.14 resistance holds. On the downside, below 127.49 will target 126.63 support first. Break there will resume whole fall from 133.12 and target 124.08/89 support zone. On the upside, however, break of 130.14 will resume the rebound from 126.63 towards 133.12 resistance.
In the bigger picture, as long as 124.08 key resistance turn supported holds, larger up trend from 109.03 (2016 low) is still in progress. Firm break of 137.49 structural resistance will target 141.04/149.76 resistance zone next. However, decisive break of 124.08 will argue that such rise from 109.03 has completed and turn outlook bearish. In that case, deeper fall would be seen to 61.8% retracement of 109.03 to 137.49 at 119.90.
EUR/GBP Daily Outlook
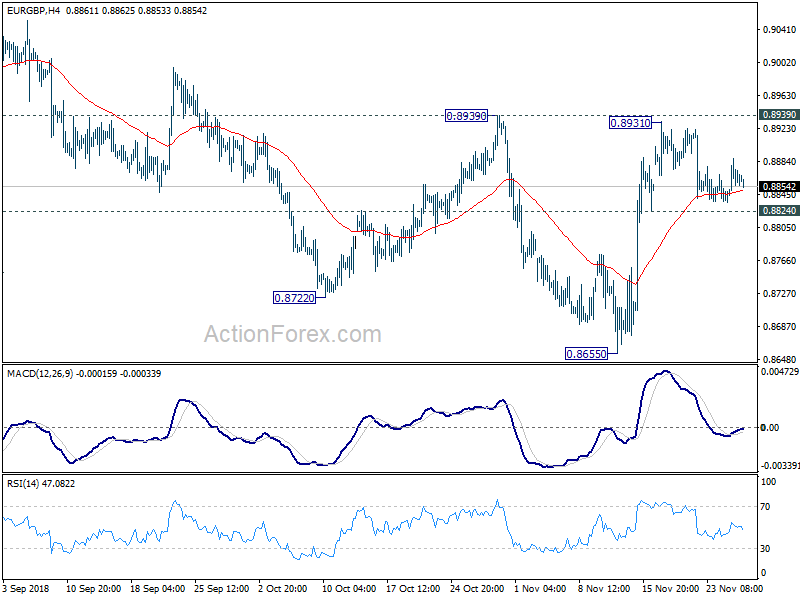
Daily Pivots: (S1) 0.8836; (P) 0.8862; (R1) 0.8890; More...
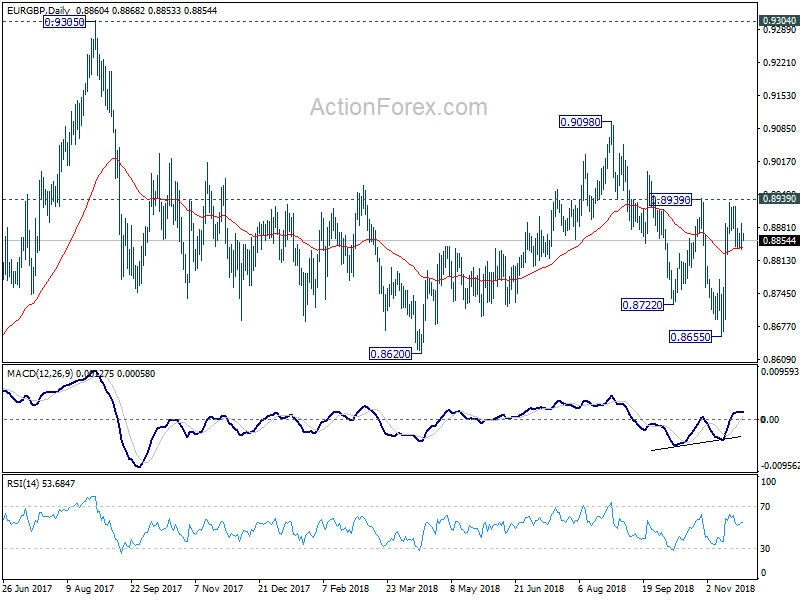
Intraday bias in EUR/GBP remains neutral at this point. Another rise is expected with 0.8824 minor support intact. On the upside, firm break of 0.8939 resistance will target 0.9098 resistance next. However, break of 0.8824 will now suggest completion of the rebound from 0.8655. Intraday bias will be turned back to the downside for 0.8655 support instead.
In the bigger picture, EUR/GBP is seen as staying in long term range pattern started at 0.9304 (2016 high). Sustained break of 0.8939 resistance will confirm that it's in a medium term rising leg for 0.9098 and above. And for now, in case of another fall, downside will likely be contained by 0.8620/55 support zone to bring rebound.
EUR/AUD Daily Outlook
Daily Pivots: (S1) 1.5568; (P) 1.5639; (R1) 1.5694; More....
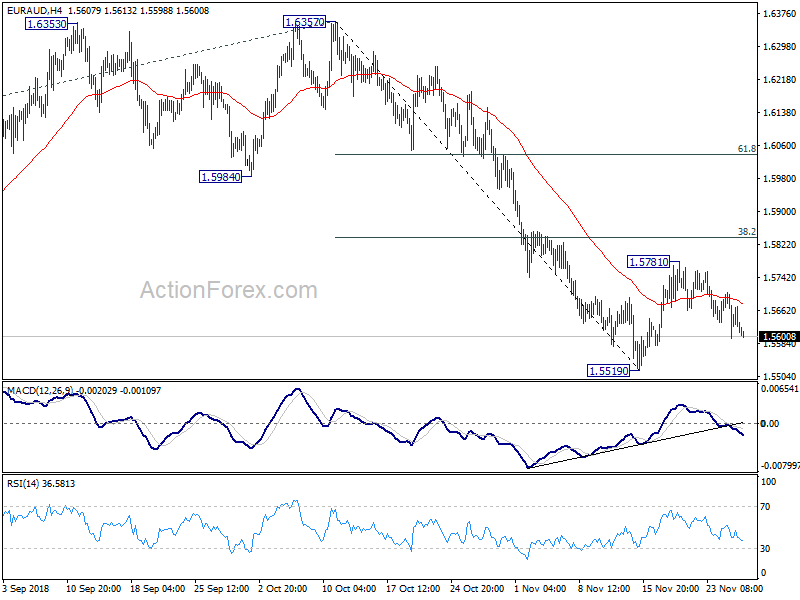
Intraday bias in EURAUD remains on the downside for retesting 1.5519 low. Firm break there will resume whole fall from 1.6357 to 1.5271/5313 cluster support zone next. In case of another rise as consolidation from 1.5519 extends, upside should be limited by 38.2% retracement of 1.6357 to 1.5519 at 1.5839 to bring fall resumption eventually.
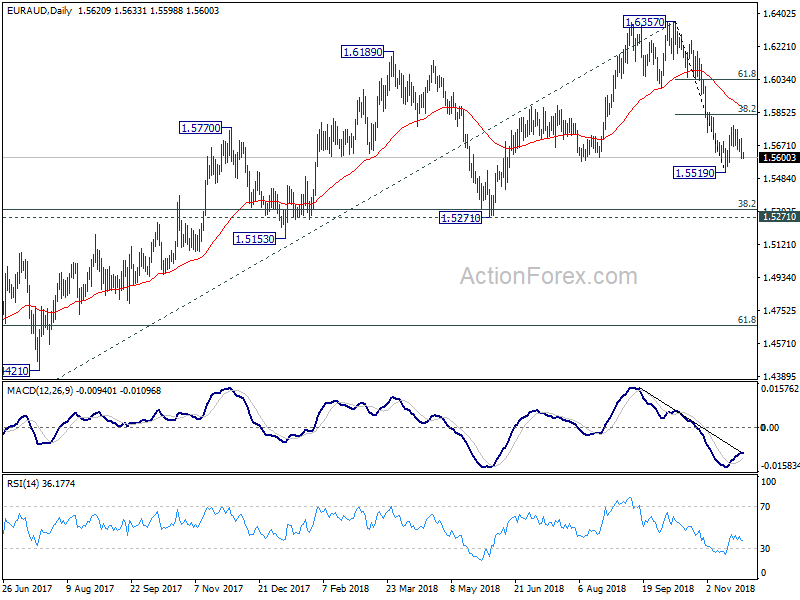
In the bigger picture, current development argues that up trend from 1.3624 (2017 low) is possibly completed at 1.6357, ahead of 1.6587 (2015 high). This is supported by bearish divergence condition in weekly MACD. Deeper decline is now in favor to 1.5271 cluster support (38.2% retracement of 1.3624 to 1.6357 at 1.5313). Break will target 61.8% retracement at 1.4668. On the upside, break of 1.5984 support turned resistance is now needed to revive the prior medium term up trend. Otherwise, further decline will be in favor even in case of strong interim rebound.
EUR/CHF Daily Outlook
Daily Pivots: (S1) 1.1261; (P) 1.1293; (R1) 1.1310; More...
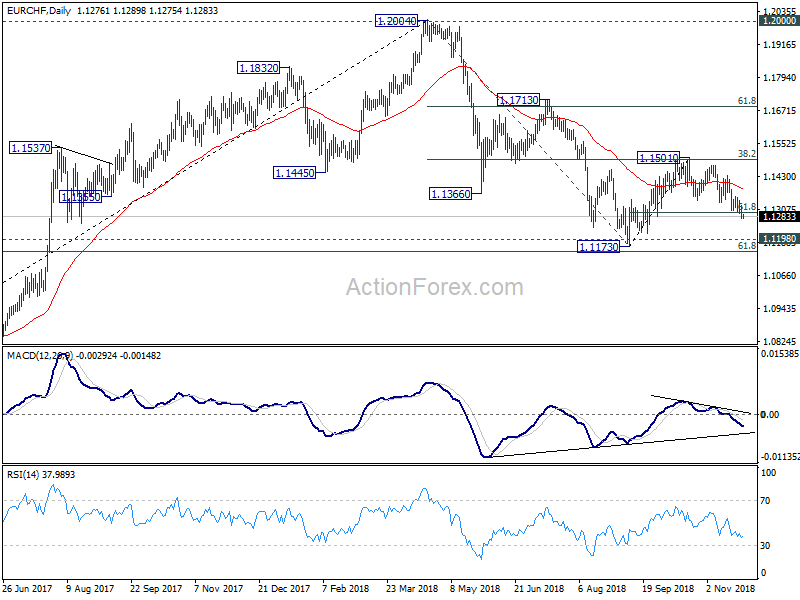
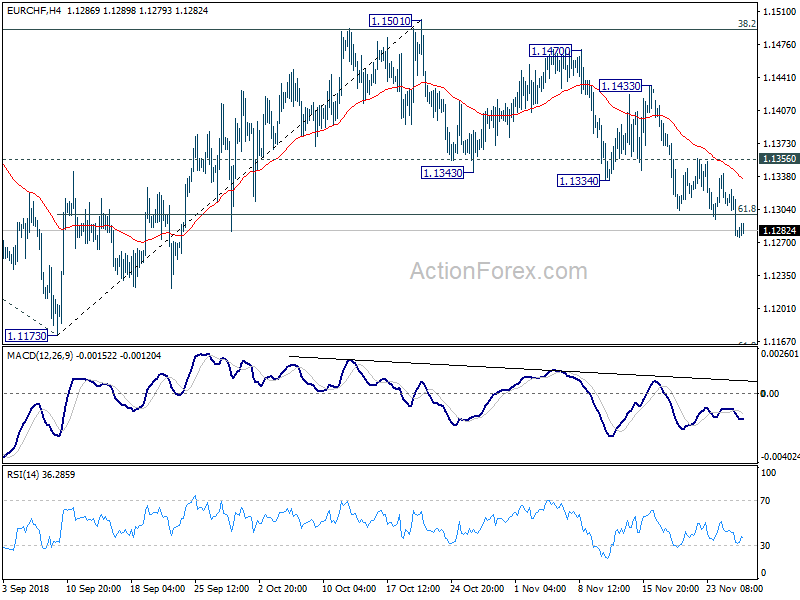
EUR/CHF's decline from 1.1501 turns out to be deeper than expected. The break of 61.8% retracement of 1.1173 to 1.1501 at 1.1298 argue that whole rebound from 1.1173 might have completed already. Intraday bias is back on the downside for retesting 1.1173 low. On the upside, break of 1.1356 resistance is now needed to indicate short term bottoming. Otherwise, outlook will be mildly bearish even in case of recovery.
In the bigger picture, price actions from 1.2004 medium term top is seen as a correction only. Downside should be contained by support zone of 1.1198 (2016 high) and 61.8% retracement of 1.0629 to 1.2004 at 1.1154 to complete it and bring rebound. This cluster level is in proximity to long term channel support (now at 1.1240) too. A break of 1.2 key resistance is still expected in the medium term long term. However, sustained break of the mentioned support zone will mark reversal of the long term trend. In that case, 1.0629 key support will be back into focus.