

Sample Category Title
Political declaration on framework for EU-UK relationship, full document
Sterling was boosted yesterday by the news that the UK and EU agreed on the draft declaration on future relationship after Brexit. The document is now subject to endorsement by EU leaders on the special summit this Sunday. Here are some highlights from the introduction section:
- The Union and United Kingdom are determined to work together to safeguard the rules-based international order, the rule of law and promotion of democracy, and high standards of free and fair trade and workers' rights, consumer and environmental protection, and cooperation against internal and external threats to their values and interests.
- This declaration establishes the parameters of an ambitious, broad, deep and flexible partnership across trade and economic cooperation, law enforcement and criminal justice, foreign policy, security and defence and wider areas of cooperation
- This relationship will be rooted in the values and interests that the Union and the United Kingdom share. These arise from their geography, history and ideals anchored in their common European heritage.
- The Union and the United Kingdom agree that prosperity and security are enhanced by embracing free and fair trade, defending individual rights and the rule of law, protecting workers, consumers and the environment, and standing together against threats to rights and values from without or within.
- The future relationship will be based on a balance of rights and obligations, taking into account the principles of each Party. This balance must ensure the autonomy of the Union's decision making and be consistent with the Union's principles, in particular with respect to the integrity of the Single Market and the Customs Union and the indivisibility of the four freedoms. It must also ensure the sovereignty of the United Kingdom and the protection of its internal market, while respecting the result of the 2016 referendum including with regard to the development of its independent trade policy and the ending of free movement of people between the Union and the United Kingdom.
ECB Might Keep Policy Rates Low for Longer, Given Downside Risk to Growth and Trade War
ECB has tilted its tone on the economic outlook recently. In the minutes for the October meeting, ECB acknowledged “uncertainties and fragilities” in the economy. The members noted that risks to the economic outlook is skewed to the downside as driven by the uncertainties related to global trade. Yet, it reiterated the incoming data had not been able to derail Eurozone’s strength. In short, the October meeting concluded that “the incoming data, while somewhat weaker than expected, remained overall consistent with an ongoing broad-based expansion”.
We observe that ECB president Mario Draghi have changed his tone on the economic outlook in recent weeks. On November 8, he noted in Ireland that affirmed that “while some sector-specific data and selected survey results have been somewhat weaker than expected, the latest incoming information overall suggests that the broad-based expansion in the euro area is set to continue’. Yet, at the Frankfurt European Banking Congress on November 16, he admitted that “we have recently seen a loss in growth momentum”. He added that although ECB had lowered its last two quarterly growth forecasts, “actual data have also been weak”.
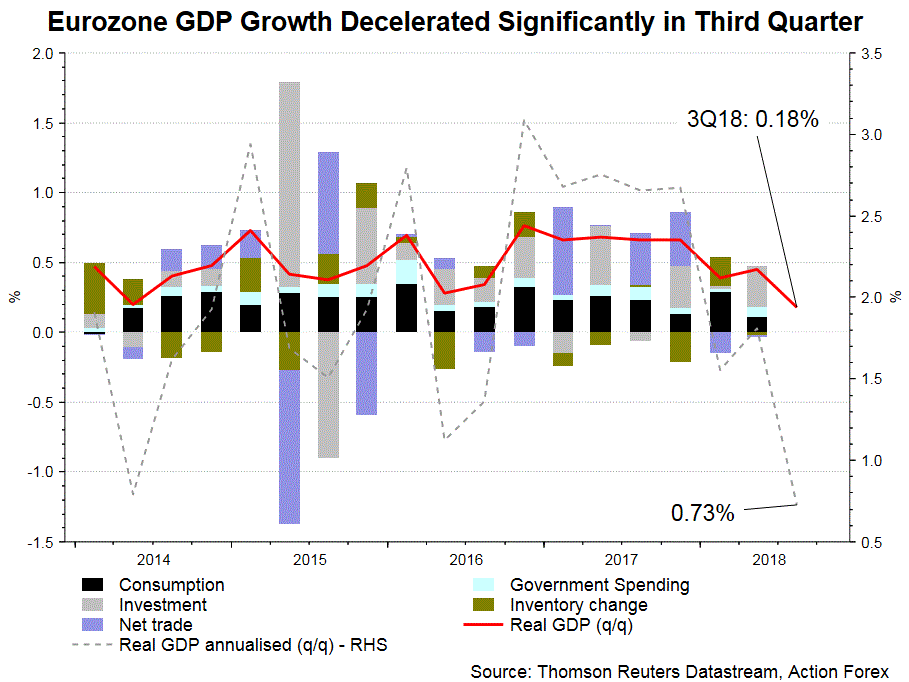
Dataflow since the October has pointed to the weak side. GDP growth decelerated to +0.2% q/q, the lowest level in three year, in 3Q18. Earlier this week, OECD revised lower its forecast on the region’s growth to +1.9% y/y for 2019, down from previous estimate of +2%. Growth in 2020 would slow further to +1.6% in 2020. The agency noted that growth in Germany would also moderate but "remain solid". World GDP growth is downgraded to +3.7% for 2019, from previous projection of +3.5%. Headline CPI remained firm above +2%. Yet, it was driven by the rally in oil price. Core CPI remained at lukewarm +1.1%. Consumer confidence slumped to -3.9 in October, the lowest since March 2017. Markit’s PMI, due today, would be closely watched as it is the first report showing the development of economic activities in November.
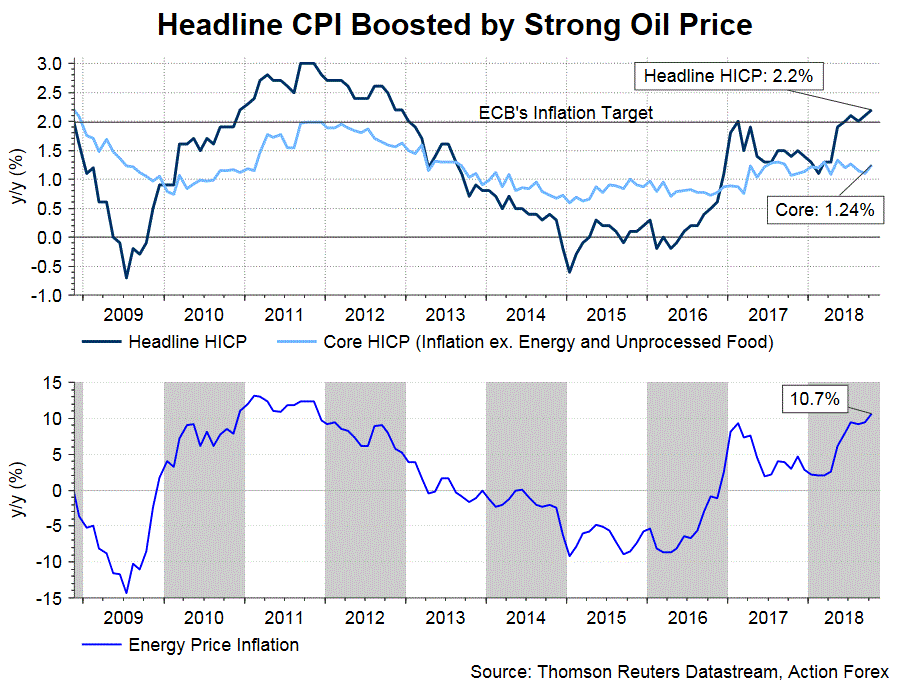
ECB kept the main refi rate stays at 0% and the deposit rate at -0.4% and reaffirmed that the policy rates would stay on hold until at least the summer of 2019, to ensure that inflation returns sustainably to the target of below, but close to, 2%. Meanwhile, ECB’s monthly asset buying of 15B euro would end in December. the members would announce the reinvestment plan of the assets after QE ends in December. Given the downside risk embedded in the economy, it is possible for the central bank to push backward the timing that the policy rates would stay on hold.
USD/JPY Could Decline Further Towards 112.00
Key Highlights
- The US Dollar started a downside move after trading towards the 114.20 level against the Japanese Yen.
- There was a break below a major bullish trend line with support at 113.90 on the 4-hours chart of USD/JPY.
- The Euro Zone Consumer Confidence in Nov 2018 (Preliminary) declined from -2.7 to -3.9.
- Today, the US Manufacturing PMI for Nov 2018 (Preliminary) will be released, which is forecasted to remain at 55.7.
USDJPY Technical Analysis
The US Dollar faced a strong resistance near the 114.20 level against the Japanese Yen. The USD/JPY pair started a downside move and traded below the 113.40 support level.
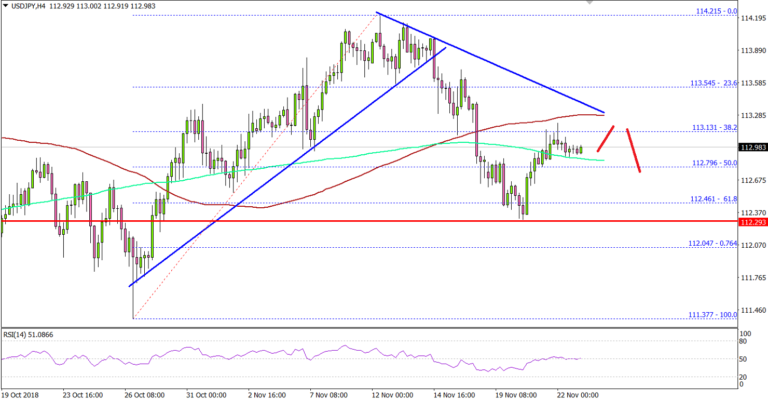
Looking at the 4-hours chart, the pair declined below many key supports, including 113.20 and 112.60. There was also a break below the 100 simple moving average (red, 4-hours) and the 50% Fib retracement level of the last wave from the 111.37 low to 114.21 high.
Besides, there was a break below a major bullish trend line with support at 113.90 on the same chart. The decline was such that the pair spiked below the 112.50 support level. It traded as low as 112.30 later recovered above the 112.80 level.
However, the pair is facing a solid resistance near the 113.10-20 zone. Moreover, there is a bearish trend line with resistance at 113.30 on the same chart.
Therefore, it won’t be easy for buyers to clear the 113.20 and 113.30 resistance levels. On the downside, an initial support is at 112.60, below which the pair could slide towards the 112.40 level. The main support is at 112.00 and the 76.4 Fib retracement level of the last wave from the 111.37 low to 114.21 high.
Overall, as long as USD/JPY is below the 113.30 level, it could continue to correct lower in the short term.
Economic Releases to Watch Today
- Germany’s Manufacturing PMI for Nov 2018 (Preliminary) – Forecast 52.2, versus 52.2 previous.
- Germany’s Services PMI for Nov 2018 (Preliminary) – Forecast 54.5, versus 54.7 previous.
- Euro Zone Manufacturing PMI Nov 2018 (Preliminary) – Forecast 52.0, versus 52.0 previous.
- Euro Zone Services PMI for Nov 2018 (Preliminary) – Forecast 53.5, versus 53.7 previous.
- US Manufacturing PMI for Nov 2018 (Preliminary) – Forecast 55.7, versus 55.7 previous.
- US Services PMI for Nov 2018 (Preliminary) – Forecast 54.8, versus 54.8 previous.
- Canadian Retail Sales Sep 2018 (MoM) – Forecast +0.1%, versus -0.1% previous.
- Canadian Consumer Price Index Oct 2018 (MoM) – Forecast +0.1%, versus -0.4% previous.
- Canadian Consumer Price Index Oct 2018 (YoY) – Forecast +2.2%, versus +2.2% previous.
AUDUSD Broader Risk Remains Higher Towards 0.7337 Zone
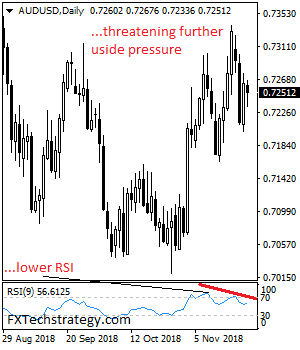
AUDUSD broader risk remains higher with strength expected towards its resistance located at 0.7337 level. On the upside, resistance lies at the 1.7350 level. A cut through here will turn attention to the 0.7400 level and then the 0.7450 level where a violation will set the stage for a retarget of the 0.7500 level. Support resides at the 0.7250 level where a breach will aim at the 0.7200 level. Below here will set the stage for a run at the 0.7150 level with a cut through here targeting further downside pressure towards the 0.7100 level. On the whole, AUDUSD faces further upside threats.
Gold Steady In Holiday-Thin Trade
Gold has posted small gains in the Thursday session. In North American trade, the spot price for one ounce of gold is $1227.51, up 0.12% on the day. Markets and banks in the U.S. are closed for the Thanksgiving holiday and there are no U.S events on the schedule.
Gold has enjoyed an uneventful week, but the same cannot be said about the stock markets, which have endured a tumultuous week. The sharp drop in the equity markets has unnerved investors, who remain jittery even though stock markets have recovered slightly after a meltdown on Tuesday. If the equity markets continue to show turbulence, gold could take advantage as investors eye safe-haven assets such as gold.
The turmoil in the stock markets has raised questions about the Federal Reserve’s monetary policy. The markets had expected the Fed to raise rates up to four times in 2019, but with signs that the U.S. economy could slow in 2019, policymakers may ease up on the pace of rate hikes. The Federal Reserve remains on track to gradually raise rates in 2019, but the pace could be slower than anticipated just a few weeks ago. There’s no denying that the U.S economy is currently in great shape, with unemployment at historically low levels and the $1.5 trillion tax cut package boosting economic growth. However, the rosy picture could change next year. The U.S-China trade war is expected to take a bite out of U.S growth, and the stimulus from the tax cut will fade over time. Economic growth has been slowing, with third-quarter growth expected at 2.7%, down from 3.5% in the second quarter. A rate increase in December remains a strong possibility, with the odds of a rate hike standing at 76%.
GBP/USD – British Pound Jumps On Leaked Brexit Declaration
GBP/USD has posted considerable gains in Thursday trade. In the North American session, the pair is trading at 1.2766, up 0.46% on the day. Markets in the United States are closed for Thanksgiving, and there are no economic releases out of the U.K. or the United States. Prime Minister May is speaking in Parliament, as she tries to sell the Brexit withdrawal agreement to members of parliament.
Although there are no economic indicators on either side of the pond, the pound has shown plenty of movement on Thursday. The pound gained as much as 1 percent, following the leak of a 26-page political declaration, which Prime Minister May hopes to sign with EU leaders on Sunday in Brussels. The declaration reiterates a key cornerstone of the withdrawal agreement – Britain will remain in a customs union with the EU, if the thorny issue of the Irish border is not resolved by the end of the transition period. This stance is anathema to many pro-Brexit MPs, who argue that essentially Britain will be stuck in a customs union with the EU until the latter is satisfied that the Irish issue has been resolved. The withdrawal agreement will have to be approved by the British parliament, which promises to be a tough sell for an embattled Prime Minister May. With the Brexit clock ticking down towards the March deadline, we can expect more volatility from the British pound.
Investors will be catching their breath on the Thanksgiving holiday, after a tumultuous week on the stock markets. The meltdown on Tuesday has raised questions about the Federal Reserve’s monetary policy. The markets had expected the Fed to raise rates up to four times in 2019, but with more signs that the U.S. economy could slow in 2019, policymakers may ease up on the pace of rate hikes. The Federal Reserve remains on track to gradually raise rates in 2019, but the pace could be slower than anticipated just a few weeks ago. There’s no denying that the U.S economy is currently in great shape, with unemployment at historically low levels and the $1.5 trillion tax cut package boosting economic growth. However, the rosy picture could change next year. The U.S-China trade war is expected to take a bite out of U.S growth, and the stimulus from the tax cut will fade over time. Economic growth has been slowing, with third-quarter growth expected at 2.7%, down from 3.5% in the second quarter. A rate increase in December remains a strong possibility, with the odds of a rate hike standing at 76%.
Eco Data 11/23/18
[php_everywhere instance="1"]
WTO: G20 new trade-restrictive measures surged to record, serious concern for international community
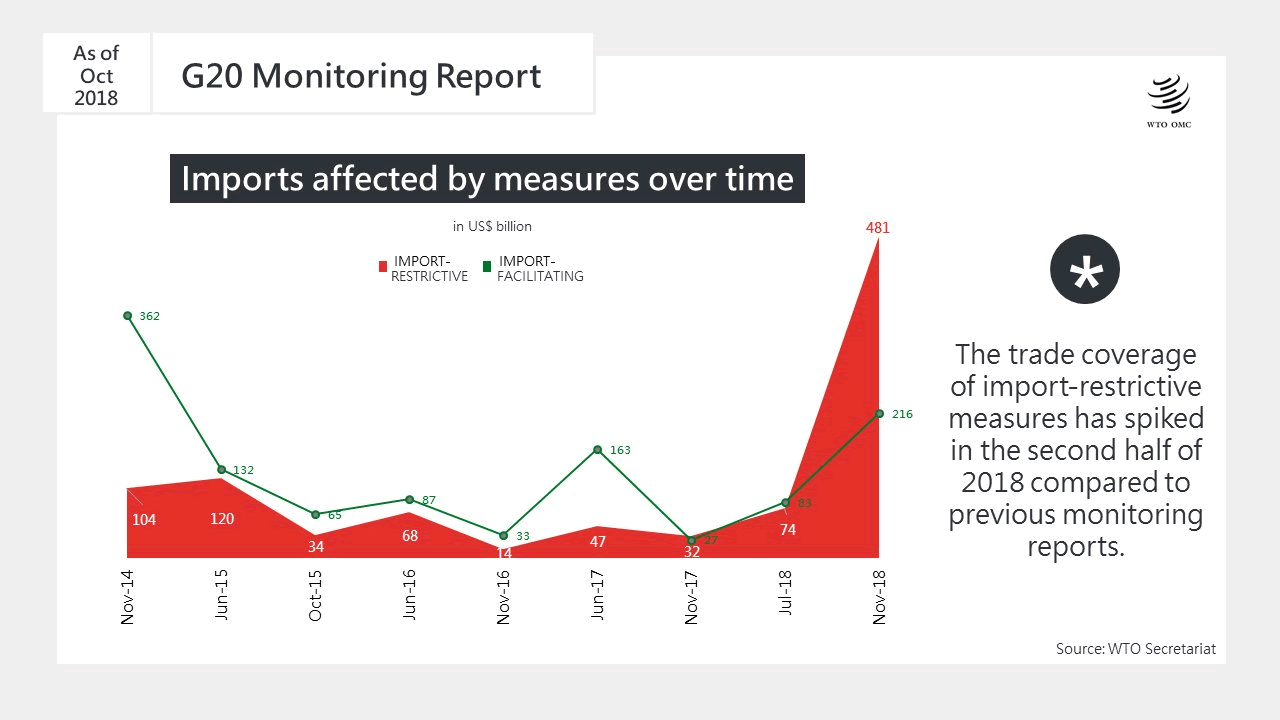
A WTO monitoring report released today noted sharp rise in trade restrictive measures in G20 economies between mid-May and mid-Oct 2018. Trade covered of the measures adds up to USD 481B, six time larger than prior reporting period, and highest since record started in 2012.
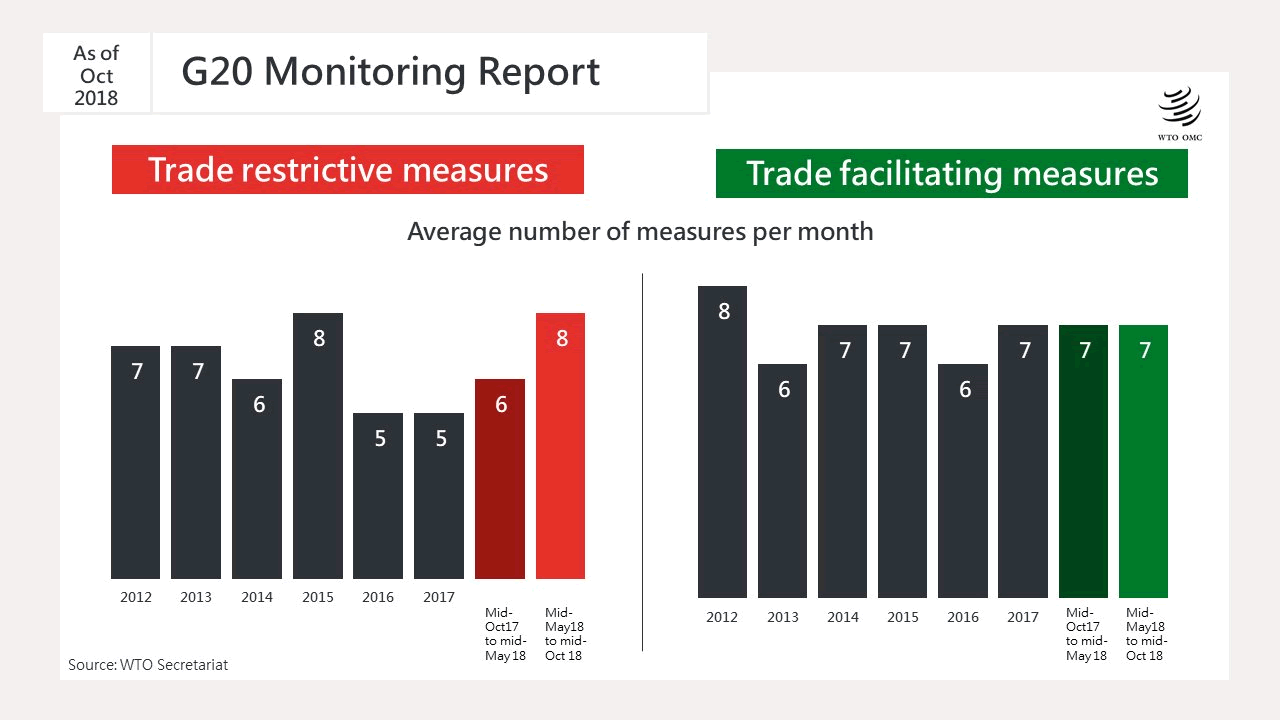
A total of 40 new trade-restrictive measures were applied, averaging eight per month, including tariff increases, import bans and export duties. That's notably higher than almost six trade-restrictive measures per month during prior period. 33 new trade facilitating, including eliminating or reducing import tariffs and export duties. The number is in line with 2012-17 trend.
Commenting on the report, Director-General Roberto Azevêdo said:
"This report provides a first factual insight into the trade-restrictive measures which have been introduced over recent months, and which now cover over $480 billion worth of trade. The report's findings should be of serious concern for G20 governments and the whole international community.
"Further escalation remains a real threat. If we continue along the current course, the economic risks will increase, with potential effects for growth, jobs and consumer prices around the world. The WTO is doing all it can to support efforts to de-escalate the situation, but finding solutions will require political will and it will require leadership from the G20."
Weekly Economic and Financial Commentary: Italian Budget Drama Likely to Drag into 2019
U.S. Review
Housing Market Remains in Focus This Week
- Several housing-related indicators released this week point to a continued slowdown in the housing sector. The National Association of Homebuilders/Wells Fargo housing market index posted a sharp eight point decline in November, while housing starts and existing home sales eked out only moderate gains in October.
- Durable goods orders were also lackluster in October, with declines in the volatile defense and nondefense aircraft components contributing to the 4.4% headline drop. October's data reinforce the likely continued moderation in business spending from the first half of 2018.
Housing Market Remains in Focus This Week
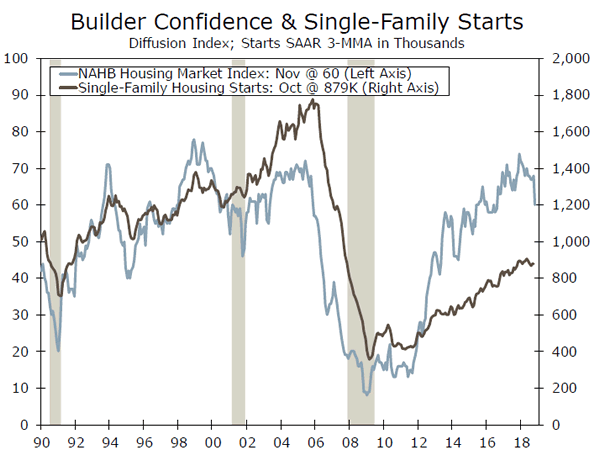
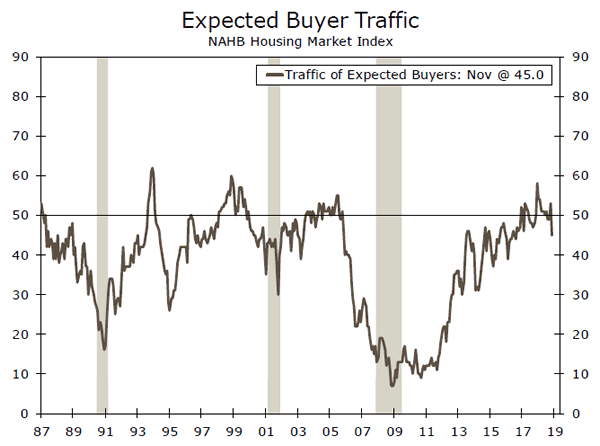
Several indicators released this week point to continued slowing momentum in the housing market. Arguably the biggest surprise in this week's data was the eight point drop in the National Association of Homebuilders (NAHB)/Wells Fargo Housing Market Index in November (see chart on first page). This month's plunge to 60 was the largest drop since February 2014, with declines in both builders' assessment of current sales and future sales expectations indices. The expected buyer traffic index notably dropped below the 50 demarcation line, which means more builders see conditions as bad than good, and suggests the potential for further moderation in coming months (top chart).
At the same time, housing starts data also released this week point to weakness in the single-family market. While overall housing starts rose 1.5% in October, all of the gain was concentrated in the multifamily component, which rose 10.3%. Breaking down this gain further, projects with five or more units rose more than 6% over the month. This pickup primarily reflects apartment projects, and suggests that the multifamily market could have room for further upward momentum going forward. Conversely, single-family building permits declined 0.6% in October. Permits are running below starts, and point to single-family construction remaining lackluster in coming months.
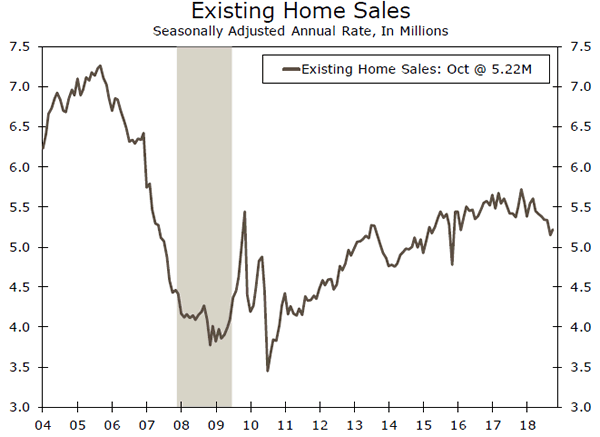
We also learned this week that existing home sales rose 1.4% in October to a 5.220-million unit pace after declining 3.4% in September (middle chart). Although total sales rebounded in the month, the strength in October's reading was concentrated in the condo/co-op component, which rose 5.3% in the month, compared to a lower 0.9% rise in single-family sales. Compared to a year ago, however, total existing sales are down more than 5%.
For homebuyers, while personal incomes continue to gradually pick up and most consumers maintain an optimistic economic outlook, rising mortgage rates will likely continue to weigh on affordability. To that end, revised consumer sentiment data for November released today confirmed that while consumers' overall assessment of the economy largely remains positive, the home buying outlook is less bright. The percent of respondents stating home-buying conditions are good continued its downward trend to 64% in November's final reading, while the survey also cited that "favorable home buying conditions remain at depressed levels."
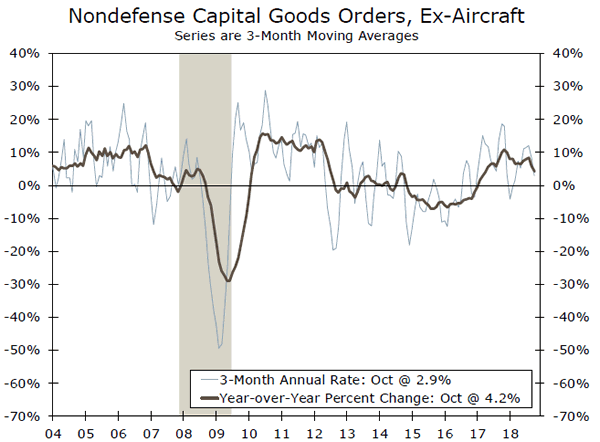
Finally, data on business spending were also less impressive this week, with durable goods orders declining 4.4% in October, on the heels of a downwardly revised 0.1% drop in September. The typically volatile defense and nondefense aircraft components fell sharply, and gains in other sub categories were also largely lackluster. Our preferred measure of core capital goods orders excluding aircraft was flat in October, and the three-month annualized rate dropped to its lowest since March (bottom chart). Although we look for business equipment spending to rebound in Q4 after only a 0.4% annualized gain in Q3, the October data reinforce that business investment will likely continue to moderate from the double-digit rates seen in the first half of 2018.
U.S. Outlook
Housing Starts • Tuesday
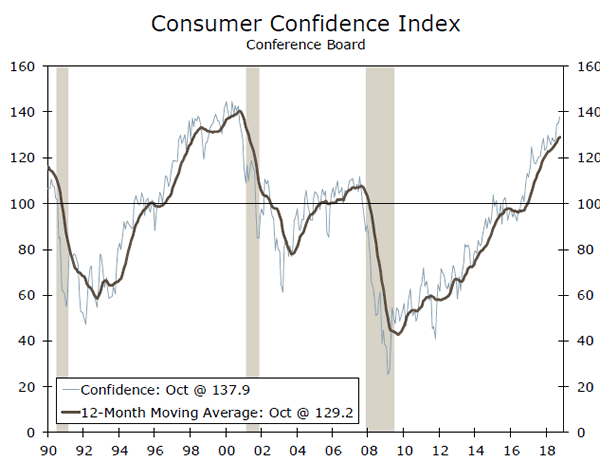
We learned earlier this week that the University of Michigan's measure of consumer sentiment slipped only slightly in November despite choppy financial markets and worries about trade tariffs. On Tuesday of this coming week we get the Conference Board's measure of consumer confidence, which has been running a little hotter than its University of Michigan counterpart in recent months. In fact, in October Consumer Confidence came in at an 18-year high. We would not drop our coffee if this report shows confidence coming off the boil here in November. The backdrop is still supportive of sustained confidence: the job market is solid, economy is still doing well and prices are not rising too fast. Still, the return of intense volatility in financial markets and concerns about rising interest rates may take some of the wind out of consumers' sails. Previous: 137.9 Wells Fargo: 135.8
New Home Sales • Wednesday
The housing market has been a notable weak spot in an otherwise solid economy. The weakness here has become even more pronounced recently. For example, earlier this week, a widely followed sentiment measure for homebuilders posted its largest monthly decline in nearly five years in November.
To be fair, another release this week revealed that housing starts bounced in October, rising 1.5% after a 5.5% decline in the prior month. On Wednesday financial markets will digest two more reports on the state of the housing market when mortgage applications and new home sales both hit the wire.
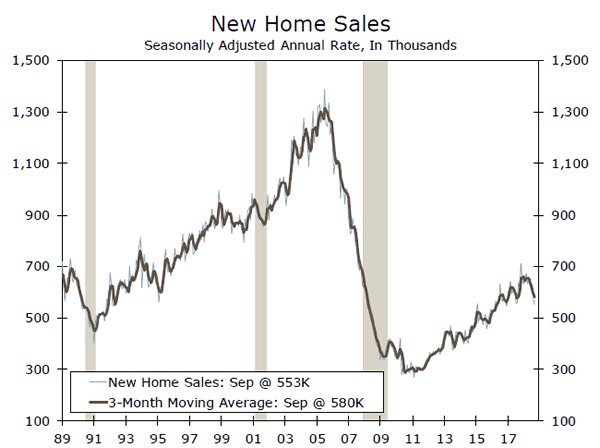
Mortgage applications have fallen in five out of the past six weeks and new home sales have fallen in five out of the past six months. Rising rates and inventory issues are the primary headwinds and it is not immediately clear that either is moving in the right direction. Previous: 553K Wells Fargo: 575K
Personal Income & Spending • Thursday
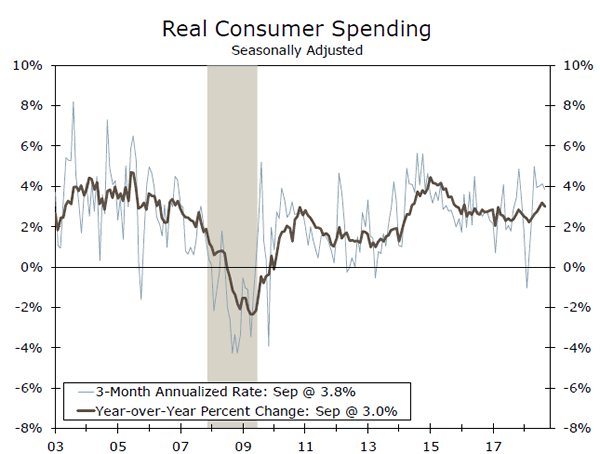
On Wednesday of next week the Commerce Department will make its first revision to third quarter GDP figures. The first estimate showed real personal consumption expenditures came in hot in Q3, growing at an annualized pace of 4.0%.
The following day (Thursday), we'll get an indication of how spending is holding up in the current quarter when the personal income and spending report for October hits the wire.
If the retail sales report for October is any indication, it looks like consumers kept on spending. Retailers reported the biggest increase in five months.
Meanwhile an extraordinarily tight labor market has yet to translate into meaningful and sustained growth in personal income. Previous: 0.2% & 0.4% Wells Fargo: 0.4% & 0.4%
Global Review
Italian Budget Drama Likely to Drag into 2019
- In a short week with limited foreign economic data releases, we focus this week on the ongoing Italian budget drama.
- Thus far, European Union officials have remained unsatisfied with the fiscal outlook in Italy, and an excessive deficit procedure against Italy appears increasingly likely.
- Were this to occur, financial penalties could be imposed against Italy some time in 2019. Both sides have multiple points along the way at which a compromise could be reached and financial penalties avoided.
- With neither side willing to back down so far, however, it seems likely the Italian budget drama will continue well into 2019.
Italian Budget Drama Likely to Drag into 2019
In a short week with limited foreign economic data releases, we focus this week on the ongoing Italian budget drama. Since our most recent special report on Italy, Italian policymakers have continued full steam ahead with their plans to ease fiscal policy next year through a combination of tax cuts and increased spending. As the process has dragged on, there have been multiple back and forth exchanges between Italian and EU policymakers. Italy has slowly made some modest concessions, such as lower deficit targets in 2020/2021 and a public asset sale back-up plan should next year's target not be met. Through each iteration, however, Italy has stuck to its initial deficit target of 2.4% in 2019, up from approximately 1.8% in 2018 and well above the 0.8% target for 2019 proposed by the previous government back in April. Thus far, EU officials have remained unsatisfied.
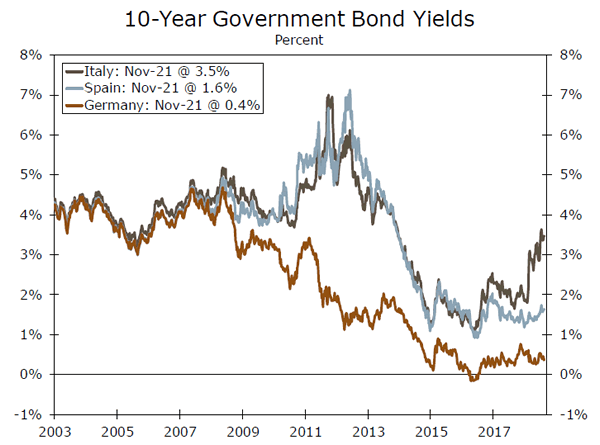
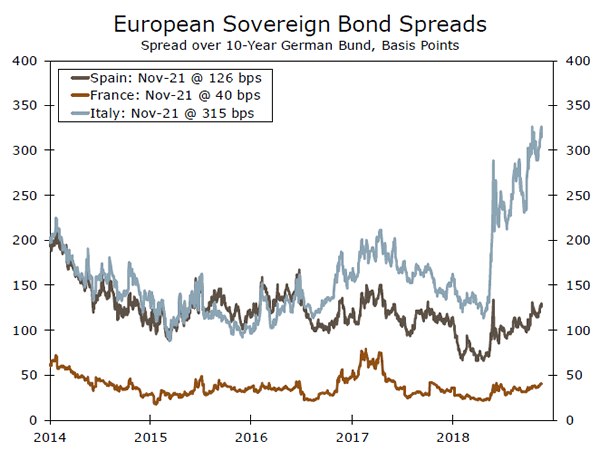
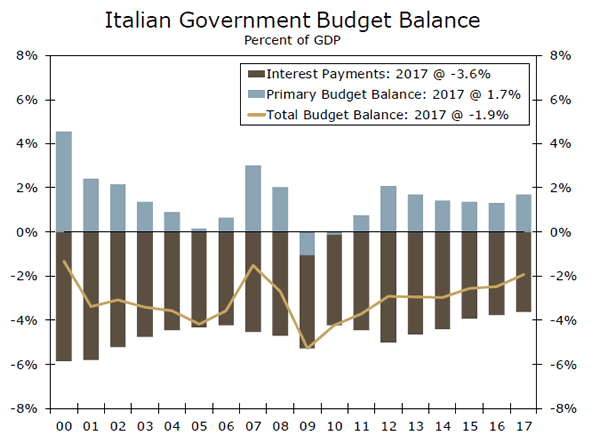
Against this backdrop, Italy's sovereign bond yields have remained elevated, and spreads over German yields are at multi-year highs. A sustained increase in interest rates presents an additional challenge for Italian public finances. Italy's government is actually running a primary budget surplus at present (that is, revenues exceed noninterest expenditures), highlighting the extent to which interest costs on Italy's sizable stock of debt weigh on public finances (middle chart). For now, interest rates have not risen so much that they surpass the levels of 5-10 years ago. As a result, much of the debt maturing today is still being refinanced at lower rates (See chart on front page. For reference, the weighted average maturity of Italian debt is about seven years.). However, another sizable leg up in bond yields that is sustained over time could start to pressure policymakers' assumptions for the next few years, making the deficit target even harder to hit.
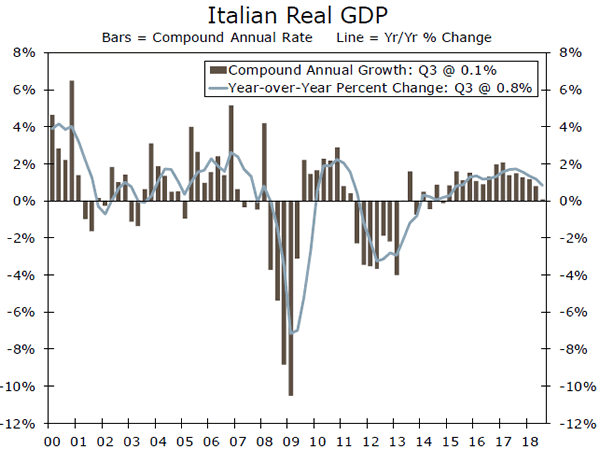
Complicating matters further, real GDP in Italy has been decelerating over the past year, and growth was barely positive in Q3 (bottom chart). Though we do not explicitly forecast Italian GDP, we do expect Eurozone growth more broadly to rebound modestly from its recent slowdown. Still, the momentum Italy had a year or so ago has clearly faded, making debt-reduction and growth targets all the more challenging to meet.
So what happens next? Today, the European Commission took another step towards an excessive deficit procedure (EDP) against Italy. In short, an EDP could be officially launched at some point in the next couple months, at which point Italy would have somewhere between three to six months after that to bring its fiscal trajectory in line with the European Commission's demands. This timeline implies the process could come to a head sometime in mid-2019. Were Italy to continue to defy Brussels after this time has elapsed, the country could be subject to a penalty of 0.2% of its GDP, with growing penalties over time possible in the face of continued defiance by Rome.
Both parties, however, have multiple points along the way at which a compromise could be reached and financial penalties avoided. For now, neither side seems willing to blink, suggesting Italian bond yields will remain elevated for the time being and Italian budget headlines will continue to crop up over the course of 2019.
Global Outlook
India GDP • Friday
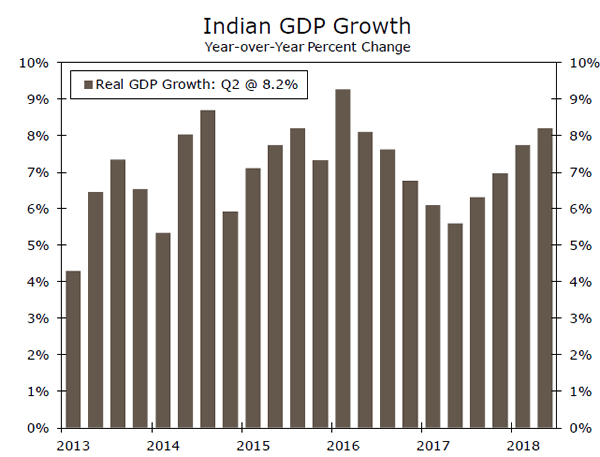
Amid concerns about a global growth slowdown, the Indian economy has been an outperformer of late. Real GDP in India has accelerated on a year-over-year basis in four consecutive quarters. Indian policymakers undertook a series of structural economic reforms over the past few years that, in part, led to a slowdown in growth. The drag on growth from these disruptions is clearly fading, however, and the long-term benefits combined with India's favorable demographics suggest a positive outlook for the near-term and for potential growth.
That said, the Indian economy is not without its challenges. At present, consumer price inflation is just 3.3%, below the Reserve Bank of India's target band of 4-6%. Budget deficit concerns continue to linger in the background, and a power struggle between the government and the central bank has been playing out in recent weeks. We expect Indian real GDP to continue to grow faster than both the global economy as a whole and its Chinese counterpart.
Previous: 8.2% (Year-over-Year)
Eurozone CPI • Friday
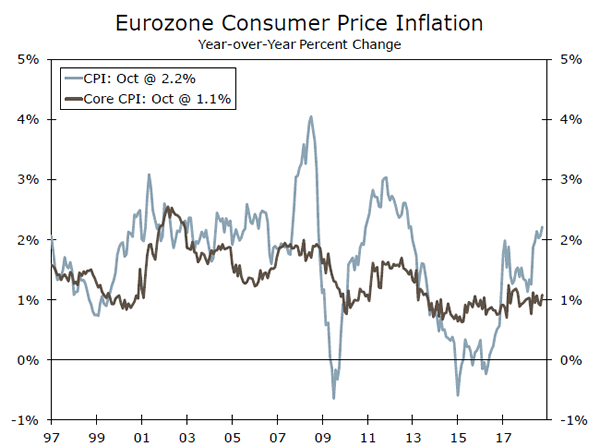
Though headline consumer price inflation in the Eurozone has surpassed 2%, core inflation has held very steady, hovering within +/- 0.1 percentage point of 1.0% since May. Though economic growth has slowed this year, it has remained above most estimates of potential growth, helping to drive additional tightening in the labor market. At 8.1%, the unemployment rate in the Eurozone has fallen half a percentage point thus far this year and is at the lowest level since 2008.
Monthly asset purchases by the European Central Bank declined from €60 billion a month to €30 billion a month to start 2018, and it looks likely that asset purchases will end entirely by the start of 2019. Our forecast assumes that going forward economic growth in the Eurozone levels off just shy of 2%, and that inflation strengthens enough that the ECB begins the next phase of normalizing monetary policy by hiking short-term interest rates in H2-2019.
Previous: 2.2%
G20 Summit • Friday/Saturday
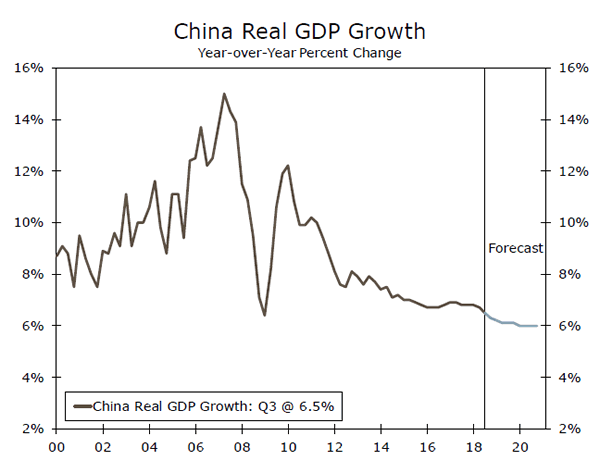
The Group of Twenty (G20) Summit takes place next week over Friday and Saturday in Buenos Aires, Argentina. The G20 summit is always an important event, as the leaders of the 19 countries and the European Union represent 85% of global economic output and two-thirds of the world's population.
This year, however, the summit has garnered additional attention as it appears that President Trump and Xi Jinping, the President of China, will meet to discuss the ongoing trade spat between the two countries. At present, the previous round of tariffs the United States place on $200 billion of imports from China are set to see an increase in the tariff rate from 10% to 25% on January 1. President Trump has further threatened tariffs on the remaining $267 billion in imports from China. Continued escalation between the two countries would represent an additional headwind to global growth headed into 2019, while progress towards a resolution would be a tailwind.
Point of View
Interest Rate Watch
Higher Mortgage Rates Hit Housing
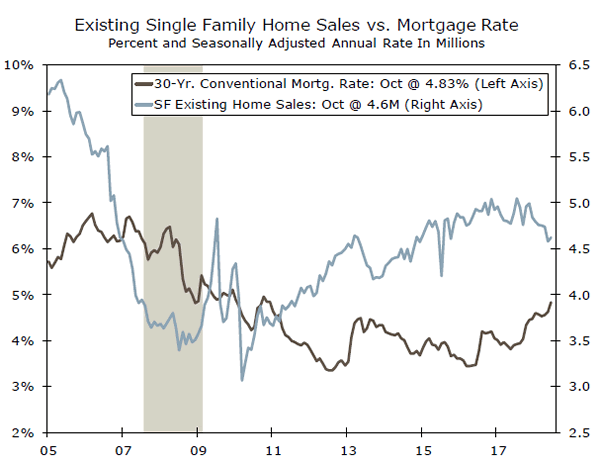
Rising mortgage rates are likely playing a role in the recent housing market slowdown. Over the past six months, sales of both new and existing homes have weakened and home prices across the country have begun to moderate. This week also presented further evidence of a housing soft patch, as the NAHB/Wells Fargo Housing Market Index showed the sharpest drop in homebuilder confidence in nearly five years. Meanwhile, mortgage purchase applications have trended lower recently, falling 1.1% over the past year on a four-week moving average basis through the week of November 16.
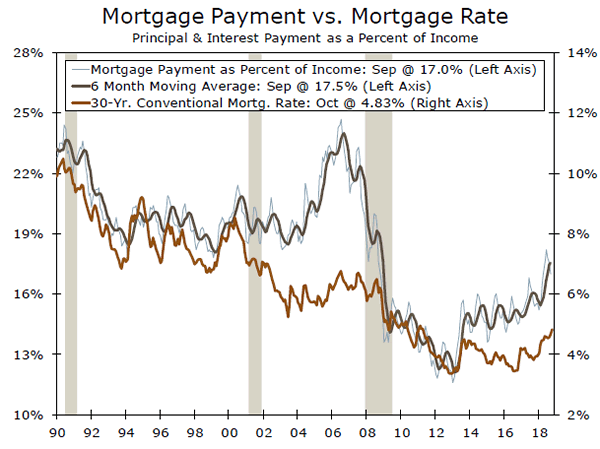
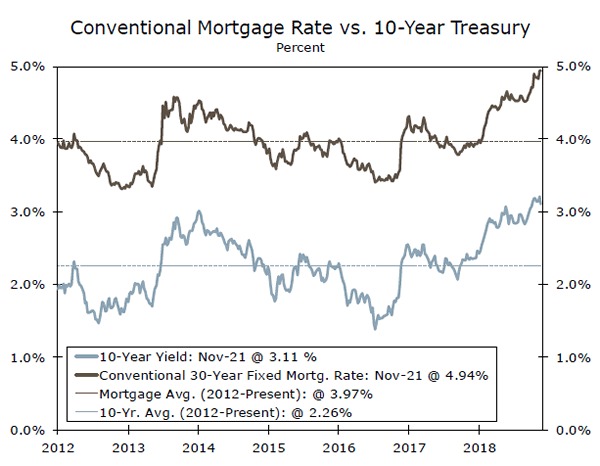
Deteriorating affordability via the combination of higher home prices and rising mortgage rates is clearly having an impact. Over the past 12 months, the 30-year conventional mortgage rate has increased by nearly a full percentage point, rising from 3.89% to 4.94% through the first three weeks of November, the highest level since 2011. By historical standards, this still represents a relatively low rate. In fact, mortgage rates have been extremely low for much of the expansion. The 3.65% averaged in 2016 was not only the lowest of the cycle, but the lowest rate going back to 1971. Over that same period, the 30-year mortgage rate has averaged 8.10%, reaching as high as 16.65% in 1982. Still, the recent uptick represents a relatively significant increase. The average mortgage payment as a percent of income recently hit a cycle high of 17.6%.
Higher mortgage rates will likely continue to be a headwind for housing. The housing market is one of the most interest ratesensitive sectors of the economy and a primary transmission mechanism for monetary policy. As overall economic growth has continued to be solid, we anticipate that the Fed will continue to gradually hike the federal funds rate over the next year. Mortgage rates also tend to closely track 10-year Treasury yields. Since 2009, the spread between the conventional 30-year mortgage rate and the 10-year Treasury yield has averaged roughly 170 basis points. Given that we anticipate rates to rise across the entire Treasury curve in coming quarters, mortgage rates should continue to move higher through 2019.
Credit Market Insights
Stuffed with Debt?
Surging corporate credit spreads and equity market volatility over the past two weeks have raised concerns about financial conditions heading into the end of the year. We learned this week that aggregate household debt reached a record high for the 17th consecutive quarter, as total liabilities rose 1.6% to $13.5 trillion in Q3, according to the New York Fed's Quarterly Report on Household Debt and Credit. Are U.S. households in a vulnerable positon after overindulging in debt? On the contrary, household debt as a percentage of disposable income remains near a twodecade low. Moreover, the portion of debt in some form of delinquency rose slightly over the quarter to 4.7%, but remains quite low by historical standards. Two main takeaways—household leverage has not returned anywhere near pre-recession levels, and households are relatively well positioned to service this debt.
With the Fed seemingly intent on marching ahead with rate hikes, it is not altogether surprising that corporate credit and equity markets are experiencing some late cycle anxiety. Financial market jitters aside, household financial balances are not flashing any particularly ominous warning signs—yet. The majority of household debt is in fixed rate mortgages, many of which were refinanced to lower rates postrecession, and wage growth has finally breached 3% amidst a very strong labor market. As households gather around the table this week, the fundamentals remain supportive of optimism—for now.
Topic of the Week
Some Food for Thought on Inflation
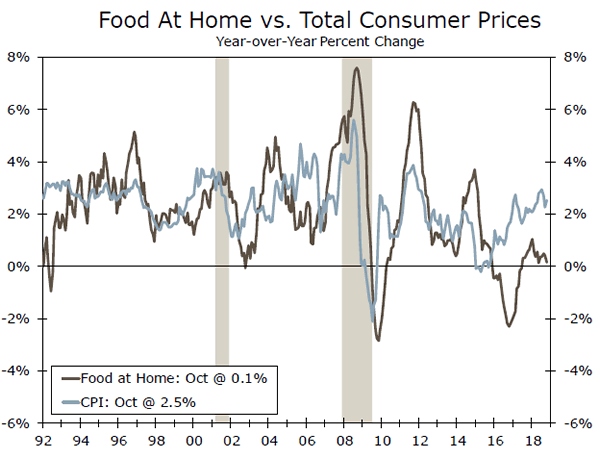
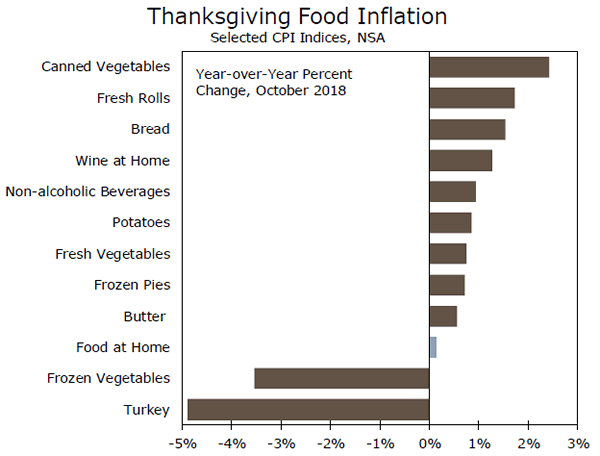
As inflation has turned up this year, one area households are catching a break is prices at the grocery store. The Consumer Price Index is up 2.5% over the past year, but prices for food at home are up just 0.1%. That continues a multi-year trend in which food has trailed broader inflation (top chart). Intense competition at the grocery store and low prices for many agricultural commodities amid what seems to be ever-larger harvests have been holding down food prices. Retaliatory tariffs on agricultural and livestock products have only added pressure. Prices of soybeans, a common ingredient for livestock feed, are at the lowest levels in more than a decade, while pork prices are at a five-year low.
With food prices under the gun, Thanksgiving should be a bit less expensive this year. The American Farm Bureau Federation's informal survey estimates the price of dinner this year is down 0.4% this year, which is the third consecutive decline. Many common Thanksgiving items are actually up over the past year, with a notable exception: turkey (bottom chart). Lower feed prices have pushed Turkey prices down 4.9% over the past year.
The CRB food index, which leads food at home by about six months, is down about 4% over the past year and suggests grocery store prices will continue to weigh on headline inflation in the coming months. More generally, lower commodity prices, driven in part by the dollar remaining strong and global growth slowing, have dialed back expectations for inflation next year.
The deteriorating global inflation dynamics represent a downside risk to inflation next year, along with the slowdown in housing hitting the sizeable shelter component of inflation. But there are upside risks to inflation next year as well. Tariffs and capacity constraints could push inflation higher than our current expectation for core PCE inflation to average 2.2% in 2019. For a deeper discussion on inflation risks in the year ahead and the Fed's expected reaction, see Will Goldilocks Inflation Stay in 2019?.
Eurozone PMIs to Signal Even More Dovish ECB?
November’s eurozone flash manufacturing and services PMIs, as well as the composite measure that blends the two sectors, are due on Friday at 0900 GMT. The prints are not expected to reflect a pickup in euro area economic activity during Q4, while another disappointment in the figures will likely spur speculation for a relatively dovish ECB during its December meeting. Such an outcome would be euro-negative, to state the obvious.
Analysts’ preliminary estimates call for the manufacturing PMI to remain at 52.0 in November, its lowest since August 2016. The services and composite PMIs – the latter is viewed as a good overall growth indicator for euro area economies – are forecast at 53.5 and 53.0 respectively, which reflects marginal weakening compared to October’s 53.7 and 53.1. These would also constitute their lowest in more than two years. Overall, all three measures are anticipated to remain in expansion territory, though fail to deviate from the negative trend established in the beginning of 2018.
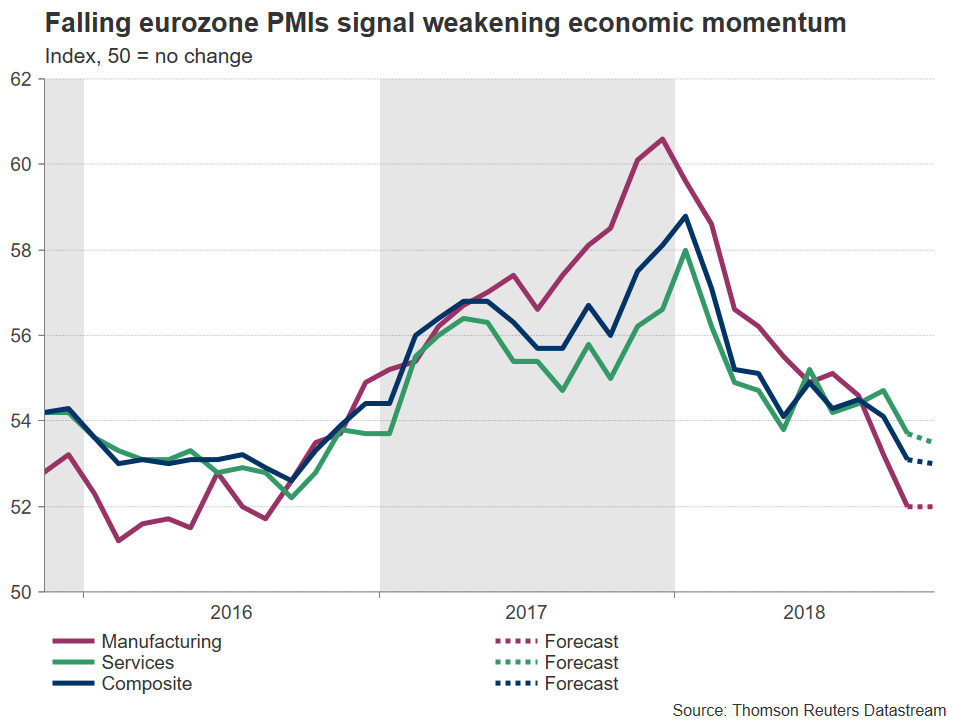
The Sino-US trade dispute and seemingly easing global growth have been seen as weighing on gauges such as the PMIs. Adding to these factors Brexit complications that further cloud the outlook for eurozone businesses, as well as the ongoing EU-Italy budget standoff, and the risk may be tilted to the downside as regards Friday’s data.
On the monetary policy front, should the readings project a gloomier-than-expected picture on Friday, then this could feed into the narrative of an ECB that is unable to begin its rate normalization process during the latter part of 2019, thus hurting the single currency. The ECB meeting on December 13 will provide more insights on the Bank’s thinking, with fresh staff forecasts being made public during the gathering as well; downbeat PMIs may exert pressure on policymakers to downgrade their growth forecasts.
Diverting back into economic releases, it should be kept in mind that Germany (0830 GMT) and France (0815 GMT), the two largest economies in the eurozone, will also see the release if their corresponding flash PMI readings on Friday. It is not unusual for traders to use these numbers to speculate on how the euro-wide figures will come out a few minutes later, positioning themselves accordingly.
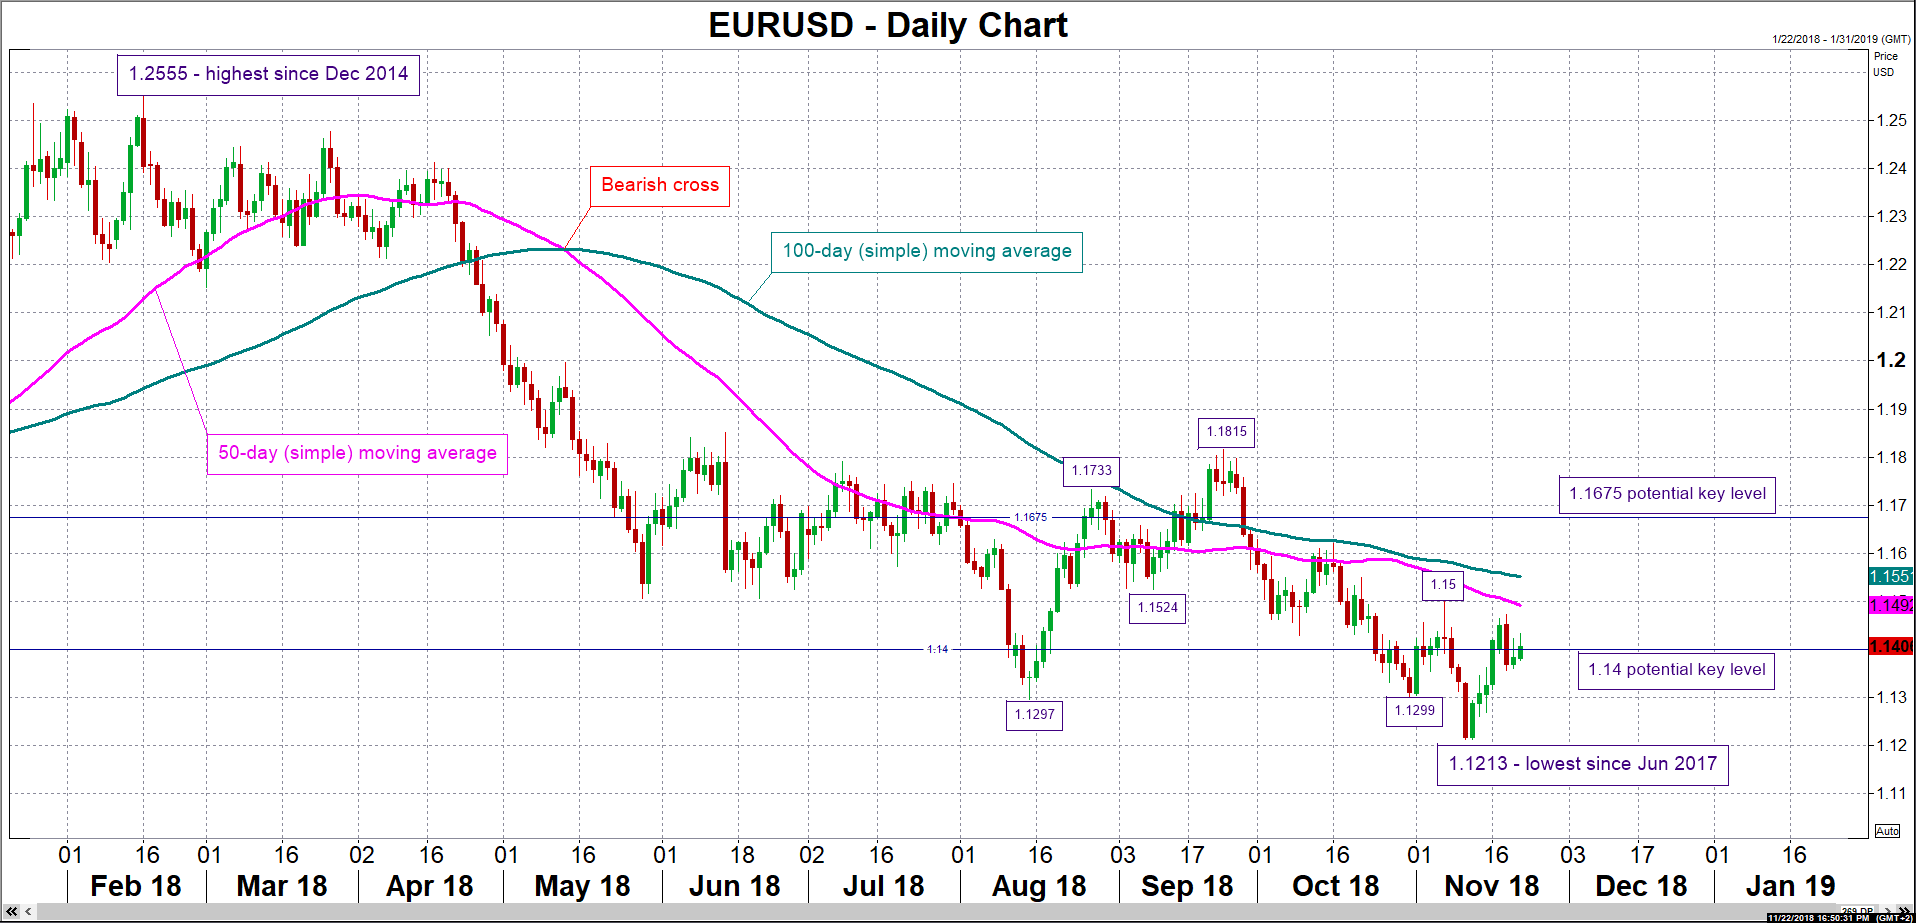
In FX markets, disappointing data may spur a decisive move below the 1.14 handle for EURUSD. In this case, the 1.13 mark would come in focus as potential support, with the area around it capturing a couple of bottoms from previous months at 1.1297 and 1.1299. Lower still, 1.1213, the pair’s lowest since June 2017 hit on November 12 would come within scope. Conversely, upbeat numbers spurring long positions in EURUSD may see the pair finding resistance around 1.1492, the current level of the 50-day moving average line; the region around this point captures a top (1.15) and a bottom from the recent past (1.1524), while not far above lies the 100-day MA at 1.1551. Higher still, a zone of congestion previously in 2018 around 1.1675 would increasingly come in focus.