Sample Category Title
Australia & New Zealand Weekly: Mixed Signals on Housing but Adjustment Process Seems Likely to Have Further to Run
Week beginning 19 November 2018
- Mixed signals on housing but adjustment process likely to have further to run.
- Australia: RBA Governor Lowe speaks, RBA Minutes, Westpac-MI Leading Index.
- NZ: net migration.
- Europe: ECB minutes, EU Brexit Summit.
- UK: BOE Governor Carney speaks.
- US: Thanksgiving, durable goods orders, housing starts and building permits.
- Flash PMI's for Japan, Europe and the US.
- Key economic & financial forecasts.
Information contained in this report current as at 16 November 2018.
Mixed Signals on Housing but Adjustment Process Seems Likely to Have Further to Run
The Westpac Melbourne Institute Index of Consumer Sentiment rose 2.8% to 104.3 in November from 101.5 in October.
That was a surprisingly strong result. In particular, respondents are much more positive about their own finances. That is despite consistent reports around weakness in the housing markets in the major capitals and the sharp falls in the equity market through October. Low interest rates and their prospect of being sustained for some time are clearly supporting confidence. For example, the confidence of those respondents with a mortgage increased by 4.3%. However, on a more cautionary note, measures of spending intentions have been weaker.
Consumer views around housing were very interesting. Buyer sentiment improved sharply but price expectations fell to new lows.
The 'time to buy a dwelling' index posted a strong 11.8% surge to be up 16.7% on a year ago to the highest level since March 2015. Consumers in NSW showed a particularly strong gain with a 26% jump taking the state index to a five year high and suggesting the decline in Sydney house prices is starting to generate some interest from buyers. Because the NSW Index has been so low, this stunning improvement only restores the Index to just below its long term average. The other state, Victoria, where prices have recently shown significant weakness, improved only modestly with "Time to Buy" up only 3.3%.
Consumer expectations for house prices posted another fall in November. The Westpac Melbourne Institute Index of House Price Expectations fell 2.3% to 99 – on par with the weakest read we have ever seen on this index, when it was first compiled back in May 2009. The state detail continues to show particularly weak reads in NSW and Victoria, both hitting new lows in November with Victoria's index down 25% over the last three months alone. The house price corrections underway in Sydney and Melbourne now look to be firmly embedded in consumer expectations.
In this cycle, Sydney dwelling prices have already fallen by 8.7% while prices in Melbourne are down by 5.1%.
New lending for housing is also contracting. New lending for "upgraders" (owner occupiers excluding First Home Buyers) has fallen by 13.2% over the last year (October 2017 to September 2018) but more significantly has fallen by 10.7% in the two months to September.
New lending to investors peaked in December 2016 and has fallen by 25.9% in the year to September 2018 and 4% over the last two months.
These developments have largely reflected stretched affordability (on the demand side) in the two cities and tighter lending policies from the four major banks (on the supply side).
Households now expect house prices to continue to fall. The Westpac Melbourne Institute Index of House Price Expectations has fallen by 39% for NSW and 41.5% for Victoria over the last year. Both indexes moved from prints which indicated that optimists strongly outnumbered pessimists (134 for NSW and 144 for Victoria) to positions where pessimists outnumber optimists (82 for NSW and 84 for Victoria). Note that any read below 100 indicates a majority of pessimists.
Furthermore these current levels are the lowest we have registered since Westpac and the Melbourne Institute first started this question in the Consumer Sentiment survey in May 2009.
Westpac also calculates measures of housing affordability. These relate to the proportion of income required to accumulate a deposit and service a loan which is 75% of the median house price. These measures of affordability can vary around assumptions related to the time required to accumulate the deposit and whether the 75% is a reasonable assumption.
Based on the estimates being used we assess that affordability in both NSW and Victoria is more stretched than we saw in the previous periods which preceded falls in house prices – 2008/09 and 2010/11.
Peak to trough in those previous periods were falls of 6.4% (Sydney) and 8.7% (Melbourne) in 2008/2009 and 3.4% (Sydney) and 8.2% (Melbourne) in 2010/2012.
The restoration of affordability in those previous periods came through falls in interest rates and house prices while income growth also contributed. Wages growth was running at around 4% in both periods. That compares with current wages growth of 2.3%.
In the 2008/09 period the RBA cut the cash rate by 425 basis points from 7.25% to 3%; in the 2011/12 period it cut rates by 175 basis points from 4.75% to 3.00%. The challenge with this particular cycle is that the RBA appears to be absolutely committed to the next move in rates being up.
So in those previous periods affordability and demand were restored through a combination of income growth; substantial rate cuts; and price adjustments. In this current period the responsibility for a restoration of affordability will fall mainly to price adjustments.
The Consumer Sentiment Report indicated that the "Time to Buy a Dwelling" Index had lifted significantly in the weak NSW market.
That might imply that despite continuing stretched affordability, prospective buyers may be considering re-entering the market. That does seem surprising given the downbeat price expectations and stretched affordability.
However, as discussed, in this cycle there is another complication.
We have a different environment from the perspective of credit supply. Banks have tightened credit conditions such that when demand for credit recovers (as may be implied by the "Time to Buy" index for NSW) it may not be as simply accommodated as was the case in those previous periods.
This will complicate the usual adjustment process. Markets stabilise when prospective buyers feel encouraged to re-enter the market. Affordability returning to equilibrium and price expectations turning positive are generally the triggers for markets to recover. The "Time to Buy" index for NSW is sending an encouraging early signal but if prospective buyers are unable to secure adequate funding to enter the market, the move to the new equilibrium may be more extended.
In summary it is apparent that this cycle is quite different to the two previous down cycles for dwelling prices. Affordability is more stretched and sources of adjustment are more restricted. Furthermore, credit conditions indicate that a recovery in affordability and demand may not be accommodated through credit supply in the same way we saw in previous cycles.
The week that was
Labour market data provided two contrasting perspectives on Australia's economy this week. Meanwhile, consumer sentiment strengthened, and business conditions remained above average.
Following last month's 5.0% unemployment rate, a level historically regarded as consistent with full employment, the Australian labour force survey for October was keenly awaited. It certainly did not disappoint, with the unemployment rate remaining at 5.0% despite a partial reversal of the 0.2ppt decline in participation seen in September. On a multi-month basis, it is employment not participation that is driving the unemployment downtrend. At October, annual employment growth stood at 2.5%yr, nearly a percentage point above population growth. Furthermore, those gains have largely been full-time in nature.
The above trend is favourable for household income growth, increasing aggregate hours worked across the economy and reducing slack. However, this tightening of the labour market is yet to stoke wages growth. In the September quarter, the wage price index rose just 0.6% (2.3%yr) and was weaker still for the private sector at 0.5% (2.1%yr). Arguably this disconnect between wages and employment growth is in part due to considerable underemployment (those working less hours than they would like to). That said, the current level of underutilisation is historically consistent with wages growth around 2.5%yr, not the 2.1%yr currently being seen in the private sector. Herein is evidence of other factors being at play, principally globalisation; technology; and a focus on efficiency amongst large corporates.
In terms of the outlook for wages, it is troublesome that the states of NSW and Vic, who have seen a more aggressive downtrend in unemployment and underemployment, are also yet to see a substantial lift in wages growth, respectively 2.2%yr and 2.5%yr at September.
The enduring disconnect between wages and employment arguably is a key reason why family finance perceptions continue to lag households' economic and labour market expectations; and now, even as family finance views are shifting to above long-run average levels, why 'time to buy a major household item' is at 18 month lows and spending intentions for Christmas are the weakest they have been since 2014. House price expectations, which are now on par with their lowest ever level back to mid-2009, are decidedly unfavorable for spending, as is the pressing cash-flow reality of high household debt. Weakness in consumer spending was also evident in the NAB business survey for October, particularly in NSW. That said, while confidence is now below average in aggregate, conditions for businesses remain above average overall on the back of robust trading conditions and profitability.
Moving offshore, data released this week for China points to the investment trend having troughed. That said, the acceleration in activity will be slow in coming amid headwinds from ongoing structural change in the finance sector and, to a lesser extent, uncertainty associated with trade policy. On that front, murmurs of the US' being willing to compromise with China on trade bolstered markets overnight. President Trump will meet President Xi at the end of the month. The hope is that this conversation can turn the tide and stop any further intensification of tensions. This would only be a starting point for negotiations however. Many hurdles must be overcome for a lasting solution to be attained.
For the US, data has been light but broadly supportive of the ongoing robust, non-inflationary uptrend in activity continuing, with the CPI benign in October (annual core inflation at 2.1%yr) as retail sales beat expectations (0.8%). Admittedly retail sales were bolstered by Hurricane season replacement spending in October and higher oil prices in the month, but underlying momentum remained robust. Chair Powell again showed confidence in the US economy and the outlook this week despite weakening residential investment and uncertainty over the lasting benefit of fiscal policy to growth. Recent market volatility is not a material concern, nor are global risks and trade tensions. But all are being watched closely. The move to hold a press conference after every FOMC meeting and to review "strategies, tools and communication practices" highlight a desire by Chair Powell and the Committee to be more nimble as this cycle matures.
For Europe (and the UK), Brexit has again been the focus. A brief respite from Brexit uncertainty was seen mid-week as the UK Cabinet rubber stamped a transition deal agreed by UK and European negotiators. But multiple ministerial resignations the day after consequently put Prime Minister May's position and the deal in jeopardy. It is not at all clear if the current deal will remain let alone what a replacement deal might look like. Of course the final deal, whatever its terms, then has to be passed by both the UK and EU parliaments. On the Italian budget, the Government has remained steadfast in not adjusting the proposal in response to disagreement from the European Commission. Whether the European Commission goes through with imposing infringement penalties will be of key interest in the weeks ahead.
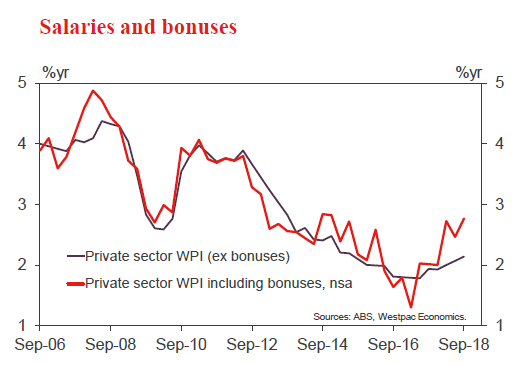
Chart of the week: Australian wages including bonuses
It is worth noting that a cyclical indicator of wage momentum continues to look a bit more positive. Private sector wages including bonuses lift to 2.8%yr from 2.5%yr in Q2 and 2.7%yr in Q1. This is still above the wages and salaries only pace and the fastest pace in almost 4 years.
Bonus payments tend to be pro-cyclical so this could be seen as a positive leading indicator of a broader lift in wages sometime soon (variable components of remuneration are adjusted more frequently to changes in economic conditions than base wages).
But we note this is a very volatile series and at this stage it appear employers are adjusting variable compensation where they have to rather than lifting base wages and salaries.
New Zealand: week ahead & data wrap
Here we go
Falling mortgage rates have grabbed headlines this week, with some fixed-term mortgage rates now near the historic lows of 2016. This is what we predicted a few months ago. The next step is that the housing market will get a boost, albeit a temporary one. Indeed, October housing market data suggested that this lift may already be in train. The RBNZ is still likely to be fairly comfortable with activity in the housing market and will be contemplating loosening its LVR restrictions further. This could be announced as soon as the November Financial Stability Report, and will offer further support to house prices.
Fixed mortgage rates fell over the last few months on the back of lower wholesale rates following the Reserve Bank's more dovish tone. Competition amongst banks has pushed some fixed-term mortgage rates even lower this week in some cases to record lows.
Since August we have been predicting that lower mortgage rates would provide a temporary fillip to the housing market. Now signs of a bit more life in the housing market are coming through. October REINZ data showed a 9.3% jump in house sales in the month, leaving sales up 15.5% on a year ago. In reality, the true lift is likely to be even larger. REINZ house sales data tends to be revised upward over time, as sales data continues to trickle in from real estate agents after the data is first released.
In addition to this lift in sales, there was a drop in the average number of days taken to sell a house. This fell from 38.2 to 37.2 (seasonally adjusted), taking this measure to its lowest level since May. This adds further weight to our view that activity in the housing market has perked up.
House prices remained relatively subdued in October, up 0.4% in the month and 3.8% higher than a year ago. Scratching beneath the surface, it's clear that there has been a modest acceleration in house price growth recently with average growth over the last three months noticeably higher than the three months prior.
Much of the acceleration in both activity and prices is coming from Auckland and Canterbury. Yet even with the most recent improvement, annual house price growth in Auckland of -0.4% is much weaker than remainder of the country at 7.9%. It's even further behind current hotspots like Otago and Southland where annual house price inflation is running at 11.6% and 15.1% respectively.
Rising sales is a reliable sign that price inflation will soon accelerate. We remain of the view that quarterly house price growth will pick up noticeably in the first quarter of next year. But we remain at pains to emphasise that the anticipated nearterm boost to the housing market will be only a temporary shot in the arm. There appears to have been little direct impact from the foreign buyer ban in the October data. However, over a longer horizon, restrictions on foreign buyers combined with the extension of the Bright Line test is set to make housing a less attractive investment proposition. Next year, the changes to rules around the tax deductions for property investors are set to impact the market. In addition, the debate surrounding capital gains tax (or any other tax changes) is likely to intensify with the release of the Tax Working Group's final recommendations (slated for February 2019) and as the 2020 election draws closer. Combined with an eventual lift in mortgage rates and slowing population growth, we think this will see annual house price inflation slip into negative territory by mid-2020.
Short term gyrations aside, the slowdown in the housing market over the course of 2018 (unsurprisingly) coincided with a slowdown in credit growth. Mortgage lending grew 6% in the year to September, slightly slower than the 6.4% growth the year earlier, and a significant step down on the 9.1% growth in mortgage lending in the year to September 2016.
This slowdown in credit growth will be one factor considered by the RBNZ as it ponders whether the current LVR settings remain appropriate. In a speech this week titled "Financial Stability – risky, safe or just right?" Deputy Governor Geoff Bascand said "we expect to gradually ease the [LVR] policy in coming years." We think that the RBNZ could ease the LVRs at the November Financial Stability Review, due on the 28 November, as their concerns about financial stability have eased already.
It is not just that credit growth and house price inflation are lower than they were. Bank lending is also substantially less risky – the stock of loans with a loan-to-value ratio over 80% has fallen from 20.7% before the LVRs to 6.7% now. Furthermore, regulators in both New Zealand and Australia have prompted the banks to become more selective about who they will lend to. And the housing market is being regulated directly by the likes of the Bright Line Test and other tax changes. The Reserve Bank will probably conclude that there is now less need for LVRs to do so much of the work in ensuring financial stability.
Any changes to the LVR rules are likely to be incremental. Banks are currently restricted to a speed limit whereby 15% of new loans can be made at a loan-to-value ratio greater than 80%. That speed limit could be lifted to 20%. The effective LVR cap on investor lending could also increase, from 65% to 70%. If this occurs, it could add further momentum to the housing market. The last loosening of the LVR rules saw system-wide high LVR lending rise quite sharply, and coincided with a distinct lift in the housing market.
Data Previews
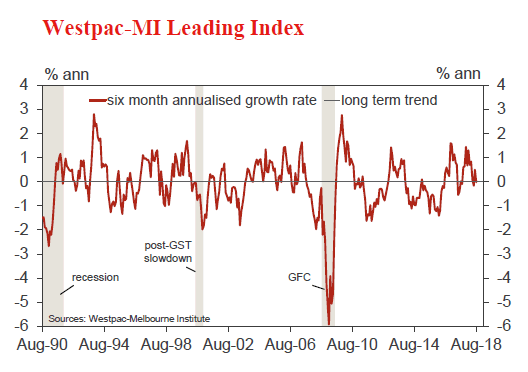
Aus Oct Westpac–MI Leading Index
- Nov 21, Last: +0.21%
The six month annualised growth rate in the Westpac–Melbourne Institute Leading Index, which indicates the likely pace of economic activity relative to trend three to nine months into the future, lifted from –0.02% in August to +0.21% in September. Despite the lift back above trend, the Index growth rate continues to point to slowing momentum heading into year end, the pace slowing from an average 0.89% read over the seven months to April to 0.13% over the five months since.
The index will include a very mixed range of component updates this month. On the negtative side, the ASX200 fell sharply, down -6.1% vs -1.8% last month. However, other components mostly firmed, with the Westpac-MI Consumer Expectations Index up 4.7%; commodity prices up 3.7% in AUD terms and dwelling approvals recovering some lost ground, up 3.3% vs -8.1% in last month. Other components also look to have been mostly positive as well.
Week Ahead – Italy and Brexit Risks to Remain Elevated ahead of Thanksgiving Weekend
The coming week will be an unusually quiet one for economic releases but political developments in Britain and Italy will likely provide plenty of volatility for traders. As the UK prime minister, Theresa May, scrambles to save her Brexit deal and the European Commission ponders disciplinary action against Italy, it’s looking like another choppy week for the pound and euro. As for the upcoming data, the focus will be on flash PMIs for the Eurozone, and inflation figures out of Canada and Japan. US housing numbers could also attract attention following the Fed’s Powell citing some concerns this week.
Japan to publish trade and CPI data
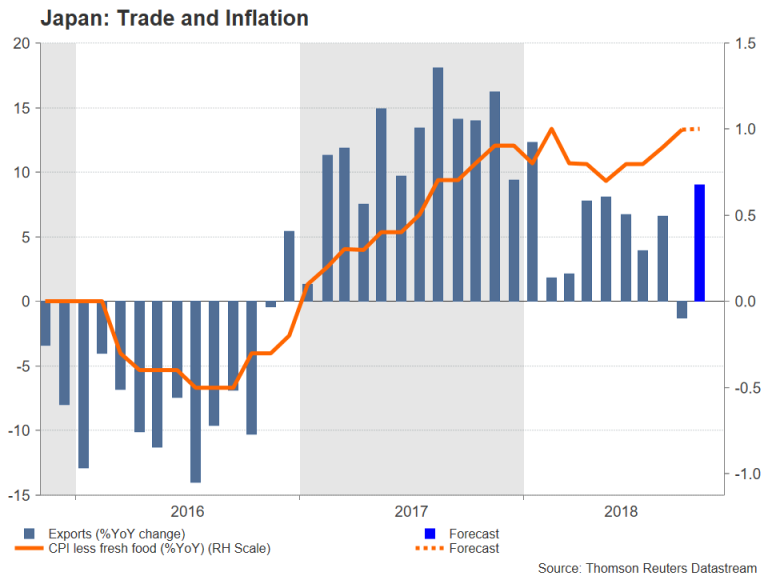
Investors will be looking at the latest trade numbers out of Japan on Monday to gauge how exports performed at the start of the fourth quarter following the past week’s GDP data that revealed the Japanese economy contracted by an annualized rate of 1.2% in the third quarter. Exports fell by 1.8% during the quarter, dragging on growth. They are forecast to have rebounded by 9% year-on-year in October.
On Wednesday, inflation figures will follow and will probably highlight yet again the Bank of Japan’s slow progress in achieving its 2% price target. The core rate of CPI, which excludes fresh food prices and is tracked by the BoJ, is expected to have risen by 1.0% y/y in October, unchanged from the prior month. Also important will be the Nikkei/Markit flash manufacturing PMI for November on Friday.
The yen could firm a little if the above figures are supportive of a stronger Q4. However, any steep appreciation is more likely to be due to risk-off flows than from strong data.
Quiet week for the aussie and kiwi
The Australian and New Zealand dollars are on track for a third week of gains as recent encouraging data and easing trade tensions have bolstered the antipodean currencies despite broader market risk sentiment remaining fragile. However, they could struggle for direction in the coming days in the absence of major releases.
The Reserve Bank of Australia’s minutes of its November 6 policy meeting due on Tuesday could be of some help for the aussie. The central bank is expected to reiterate its upbeat growth forecasts, while remaining cautiously optimistic about a gradual pickup in inflation. Strong employment numbers this week underscored the RBA’s positive outlook.
The kiwi has performed even better than its aussie counterpart, rising to a 3½-month high of $0.6841 on the back of improving economic indicators for New Zealand. The next focus for the kiwi will be third quarter producer prices on Tuesday.
Euro’s weak upside at risk from more poor PMIs
The euro managed to find a floor slightly above the $1.12 level this week, helping it regain posture to recover towards the $1.13 handle. However, this may be just a temporary reprieve for the single currency, which faces the risk of more downside from next week’s flash PMI estimates, due Friday. The euro area’s composite PMI – considered to be an accurate barometer of economic activity – fell to a two-year low in October. It is expected to deteriorate further in November, declining to 53.0 from 53.1 in the preliminary reading. The services PMI is also projected to fall in November, but no change is forecast for the manufacturing PMI.
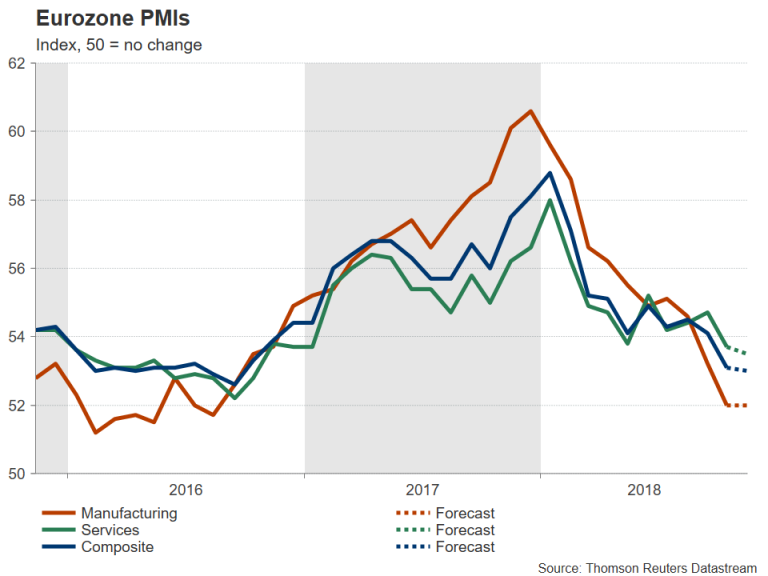
In other data, Germany’s second GDP print for the third quarter, also out on Friday, is anticipated to confirm that the Eurozone’s largest economy shrank by 0.2% quarter-on-quarter during the period.
With the Eurozone economy continuing to lose momentum throughout 2018, the European Central Bank is nonetheless pressing ahead with winding down its asset purchases by year-end. Analysts will be scrutinizing the minutes of the ECB’s October policy meeting on Thursday for any inclination by policymakers to reconsider their plans given the weaker-than-expected growth performance of the region.
Another potential headache for the ECB is the clash between Italy and the European Commission over Rome’s plans to increase the budget deficit to 2.4% in 2019, well above the previous government’s commitment. The Commission has until November 21 to decide whether Italy’s revised budget submitted this week is in compliance of EU fiscal rules or if it should take the first steps in disciplinary action.
Pound to stay in spotlight regardless of bare UK calendar
Political tensions in Westminster over Brexit are sure to guarantee further gyrations in the pound in forex markets next week even though there will be no significant data releases out of the UK. Indications that Prime Minister May is headed for defeat in a possible no-confidence motion would be strongly negative for sterling, which this week plunged to a two-week low of $1.2722 as several ministers resigned in protest to her Brexit plans.
The Bank of England will likely be the only distraction from Brexit for the British currency next week as the governor, Mark Carney, and other Monetary Policy Committee (MPC) members will testify before the Treasury Select Committee in Parliament on Wednesday. Carney will probably want to steer clear of the Brexit topic but given the recent developments, could sound more cautious about the outlook for the UK economy, which would further weigh on sterling.
Canadian data to be highlight in North America
While the US will have the busiest calendar, it’s unlikely to be the main driver for the US dollar, whereas in Canada, domestic data could help the loonie claw back some of its recent losses. Starting with the US, investors’ attention early in the week will be on the housing market, which is showing signs of a downturn as rising borrowing costs make it less affordable for Americans to take out mortgages. The slowdown has captured the attention of the Fed Chairman, Jerome Powell, who this week said he was monitoring the situation. Building permits and housing starts for October are out first on Tuesday, followed by existing home sales on Wednesday. The former is expected to fall marginally, while the latter two are forecast to rise slightly in October from the prior month.
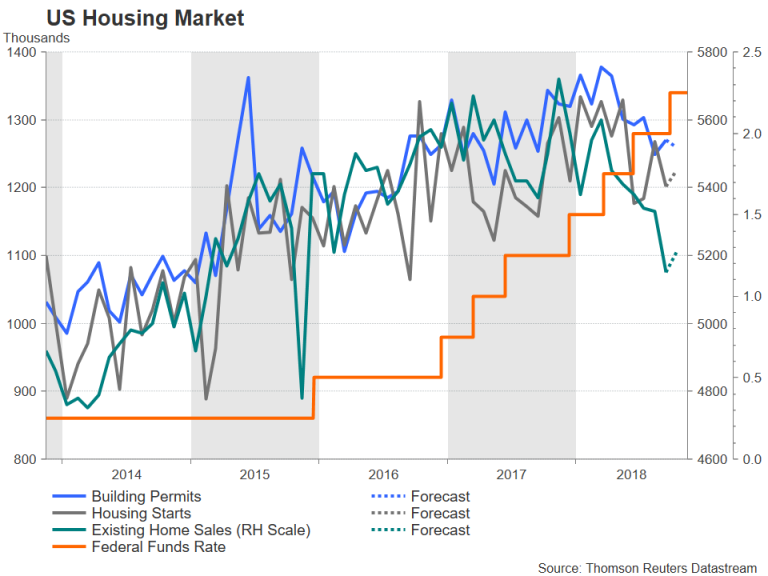
Also due on Wednesday are durable goods orders. They are anticipated to have dropped by 2.5% month-on-month in October. There will be no data on Thursday as the US market will be closed for Thanksgiving, while Friday will be a half-day.
Moving north of the border, traders will be watching the latest inflation and retail sales numbers out of Canada on Friday. Annual inflation moderated to 2.2% in September, but the Bank of Canada maintains that the risks are to the upside given the economy is close to full capacity. An uptick in CPI in October could put the BoC on course to raise rates again early in 2019. Retail sales figures for September will be published alongside the CPI report. A solid set of data could provide the Canadian dollar with a much-needed lift after slipping to 4-month lows this week on the back of the slump in oil prices.
Sunset Market Commentary
Markets
Global core bonds are mixed today with US Treasuries outperforming German Bunds. Calm returned to markets after the Brexit storm of yesterday. Core bonds opened neutral. Risk sentiment improved overnight, with WS and Asian equity markets gaining ground. European equity markets opened with gains as well but gradually edged lower throughout the day to eventually sink well below zero. German Bunds moved little higher. ECB president Draghi repeated that the Eurozone economy has lost some momentum but said the growth slowdown is only temporarily. US eco data were of second-tier nature and had little impact on trading. Industrial Production grew slower than expected in October with 0.1% (m/m), coming from a downwardly revised 0.2% in September. The speeches of Fed VP Clarida and governor Kaplan got more attention, pushing US Treasuries up. Clarida warned for the slowdown in global growth. He doesn’t expect a big pickup in inflation next year but said the Fed policy rate is certainly not at neutral yet. Kaplan said that the current tailwind from Trump’s fiscal policy could turn into headwind, once the sugar rush has phased out. Losses across the US curve varied from -0.6 bps (30-yr) to -4.6 bps (5-yr). German yield curve moves are limited between -0.1 bp (2-yr) and +0.5 bps (10-yr).
Equity markets suffer losses against the backdrop of today’s fragile/negative risk climate. The dollar however (again) fails to profit sustainably as has been the case quite often recently. The greenback faced some moderate intraday swings as currency traders lacked clear guidance. Things changed following Fed Kaplan’s and especially Clarida’s soft interpreted interviews. With Powell’s first ever comment yesterday about slower growth abroad and a waning fiscal boost still fresh in mind, it was enough for markets to ditch the dollar. Mixed US production data were no support for USD either. EUR/USD rebounded sharply from near intraday-lows around 1.132. At the time of writing the currency pair is testing the 1.14 mark (1.141). USD/JPY slid back below 113, at around 112.70.
After yesterday’s knockout blow, sterling entered calmer waters and traded in a narrow range. Markets are currently trying to assess what the latest disastrous Brexit developments mean going forward. In the next few days May will try to persuade MP’s of all factions to back the current deal. It remains highly uncertain however, if she will ever have the numbers. Markets also ponder the several scenarios that are back on the table (general elections, second referendum, a no deal or no Brexit at all). Each with a materially different impact and an increased likelihood compared to just a few days ago. Investors are in a wait-and-see mode as these dark Brexit clouds block the view of the near future. In an intraday perspective the pound, if anything, reversed earlier modest gains on several news headlines suggesting the quote (48 letters) to trigger a no confidence vote might have been met. EUR/GBP is currently trading at 0.886, virtually unchanged from yesterday’s close. Sterling edged higher vs. the dollar. Cable is changing hands at 1.287, supported by a softer dollar.
News Headlines
Fed speakers’ warnings on slowing growth abroad gain traction with vice-chair Clarida and Dallas Fed Kaplan joining Fed chair Powell and Atlanta Fed Bostic earlier this week. Clarida and Kaplan added that they don’t expect a strong uptick in domestic inflation. Both agree though that the Fed is still some rate hikes away from entering neutral territory. Growth warnings suggest that a pause in the quarterly rate cycle can occur somewhere in 2019.
ECB’s President Draghi explained in greater detail why the ECB still expects a vigorous acceleration in core inflation ahead. He labels the 2018 growth slowdown as temporary in nature, referring to one-off factors such as a disruption in the car sector and a return to normal of trade growth following an exceptional 2017.
Brexit Monitor: Decent Brexit Still Base Case But Uncertainty Has Risen
Key dates
- Very near term: Will there be a no-confidence vote in Theresa May? If the threshold of 48 letters is triggered, the vote may come very quickly.
- 25 November: Extraordinary EU summit on Brexit. Deal due to be signed.
- Mid-December (10 December has been reported): Vote on Brexit agreement in House of Commons.
- 13-14 December: EU summit.
- 20 December to 7 January: House of Commons recess due to Christmas.
In the very short term, we think it is important to keep an eye on two things.
- Will the DUP continue to support the government? Media reported (see Reuters) yesterday that the DUP is considering pulling its support for the government unless the Conservatives replace Theresa May as party leader. The DUP later denied this but, in our view, the genie is out of the bottle now and it is factor to look out for.
- Will there be a Conservative leadership challenge? The threshold of 48 letters to trigger a leadership challenge has not been reached yet but 20 Conservatives have stated publicly that they have sent a no-confidence letter. It is possible that some have sent a letter without saying so. We still think it is likely there will be a confidence vote.
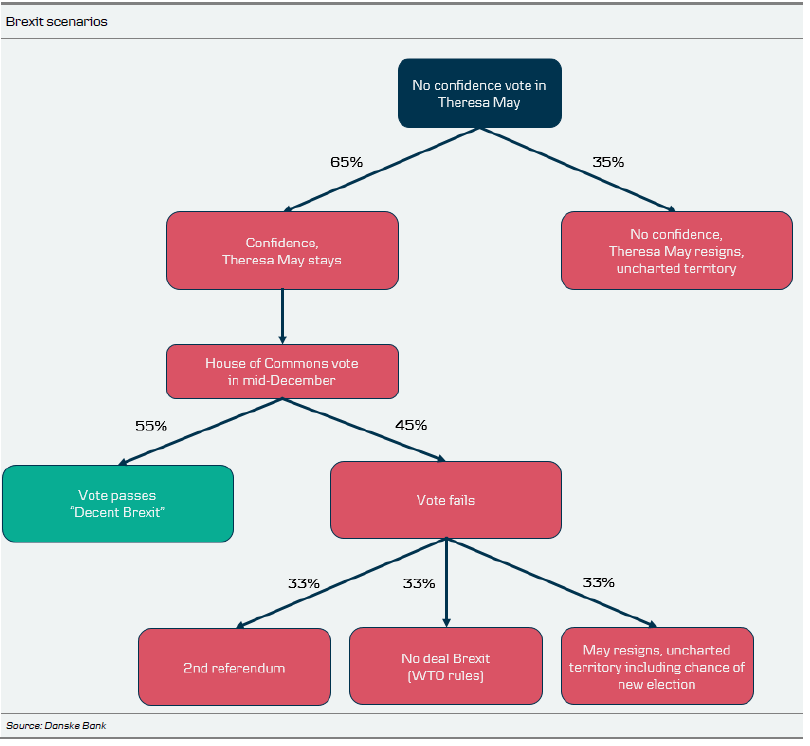
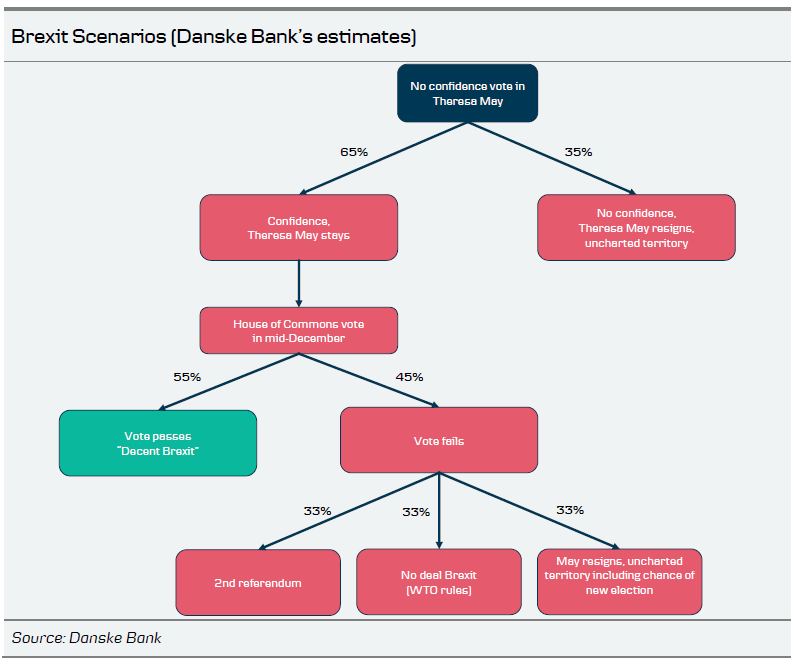
Based on developments this week, we have updated our Brexit 'game tree' (see overleaf). The first and most imminent issue is whether Theresa May will survive a possible leadership challenge. As we have argued for a long time, we think the hardliners are enough to trigger Theresa May but not enough to topple her. However, the risk is that if the hardliners get some tailwind more MPs will follow suit as politicians like to be part of the winning team. We think the probability of Theresa May winning a confidence vote is 65%. If she loses, she would have to resign and we would be in uncharted territory where many outcomes would be up in the air. It is difficult to say who would succeed May and the process may take as long as two months. This would probably mean the EU has to extend Article 50.
Assuming Theresa May wins the confidence vote (or the threshold is never reached), we think the EU leaders will accept the deal on Sunday 25 November and a vote on the deal is expected in the House of Commons in mid-December (10 December has been reported). As said before, the vote in the House of Commons is the real test. While it is likely the vote would be very close, we are still leaning towards May being able to get the deal through despite the hardliners, the DUP, the Labour leadership, the Liberal Democrats and the Scottish National Party all saying no. The reason is that it is easier to say that you are against the deal than to vote it down. Some of the less-prominent Brexiteers will fear that voting no to the deal means Brexit could be reversed. Moderates are likely to fear that voting against the deal would mean the UK crashing out in a 'no-deal' Brexit. We think the probability of the deal passing the House of Commons is 55% and we will end up in our 'decent Brexit' scenario.
There is a risk is we are being naïve here and the stakes are high for everyone. A 45% probability is also non-negligible. If the deal is voted down, we see three possible scenarios here and it is difficult to say which one is the most likely. We think May would have to step down, increasing political uncertainty and meaning we are in uncharted territory. While we cannot rule out a new general election, we think it is unlikely given it would require a super-majority in the House of Commons, which is difficult to see given many Conservatives would fear losing their mandate to Labour. We think it is equally likely that the politicians will call for a second referendum, or that the UK simply just crashes out of the EU.
We discuss what it means for GBP in FX Strategy – Brexit scenarios and outcomes for EUR/GBP, 16 November.
FX Strategy: Brexit Scenarios and Outcomes for EUR/GBP
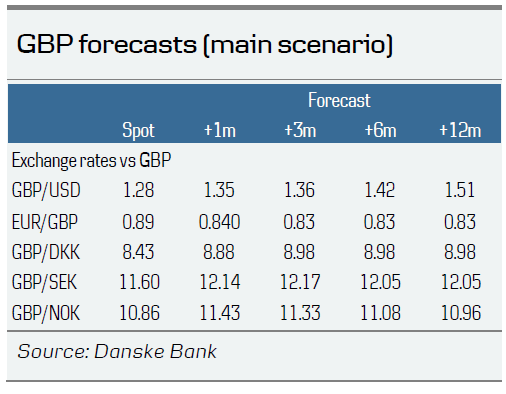
- Near term, the political situation in the UK will be pivotal for the GBP. We expect EUR/GBP to stabilise and fall back into in the 0.865-0.88 range if, as we expect, Theresa May survives a vote of confidence. However, EUR/GBP is likely to remain volatile ahead of a Brexit vote in the House of Commons.
- In our main scenario, where we expect a decent Brexit, we expect EUR/GBP to break lower and settle around 0.83 in 3M.
- However, the likelihood of our main scenario has declined substantially, while the probability of other scenarios, such as a no-deal scenario, has increased.
- We expect EUR/GBP to test 1.00 in a no-deal scenario, while we expect EUR/GBP to break lower into the 0.82-0.86 range if the UK calls a second referendum.
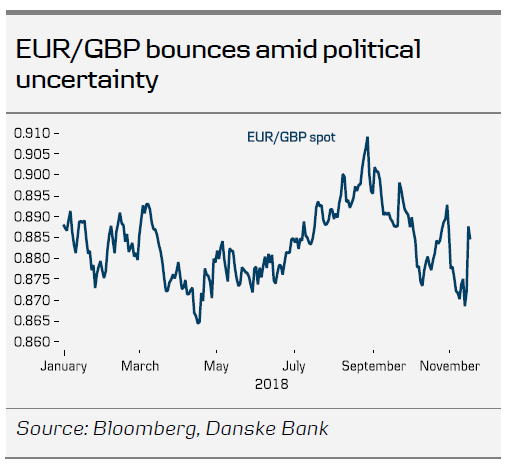
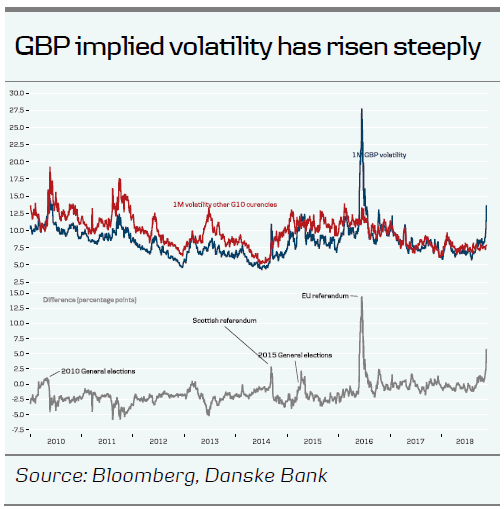
GBP sold off significantly yesterday and implied EUR/GBP volatility has risen steeply as opposition to UK Prime Minister Theresa May's draft Brexit deal increased and as a leadership challenge within the Conservative Party appears to be moving closer.
Yesterday, in FX Forecast Update – GBP cheer is here – but mind the risk of the Commons, we lowered our 1M EUR/GBP forecast from 0.88 to 0.84, as it remains our main scenario that the House of Commons will eventually vote in favour of Theresa May's Brexit deal (vote expected mid-December). However, we stress that the likelihood of our main scenario has declined substantially, while the probability of other scenarios, such as a no-deal scenario, has increased.
Brexit scenarios
In the following text, we present our expectations of the outcomes for EUR/GBP in different Brexit scenarios.
Decent Brexit (main scenario)
We think it is more likely than not that Theresa May will survive a vote of confidence (we estimate that the probability is 65/35 in May's favour) and we maintain our long-held view that EUR/GBP will break lower if/when a Brexit is finalised (and accepted in the House of Commons). We expect EUR/GBP to settle around 0.83 in 3M.
No-deal Brexit
A no-deal Brexit is the worst outcome for GBP and the knee-jerk reaction in EUR/GBP would be likely to be a test of 1.00 in this scenario.
Theresa May resignation or loss of vote of confidence
The initial knee-jerk reaction to Theresa May stepping down would be a jump higher in EUR/GBP – most likely into the 0.92-0.95 area. This scenario could materialise either because the Prime Minister loses a vote of confidence by the Conservative Party or if the House of Commons votes down the Brexit deal.
It remains very uncertain what would happen in this scenario. We cannot rule out either a decent Brexit, a no-deal Brexit, a new general election or a second Brexit referendum. Hence, the medium-term outlook for the GBP in this scenario depends on the actual situation.
Second Brexit referendum
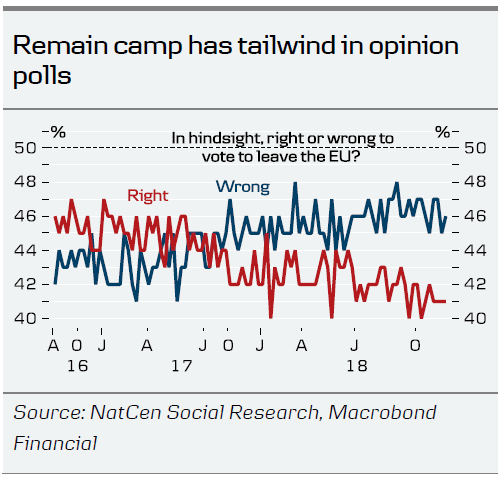
We expect EUR/GBP to break lower into the 0.82-0.86 range if the UK calls a second referendum. The pre-referendum GBP appreciation potential depends on the actual subject of a vote. Looking at the opinion polls, it seems the remain camp has more tailwind currently, suggesting Britons may vote to reverse Brexit if 'remain' is an option. We expect EUR/GBP to break below 0.80 if there is a vote in favour of remain.
FX strategy
Near term, the political situation in the UK will be pivotal for the GBP and we still see risks skewed on the upside for EUR/GBP ahead of a likely leadership challenge in the Conservative Party. We expect EUR/GBP to stabilise and fall back into in the 0.865-0.880 range if as we expect Theresa May survives a vote of confidence. Even if Theresa May survives a vote of confidence, the near-term outlook for GBP remains uncertain and thus we expect EUR/GBP to remain volatile ahead of a Brexit vote in the House of Commons.
Hedge GBP income via (ratioed) risk reversals
We recommend clients hedging GBP income/assets to maintain a high hedge ratio. From a risk/reward perspective, we favour hedging via 1:2 ratioed risk reversals, which benefit from the high implied volatility and enable greater profit potential in the event of GBP appreciation compared with a regular risk reversal.
Hedge GBP expenses via risk reversals
Clients with GBP payables should take advantage of the recent bounce in EUR/GBP and hedge 2019 exposure via risk reversals. Use potential bounces above 0.90 to restructure risk reversals into FX forwards and/or increase hedge ratio via FX forwards.
See Corporate Hedger – Strong November could turn to cold December for GBP(12 November) for more details on GBP hedging.
Weekly Focus – Can May Deliver Decent Brexit?
Market Movers ahead
In the US, we expect November manufacturing PMIs to stabilise around the current level of 55.7.
We expect another decline in euro area manufacturing PMIs in November.
The European Commission is expected to issue its final opinion on Italy's budget. We expect the European Commission to start the process of opening an excessive deficit procedure (EDP) against the country relatively quickly.
In the UK, all eyes are on political developments and Brexit. The first question is, will Theresa May survive as party leader?
In Sweden, we get housing construction for Q3. Slowing residential construction will continue to be a major macroeconomic theme in Sweden in 2019.
Given the slightly weaker growth outlook, it will be interesting to see if Norwegian oil investment figures for Q3 once again deliver a positive surprise.
Weekly wrap-up
Even if May's deal with the EU survives, the real test is in our view the vote in the UK House of Commons.
If the Italian government does not budge in the face of EU pressure, the EU can impose sanctions on Italy, but such a step will likely first materialise in H2 19, and hence we expect Italy to fade as a market theme.
On the macro front, this week saw rather disappointing growth figures. In the eurozone, real GDP only grew by 0.2% q/q in Q3 and the loss of economic momentum was particularly pronounced in Germany.
USDZAR Trades Below Downtrend Line; Outlook Cautiously Negative
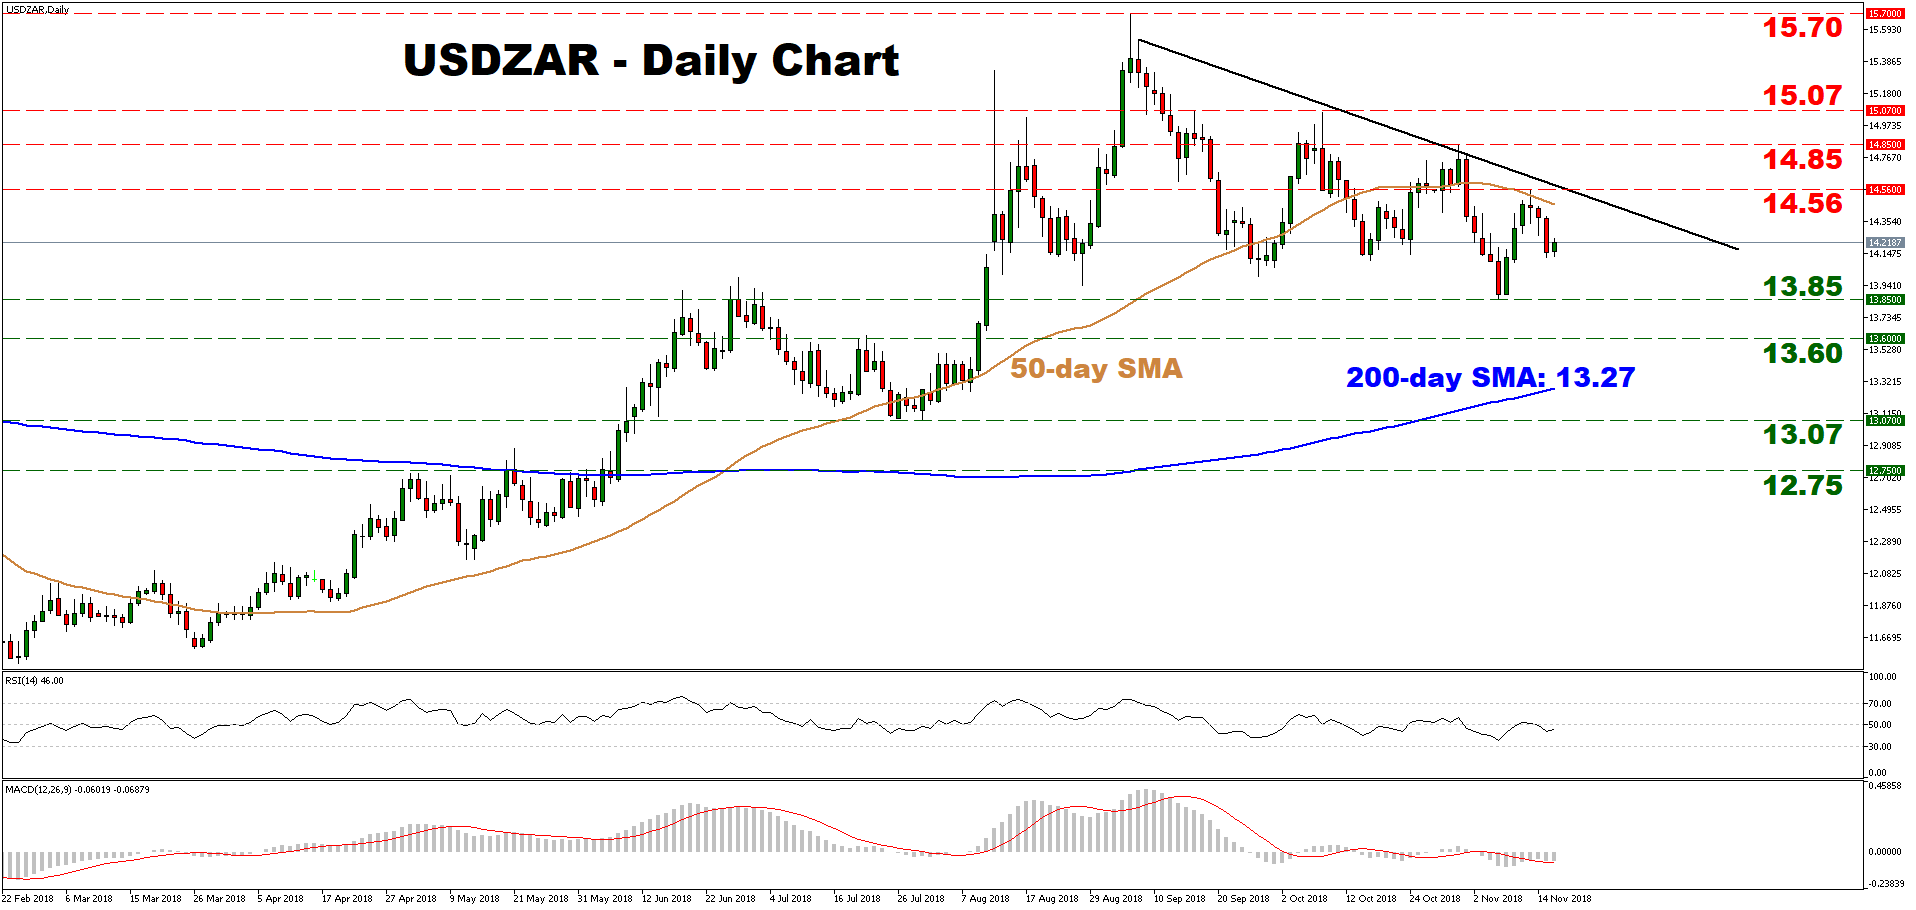
USDZAR has been printing lower highs and lower lows on the daily chart, below a downtrend line drawn from the highs of September 6. The pair has also recently fallen below its 50-day simple moving average (SMA), which has turned the near-term outlook cautiously negative.
Short-term oscillators are hovering in bearish territory, albeit not decisively so. The RSI is only marginally below its neutral 50 line and pointing sideways. Likewise, although the MACD is below zero, it still lies fractionally above its red trigger line.
Should the pair decline further, support may come near 13.85, the low of November 7. A downside break could open the way for the 13.60 area, marked by the peak of July 19, with even steeper declines aiming for the 200-day SMA at 13.27. Another bearish move below the latter would turn the outlook to firmly negative, setting the stage for a test of 13.07 – the July 31 trough.
On the upside, resistance to advances may be found near the crossroads of the downtrend line and the 14.56 level. A move above this zone could see scope for a test of 14.85, the October 31 high, before the October 9 peak of 15.07 comes into view.
In summary, as long as price action remains below the downtrend line, the short-term picture is cautiously bearish. A move below the 200-day SMA is needed to turn it decisively negative.
Canadian Dollar Unchanged, Investors Eye Manufacturing Production
The Canadian dollar is almost unchanged in the Friday session. Currently, USD/CAD is trading at 1.3175, down 0.01% on the day. On the release front, Canada releases Manufacturing Sales, which is expected to rebound with a gain of 0.1%, after a decline of -0.4% in the previous release. There are no major U.S indicators on the schedule.
Consumer inflation and spending numbers were strong in October, as the U.S. economy remains strong. On Thursday, the U.S released retail sales reports. Retail sales rebounded with a strong gain of 0.7% in October, after a decline of -0.1% a month earlier. Core retail sales jumped 0.8%, after a gain of 0.1% in September. There was good news from the inflation front on Wednesday, as U.S consumer inflation numbers beat their estimates for October. The consumer price index posted a gain of 0.3%, its strongest gain since January. Core CPI, which excludes food and energy prices edged higher to 0.2%, marking a 3-month high. Both releases were in line with forecasts. Core CPI was 2.1% higher than a year ago. The solid consumer data means that the Fed remains on track to continue raising interest rates. The Federal Reserve holds its next policy meeting in December, with the odds of a December rate hike at 72%, according to the CME Group.
The Bank of Canada released a semi-annual survey on Wednesday, and the results indicated that risk management professionals were more concerned about the global economic picture. The escalating tariff war between the U.S. and its trading partners could take a bite out of the Canadian export sector, although the new USMCA pact, which replaces NAFTA, is a huge relief to the business sector. The BoC has raised interest rates five times in the past 16 months, keeping pace with the Federal Reserve. However, with the Fed likely to raise rates in December and continue raising rates gradually in 2019, the BoC will have to answer in kind or the Canadian dollar could lose ground.
CADJPY Struggles Inside Bollinger Band Levels; Positive View in Long-Term
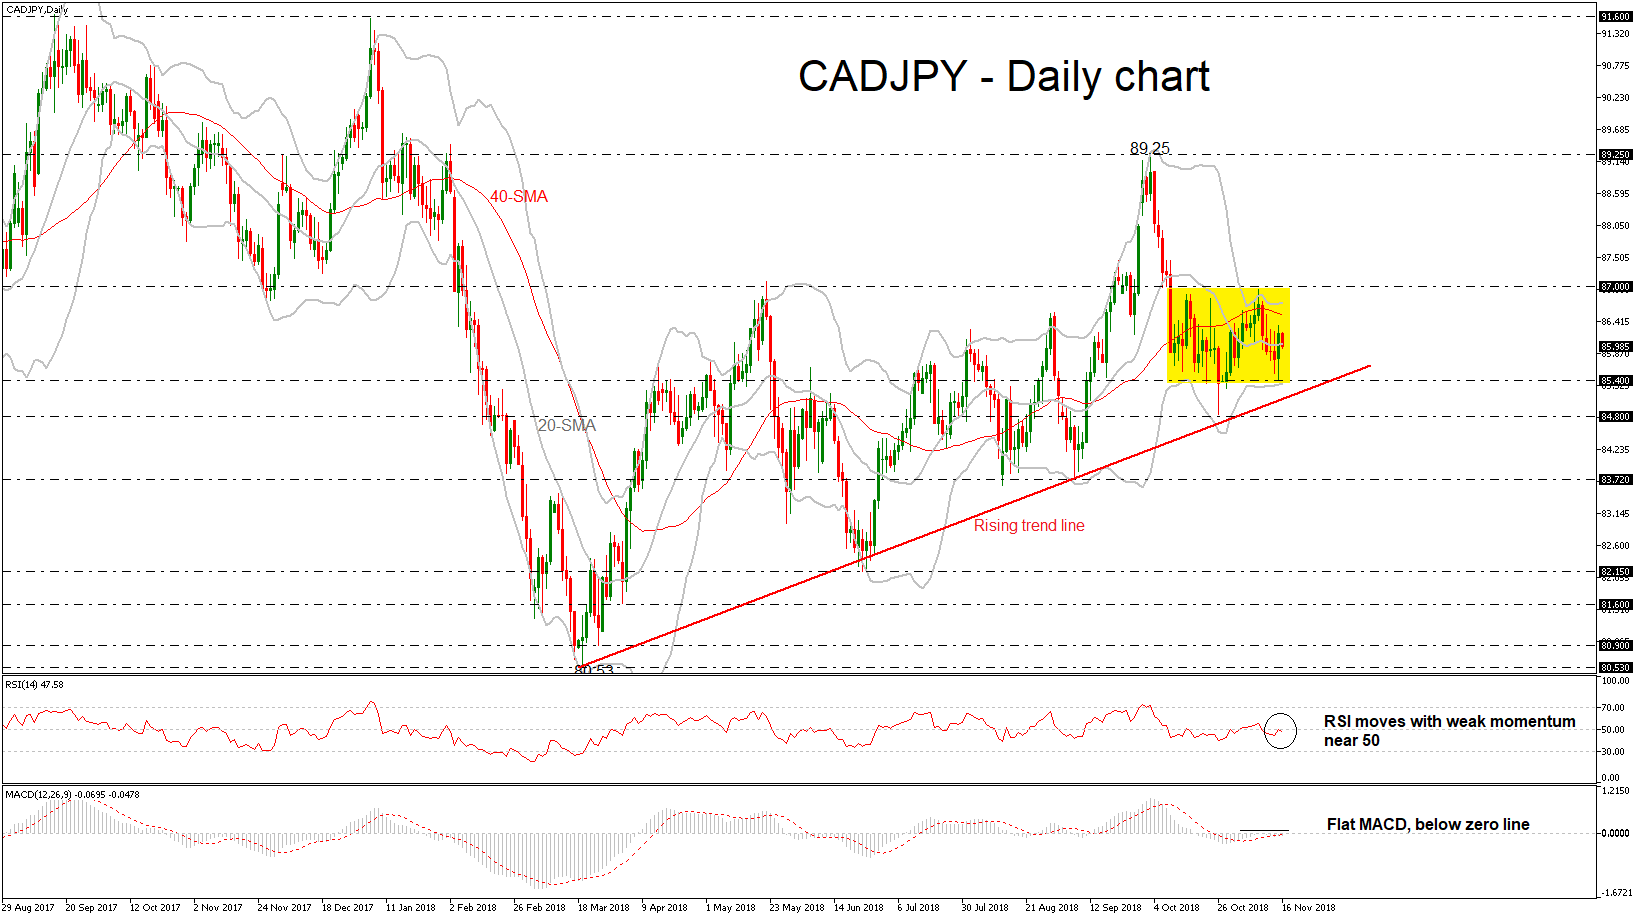
CADJPY is back in bullish mode in the daily timeframe over the last eight months that helped the market to head higher and peak at 89.25 on October 3. While the MACD suggests that the market could maintain the neutral movement near the zero line and the RSI moves slightly below the 50 level, as the price has failed to provide strong direction during the past month. Moreover, the Bollinger Band is squeezing indicating sideways movement.
Should the price head lower, traders could look for support around 85.40, which stands near the long-term ascending trend line. Even lower, a break below this line could shift the bullish outlook to a more bearish one and touch the 84.80 support. A substantial close below this low would clearly re-challenge the 83.72 region.
On the other side, gains could try to overcome the 40-day simple moving average (SMA) and the upper Bollinger Band could reach the 87.00 handle. Further up, the attention would turn to the area around 89.25, a frequently approached zone on October 3.
In the long-term view, the bullish outlook remains intact as CADJPY remains above the rising trend line, despite the latest sideways move in the near term.
EUR/USD Mid-Day Outlook
Daily Pivots: (S1) 1.1280; (P) 1.1321; (R1) 1.1371; More.....
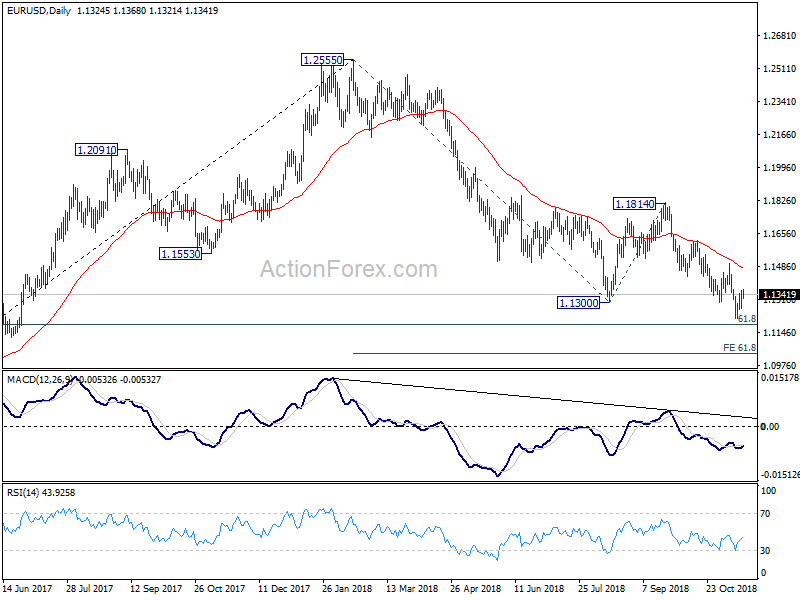
Intraday bias in EUR/USD remains neutral as consolidation from 1.1215 is in progress. In case of stronger recovery, upside should be limited below 1.1499 resistance to bring fall resumption. On the downside, break of 1.1214 will target 1.1186 fibonacci level first. Break will target 61.8% projection of 1.2555 to 1.1300 from 1.1814 at 1.1038 next.
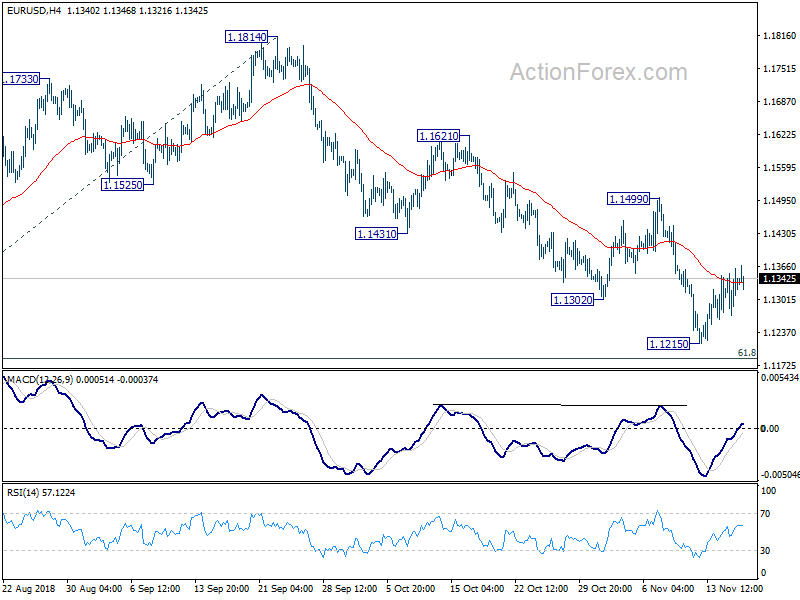
In the bigger picture, down trend from 1.2555 medium term top has just resumed and should target 61.8% retracement of 1.0339 (2017 low) to 1.2555 at 1.1186 next. Sustained break there will pave the way to retest 1.0339. On the upside, break of 1.1814 resistance is now needed to confirm medium term bottoming. Otherwise, outlook will stay bearish in case of recovery.