Sample Category Title
Technical Analysis: Euro/Dollar & Dollar/Yen
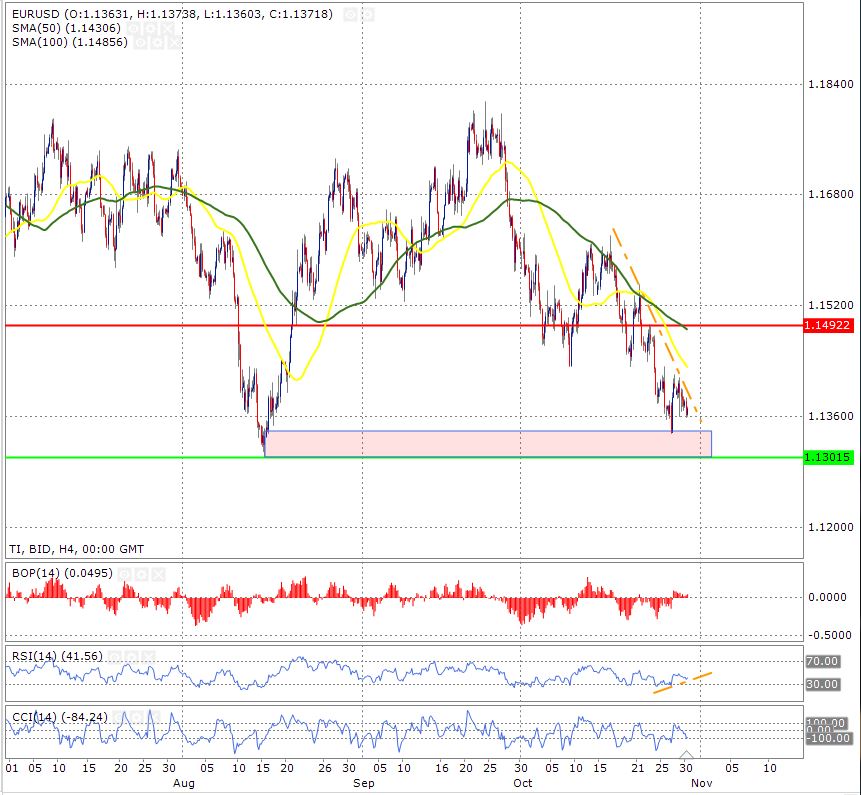
Euro Under Selling Pressure
The euro-dollar has been under immense selling pressure and the intra-day chart (4-hour) shows this picture. The price is trading below the downward trend line shown in the orange line. As long as the price continues to trade below the downward trend line, the odds are in favour of bears. It is important to pay attention to the support zone (shown in pink), this support zone confirms that there could be strong buy orders sitting at this level. More recently, the price literally touched this zone and bounced back up and as long as the price doesn’t break this support zone, there are strong chances that the price may move above the 1.1520 mark.
The RSI is trading above the upward trend line and a break of this line would be a bearish signal. The Balance of Power signal shows that the bulls have the control but the momentum is fading.
The support is shown by the green horizontal line and the resistance is shown by the red horizontal line.
Dollar-Yen Broken It's Downward Channel
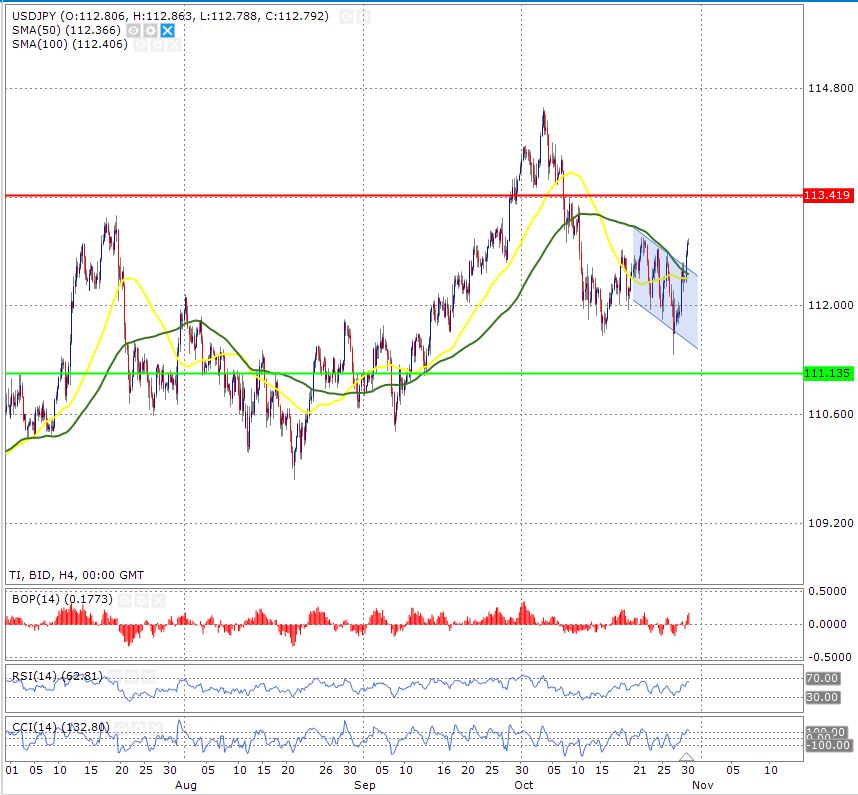
The dollar-yen pair has broken the downward channel on a 4-hour time frame. The price has not only broken out of the downward channel to the upside but also it has moved higher the 50 and 100-day moving average (shown in yellow and green respectively). Another bullish sign would emerge when the 50-day moving average moves above the 100-day moving average.
In terms of momentum, both the RSI and Balance of Power are confirming this stance that the bulls are in control of the price.
The support is shown by the green horizontal line and the resistance is shown by the red horizontal line.
BP: Earnings Beat Analyst Consensus
Fundamental Analysis
BP’s stock price surged 1.3 percent as the company reported better than expected earning results. The results showed higher profits and lower sales than estimated. The company reported a profit of 19 pence a share versus the estimate of 14 pence. This is despite the fact that the sales number were lower (794.7 million pounds) versus the (836.0 million pounds)estimate.
In the previous session, it’s stock price increased to 535.20 pence from 528.10p. In addition to this, the trading volume was almost the same as the 20-day average.
BP trades at 12.0 times trailing 12-month earnings per share and 12 times its estimates for the coming year.
Technical Analysis
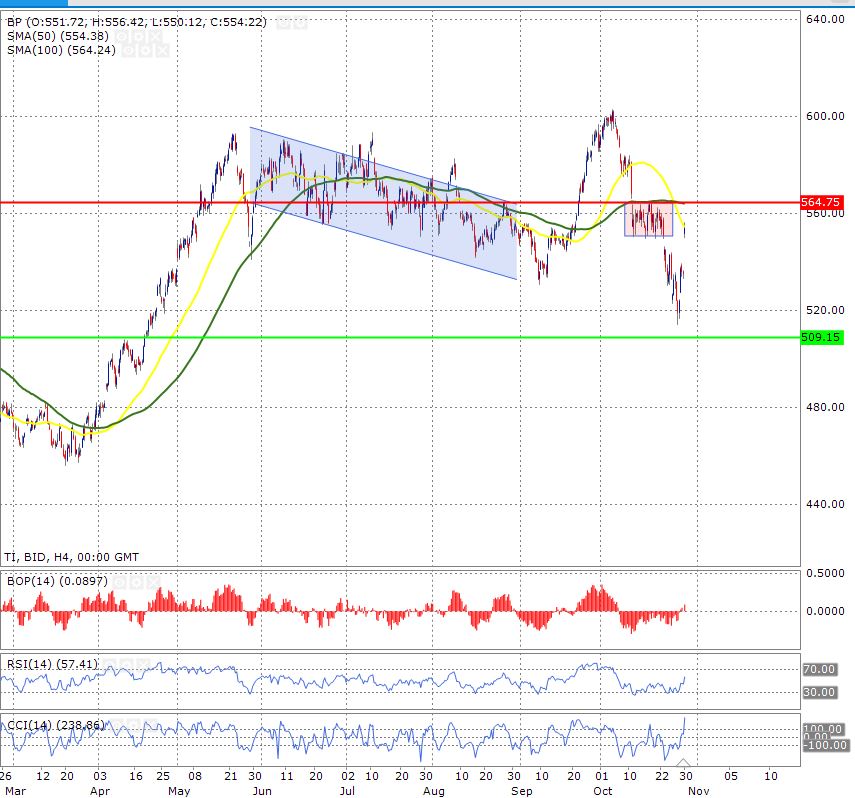
BP’s price is trading near the 50-day moving average (shown in yellow) on a 4-hour time frame. The price is likely to break above the 50-day moving average but the next challenge will be the 100-day moving average shown in green. If the price is able to break both the 50 and 100-day moving average, this will confirm that there are higher chances that the price would continue its move from there onward. However, a failure to break the 100-day moving would likely to push the price lower. It is also important to keep in mind that when the price will be near the 100-day moving average, it will also be entering in a critical area of consolidation (shown by the rectangle box).
The Balance of Power and the Relative Strength Index are both showing that the bulls have the control of the price and it is likely that the current momentum may continue.
The support zone is shown by the green horizontal line and the resistance zone is shown by the red horizontal line.
Into US session: Euro soft on weak GDP, Sterling and Yen even worse
Entering into US session, Sterling, Yen and Euro are the weakest ones today while commodity currencies are generally firm. Sterling's weakness is clearly due to Brexit negotiation impasse. And it's facing more tests from PMIs and BoE's Super Thursday later in the week. Euro is weighed down by weak economic data. Eurozone GDP growth halved to 0.2% qoq in Q3. Confidence indicators deteriorated more than expected this month. Italy GDP stalled in Q3 too, giving the coalition government more reason to stick with its expansive budget plan for 2019.
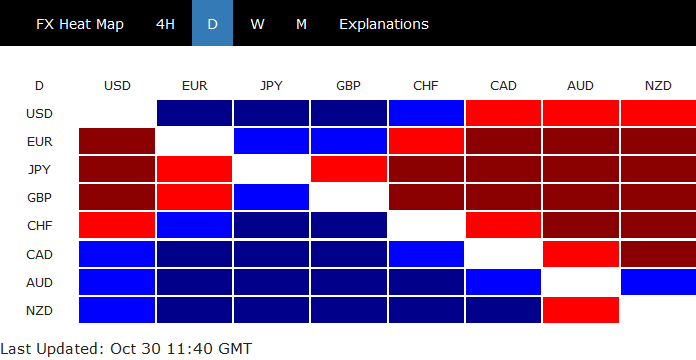
On the other hand, Australian Dollar leads other commodity currencies higher. US stocks staged a stunning bearish reversal yesterday on talks that Trump is going to impose more tariffs on China. But Chinese stocks somehow shrugged, ended up 1%. European indices are mixed at the time of writing. The calm markets provided support to commodity currencies and weighed down on Yen.
In Europe, at the time of writing:
- FTSE is up 0.21%
- DAX down -0.27%
- CAC down -0.21%
- German 10 year yield is down -0.0001 at 0.379
- Italian 10 year yield is up 0.088 at 3.426. Spread back above 300.
Earlier today in Asia:
- Nikkei closed up 1.45% at 21457.29
- Singapore Strait Times closed down -0.51% at 2966.45
- Hong Kong HSI closed down -0.91% at 24585.53
- But China Shanghai SSE rose 1.02% to 2568.05
U.S Dollar Has Earned Its Stripes
Tuesday October 29: Five things the markets are talking about
Euro equities are rallying for a second consecutive session, along with U.S futures as Asian indexes rebounded as the market turned its attention again to a number of corporate earnings and the prospects for a Sino-U.S trade deal.
President Trump, on Fox news last night was predicting a “great deal” with China, despite his administration preparing to announce by early December tariffs on all remaining Chinese imports if talks next-month fail to ease the trade war.
In currencies, the safe-haven yen eased and the Aussie dollar found support, with both moves aiding their domestic equity indexes.
In China, authorities guided the yuan to a decade low outright, a move that could fuel expectations of a further, self-reinforcing slide.
While the EUR remains under pressure on yesterday’s news that Germany’s Chancellor Merkel has planned her exit after Sunday’s disappointing state elections, and sterling has fallen to a 10-week low as markets react hesitantly to yesterday’s fiscal giveaways in the U.K budget.
In bonds, the U.S ten-year note backed up past +3.11% as risk-on trading strengthened. Elsewhere, WTI oil has fallen to trade atop of +$67 a barrel.
On tap: There are a plethora of U.S companies expected to report earnings – Facebook and GE top many list.
1. Stocks in the black
In Japan, the Nikkei rallied overnight as investors bought beaten-down cyclical stocks, softening fresh worries about US-China trade frictions. The Nikkei share average ended +1.5% higher, posting the biggest daily gain in two-months. The broader Topix rallied +1.4% in heavy volume.
Down-under, Aussie shares reversed earlier losses to end higher overnight on news that Beijing wishes to stabilize its markets, though underlying sentiment remains delicate. Broad-based gains pushed the S&P/ASX 200 index up +1.3%. In S. Korea, the Kospi stock index rose this morning, snapping a five-session losing streak. The index closed +0.93% higher.
Note: The Kospi is down around -19.1% so far this year, and down by -12.79% in the past month.
In China, the benchmark Shanghai Composite and the blue-chip CSI 300 gained +1.0% and +1.1%, respectively, reversing earlier losses in a volatile session. Indexes found support after China’s securities regulator said it would “encourage share buybacks and mergers and acquisitions by listed firms, and would enhance market liquidity,” in the latest attempt to put a floor under the country’s weak equity markets.
In Hong Kong, the Hang Seng index closed at its lowest in nearly 18-months, as tepid investor sentiment outweighed promises of support for mainland markets. At the close, the Hang Seng index was down -0.9%, while the China Enterprises Index lost -0.1%.
In Europe, regional indices trade mixed this morning following a positive session in Asia and mixed U.S futures following weakness yesterday. Italy’s FTSE MIB underperforms after GDP came in below exceptions (Q3 GDP +0% vs. +0.2%).
U.S stocks are set to open in the ‘black’ (+0.3%).
Indices: Stoxx50 -0.2% at 3,150, FTSE +0.2% at 7,037, DAX -0.3% at 11,299, CAC-40 -0.3% at 4,976, IBEX-35 -0.1% at 8,815, FTSE MIB -0.5% at 18,943, SMI +0.3% at 8,776, S&P 500 Futures +0.3%
2. Oil prices slip on rising supply, trade tensions, gold lower
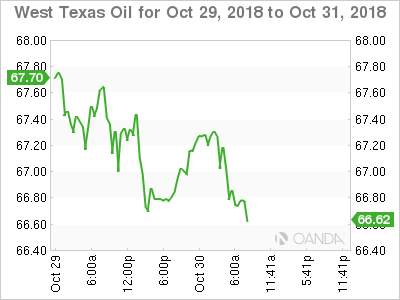
Oil prices start the day on the back foot, weaker on concerns that the Sino-U.S trade dispute will dent economic growth and by signs of rising global supply despite upcoming sanctions against Iran kicking in on Nov 4.
Brent crude oil is down -15c a barrel at +$77.19, while U.S light crude (WTI) is unchanged at +$67.04.
Note: Both contracts have recovered ground over the past week, but are around -$10 a barrel below their four-year high print in early October.
CFTC data last Friday showed hedge funds slashed their “bullish” bets on U.S crude to the lowest level in more than a year – they cut their combined futures and options position in New York and London by -42,644 contracts to +216,733 in the week to Oct. 23.
The IEA said earlier today that high oil prices were hurting consumers and could dent fuel demand at a time of slowing global economic activity.
On the supply side, oil markets remain tense ahead of forthcoming U.S sanctions against Iran’s crude exports, which are set to start on Nov. 4 and are expected to tighten supply, especially to Asia, which takes most of Iran’s shipments.
According to Baker Hughes data last Friday, in North America there is no oil shortage. Production is set to rise further as U.S drillers added two oil rigs in the week to Oct. 26, bringing the total count to +875, the highest level since March 2015.
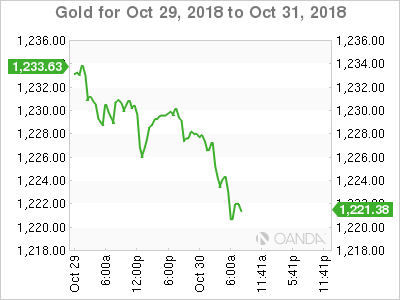
Ahead of the U.S open, gold prices have eased a tad as the ‘big’ dollar finds support on worries over slowing economic growth and fears the Sino-U.S trade war could intensify again. Spot gold is down -0.2% at +$1,227.41 an ounce, after falling -0.3% yesterday. U.S gold futures are up +0.2% at +$1,229.30 an ounce.
3. BTP yields off lows as Italian economy flat-lines
Italian BTP yields have backed upped this morning, reversing an earlier fall, after GDP data showed that the country’s economy ground to a halt in Q3 (+0% vs. +0.2%e).
Italy’s 10-year BTP yield was up +5 bps at +3.385%, after having been as low as +3.32% at the start of the Euro session. The BTP/Bund spread tightened -6 bps to +293 bps – the tightest spread in three-weeks.
Elsewhere, the yield on U.S 10-year notes gained + 2 bps to +3.11%, the largest rise in almost two-weeks. In Germany, the 10-year yield climbed +1 bps to +0.39%, while in the U.K, the 10-year Gilt yield rallied less than +1 bps to +1.402%.
4. U.S dollar has earned its stripes
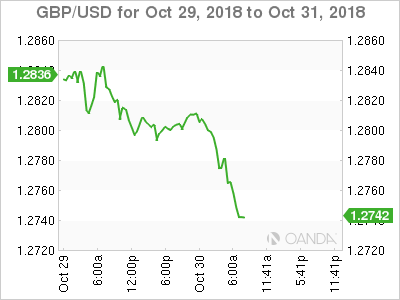
The pound has fallen -0.33% to its lowest level in 10-weeks outright at £1.2756 as investors react suspiciously to fiscal giveaways in the U.K budget yesterday, which was conditional on a favourable Brexit deal being reached. With no Brexit deal done, and talks in deadlock, doubts exist as to whether the largest giveaway in eight-years will ever happen.
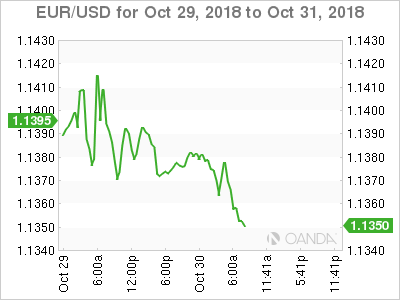
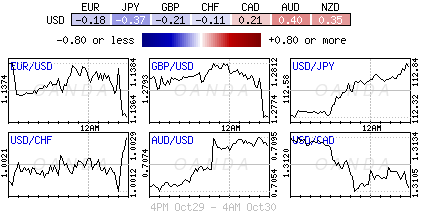
EUR/USD is steady at €1.1367 area but continues to see soft regional data, as both France and Italy Q3 GDP data came in below expectations. ECB noted last week that recent incoming economic data had been weaker than expected, but reiterated “risks to economic growth were still broadly balanced.” With Germany’s Merkel poor showing in state elections, dealers note that there is still the possibility of early election for Germany at some point.
China fixed the yuan at a ten-year low against the U.S dollar overnight. The PBoC fixed the midpoint of the dollar’s trading range at ¥6.9574 compared with ¥6.9377 on Monday. The Yuan’s value in the fix was near where it ended in daily trading on Monday.
5. Euro preliminary flash Q3 GDP
The euro-zone had its weakest quarter since it returned to growth five years ago in Q3, held back by a decline in auto production that was likely temporary, and slowing demand for exports that was likely not.
Note: The eurozone economy kept pace with that of the U.S in 2016 and 2017, but has fallen behind it this year.
Data this morning published by Eurostat showed the seasonally adjusted GDP for Q3 rose by +0.2% in the euro-area (EA19) and by +0.3% in the EU28 compared with the previous quarter.
In Q2, GDP had grown by +0.4% in the euro-area and by +0.5% the EU28.
Compared with the same quarter of the previous year, seasonally adjusted GDP rose by +1.7% in the euro-area and by +1.9% in the EU28 in Q3 of 2018, after +2.2% and +2.1% respectively in the previous quarter.
EURUSD Analysis: Waits For A Break-Out
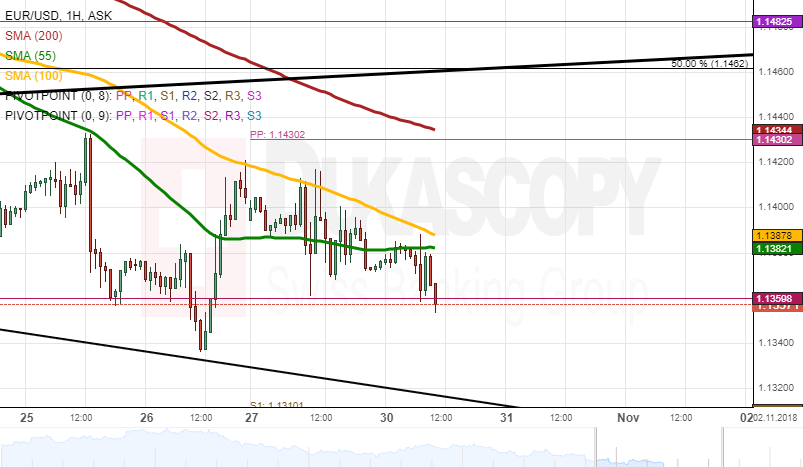
During Monday's session, the currency rate was resisted by the 100-hour SMA to end the trading day at 1.1374. On Tuesday morning, the European Single Currency was trading between the 55-hour SMA and the monthly S2 at the 1.1679 mark.
In regards to the near-term future, the rate will trade downside due to possible break-out of the 100-hour and the 55-hour SMAs during the trading session on Tuesday. Most likely, the rate will pass through the support of the monthly S2 at the 1.1359 mark to trade at the 1.1320 level.
Besides, US Dollar might depreciate during today's fundamental news of the US CB Consumer Confidence at 14:00 GMT to push the rate to trade upside at 1.1400.
GBPUSD Analysis: Trades Near S1 At 1.2778
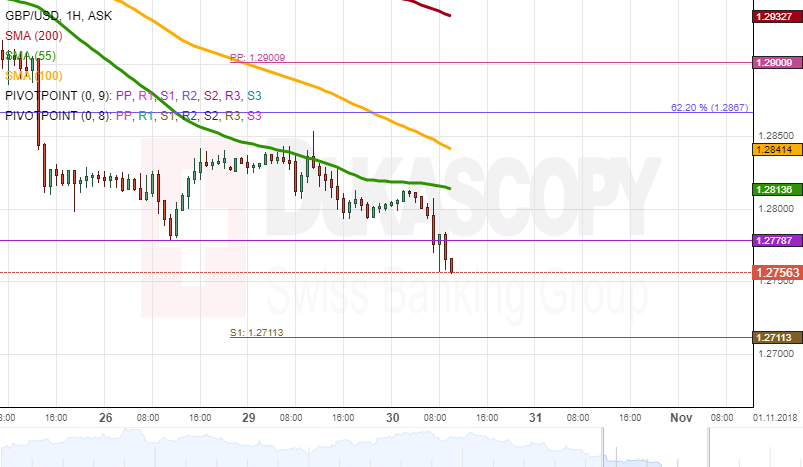
During Monday's trading session, the British Pound was resisted by the 55-hour simple moving average to end the trading day at the 1.2800 mark. On Tuesday morning, the rate passed through the monthly S1 to trade at the 1.2779 mark.
In regards to the near-term future, most likely, the British pound will trade sideways due to the resistance of the 55-hour simple moving average. The 100-hour simple moving average tries to catch up the 55-hour SMA to perform possible break-out on Wednesday.
It is expected that the monthly S1 at 1.2778 will keep the currency exchange pair at the 1.2750 level during the day, but on the other side, the rate might get resisted by the monthly S1 to trade towards the weekly S1 at 1.2711 on Tuesday.
USDJPY Analysis: Breaks Most Technical Indicators
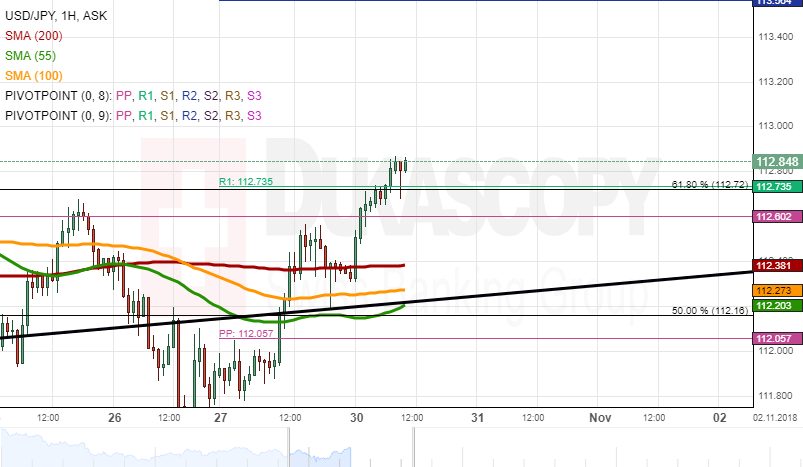
During Monday's trading session, the rate broke the resistances of the simple moving averages to end the trading day at the 112.30 mark. On Tuesday morning, the US Dollar broke the resistances of the three technical indicators to trade above the weekly R1 at the 112.83 mark.
In regards to the near-term future, most likely, the US Dollar will move upside towards the weekly R2 at 113.56 due to the support of the weekly R2 at 112.73 and the support of the 61.80% Fibo at 112.72.
Besides, none of the technical indicators and official fundamentals could prevent the currency exchange pair from the surge on Tuesday.
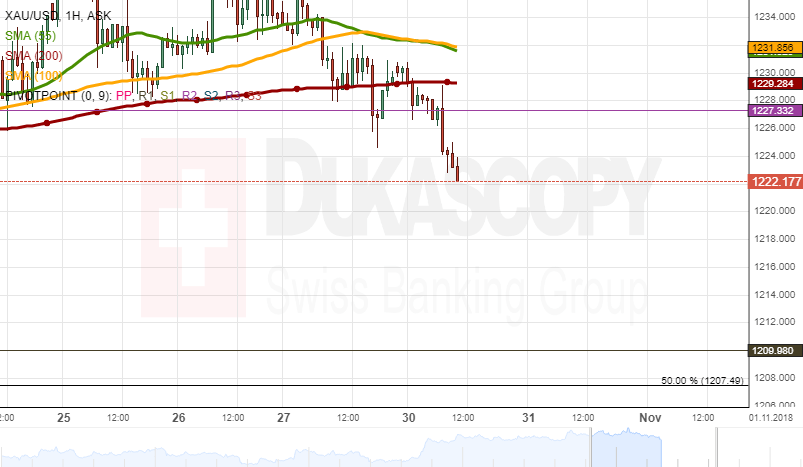
XAUUSD Analysis: Trades At 1,222.00
During Monday's trading session, the yellow metal was resisted by the 55-hour SMA to pass through the rest of the SMAs to end the trading day at 1,226.60. On Tuesday morning, the gold was trading below the monthly R2 at the 1,224.25 mark.
In regards to the near-term future, most likely, the gold will keep moving downside towards the monthly R1 at 1,209.98 due to the resistances of the most technical indicators.
However, the US Dollar could depreciate against the yellow metal during today's US CB Consumer Confidence data release at 14:00 GMT. The fundamental news could force the gold to break the resistance of the monthly R2 at 1,227.33.
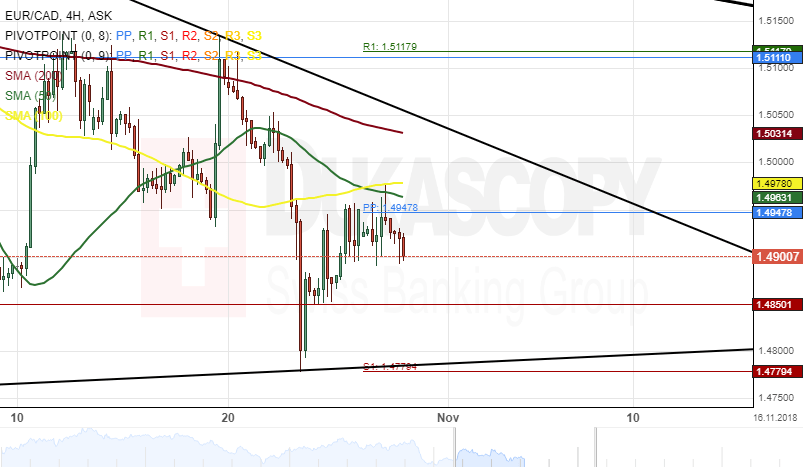
EUR/CAD 4H Chart: Triangle Pattern
The single European currency has been trading in a triangle pattern against the Canadian Dollar since late September. The pair tested the upper boundary of the pattern at 1.5325 on September 27 and re-tested the bottom border at 1.4779 last week.
Everything being equal, it is possible that the Euro continues its decline within this session. The currency pair is likely to aim at the monthly S1 of 1.4850 in the coming hours.
If the currency exchange rate passes that support level as mentioned above, the next target for bearish traders will be near the weekly S1 at 1.4779.
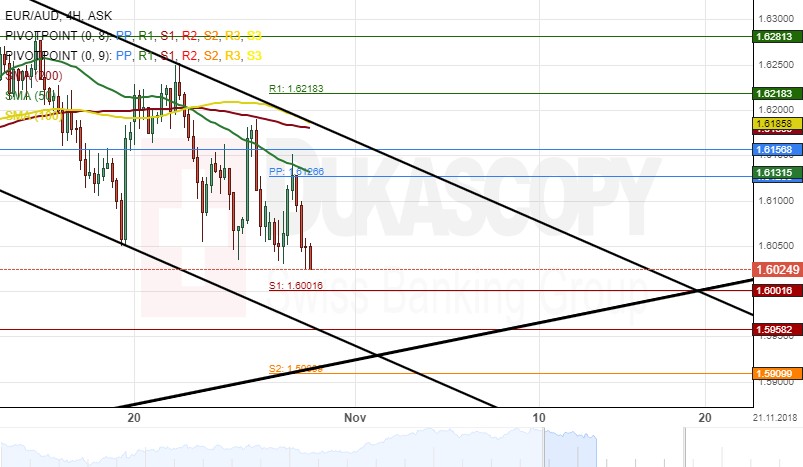
EUR/AUD 4H Chart: Decline Continues
Downside risks have dominated the EUR/AUD currency pair since the last three weeks. This fall began after the pair tested a resistance level formed by the weekly R2 at 1.6343.
As for the near future, it is likely that the common European currency will trade downwards to test the lower boundary of a descending channel pattern at 1.5958 during the following trading sessions.
However, a support level formed by the weekly S1 at 1.6001 could prevent the currency exchange rate from reaching the given target within the next 48 hours.