Sample Category Title
Australia & New Zealand Weekly: Looking through Monthly Volatility, Westpac’s Employment Outlook for Aus
Week beginning 29 October 2018
- Looking through monthly volatility, Westpac's employment outlook for Australia
- RBA: Assistant Governor Bullock speaks.
- Australia: CPI, retail trade, import/export prices, trade balance, dwelling approvals.
- NZ: residential building consents, business confidence.
- China: NBS PMI's.
- Europe: GDP, employment, CPI.
- US: PCE inflation, Treasury refunding announcement, ECI, nonfarm payrolls.
- Other central banks: BoE policy decision, BOJ policy decision.
- Key economic & financial forecasts.
Information contained in this report current as at 26 October 2018.
Looking through Monthly Volatility, Westpac's Employment Outlook for Aus
Household and business surveys guide the near term
When forecasting the near term pace of employment growth we use the labour market indicators from the household and business sentiment surveys.
From the Westpac-Melbourne Institute Consumer Sentiment Survey there is the question on household unemployment expectations (do they expect unemployment to rise or fall?) which has a good fit with the momentum in the labour market.
Unemployment expectations have risen modestly (households expect unemployment to rise a little thus a softening in the labour market) but still holding at a historically robust level. However, employment overshot unemployment expectations through the second half of 2017 so an undershoot through to the mid 2019 would be a normal course of events.
The multiple business surveys in Australia have questions that are applicable to the labour market. To generate a broad, deep labour market indicator, Westpac compiles all the relevant indicators from these surveys into the proprietary Westpac Jobs Index from which we generate a predicted pace for annual employment growth. It is true that the Jobs Index is more stable than the annual pace of employment growth but we have found it provides a useful guide on both the near term pace of employment growth and, more importantly, major turning points.
Currently the Jobs Index is pointing to employment growth of 2½%yr. Actual employment growth in the second half of 2017 overshot the jobs index. Looking ahead we expect employment growth to undershoot the job index through to early 2019.
Using these indicators we expect the pace of employment growth to hold around current levels through to the end of the first quarter of 2019. This will see the annual pace dip to around 2% by end 2018 which is softer than our indicators are suggesting, reflecting a view that there will be some employment undershoot following the 2017 overshoot.
Looking further out household demand and non-mining investment drive our forecasts
Looking further out our fundamental economic view defines our employment profile. There are various indicators you can use to do this, and multiple ways to generate a model, but we have found that simple models based on well understood measures best suit our needs for a guide that is not just reliable but also simple to understand and explain.
The two economic fundamentals we use are adjusted household demand (which is household consumption, housing activity – both dwelling construction and renovations – and net services exports) and non-mining business investment.
Annual growth in adjusted household demand peaked at 4.4% in the second half of 2015 before slowing to 2.2% in the first quarter of 2018. We have found that the growth in adjusted household demand has a two quarter lead on quarterly growth in employment.
Again, as we saw with the near term employment leading indicators, employment growth has outpaced our adjusted household demand model's estimates, stretching from 2017 Q2 to 2018 Q1. As such, our forecasts incorporate a period of employment undershoot before returning to fundamentals in the last quarter of 2018. By end 2018 our model suggests employment should be growing a little more than 20k per month on average.
Non-mining investment staged a relatively modest recovery lifting to almost 8%yr in the March quarter from where we are forecasting the pace stall flat in early 2019. The recent peak is quite modest compared to upturns in the late 1990s and the first half of the 2000s when the pace often peaked around 20%yr. Nevertheless, the recent increase does point to a very modest near term lift in employment growth through 2018 before it slows in late 2019. And there is also the issue of the 2016/17 overshoot. Given the expected correction, we see employment through to the end of the first half of 2019 undershooting the model's estimate (an average monthly gain of around 25k).
Participation has peaked, for now, but will recover as employment recovers.
Once you have an employment profile, an estimate of participation is required to round out the forecasts. As readers would be aware, the strong employment growth through 2017/18 did not lead to a large fall in unemployment as participation lifted from an October 2016 low of 64.4% to a January 2018 high of 65.8%.
In the September Labour Force Survey, the fall in the unemployment rate to 5.0% was supported by a sharp 0.24ppt dip in participation to 65.44%. The all time record high in participation was 65.79% in November 2010. It recently hit 65.78% in January 2018.
There are two factors to consider in regards to participation; the structural longer run issues, such as rising female participation, education, aging population etc; and the short-run dynamics where participation rises and falls with employment.
In the long-run the cross currents of rising female participation and declining male participation (associated with an aging population - for now females are pushing out their age of retirement so the aging population is not a net negative for this group) suggests we may be close to, if not past, a medium term peak in participation. Our forecasts focus on the shortrun dynamics of participation associated with employment bounded by our view that we have seen a structural peak.
A further reason to be cautious about predicting a lift in the participation rate back to record peaks is the observation that the recent improvement in male employment has not produced the lift in male participation that it has in the past. In fact while annual growth in male employment has lifted, the annual change in male participation has moderated.
On this basis the participation rate drifts up a little through to the first quarter of 2019, before it drifts down a little as employment slows, limiting the rise in unemployment to 5.3%. Through the second half of 2019 and into 2020, employment lifts to an around trend pace and the participation rate continues to drift higher but remains short of the most recent peak of 65.78%.
Unemployment set to drift down to less than 5% by end 2019 while the rise in employment to population will remain shy of a new record high
Once you have an employment and participation profile you can generate a profile for the unemployment rate. Our forecasts result in the unemployment rate rising to a peak of 5.3% in the June quarter of 2019 before easing back to 5.0% year end then trending down to 4.8% by end 2020.
The week that was
The past week has been light on data, but full of angst. At the centre was President Trump again raising questions over the appropriateness of the FOMC's ongoing gradual normalisation. The market subsequently found cause to be more cautious on growth, the S&P500 jolting 3% lower on Wednesday before recovering almost 2% on Thursday. Markets across the world, by and large, followed suit.
During an interview with the Wall Street Journal, President Trump made clear his displeasure with the FOMC over their gradual normalisation. President Trump's focus was arguably more on his economic legacy than the appropriateness of the FOMC's actions, made clear by comments referencing President Obama's "zero [interest] rates". But President Trump did clearly say that he sees the FOMC as the biggest risk to the US "because I think interest rates are being raised too quickly".
Many across the globe would instead argue that it is his administration's trade policies that are the greater cause for concern, particularly with respect to business investment. While the US Markit PMI's held up in October, according to the flash release, core durable goods shipments and orders both showed weakness in September. For core shipments, September was the second consecutive flat outcome. Core orders furthermore signalled that growth is to remain absent, falling for a second consecutive month in September. This soft trend fits with the deterioration seen of late in the regional business surveys' investment intention series, but is a stark contrast to the optimism around fiscal expansion and domestic demand. Taken together, these observations highlight the uncertainty that the tariffs have created. Combined with the end of extraordinary fiscal policy in late-2019, the negative shock to business investment from the US' own tariffs is crucial to our view that growth will decelerate through mid-2019 and see the FOMC go on hold – indefinitely.
US housing data released this week gave the FOMC an additional reason to be cautious but not alarmed. New home sales fell over 5% in September; this was the fifth decline in six months. If we take a step back and consider data for the past two years however, the trend looks more flat than downward. Given home builder confidence and Case-Shiller house price growth remain strong, and the 30-year mortgage rate accommodative, the current level of sales should persist and inventories remain manageable.
Turning to Europe, the ECB met for their October meeting this week. By and large, their views were unchanged. The Council continues to have considerable confidence in the domestic economy, particularly the strength of employment. The latter is expected to flow through to wages and underlying inflation in time, bringing inflation to the ECB's 'near 2%yr target'. Risks are still considered "broadly balanced", but evident in the Q&A however was that external risks to this view have built. This highlights a need to pay close attention to the ECB's forecasts as they are updated at the December meeting and the end of each quarter thereafter. We remain of the view that only the deposit rate will be increased from late-2019, with the refinance rate to wait until at least mid-2020. Risks to this view are skewed towards a later start to hikes.
Coming back to Australia, in the absence of any data, RBA discussion of the labour market was the focus. Following the unemployment rate's jolt lower to 5.0% in September, historically the benchmark for 'full employment' in Australia, Deputy Governor Debelle remarked this week that "We [the RBA] have an open mind on the question of what actually constitutes full employment". Westpac's own view is that the unemployment rate consistent with full employment is actually likely to be well below the current 5.0% figure, hence wage growth and inflation are unlikely to pick up anytime soon. This fits with the experience of the US where, with the unemployment rate now a percentage point below historic estimates of 'full employment', wages are only just starting to accelerate robustly. Looking ahead, we see the Australian unemployment rate holding near 5.0% through 2018 and 2019, and hence wages growth and inflation remaining benign. The next key update for Australia will be the September quarter CPI report, due next week. On all fronts, it is expected to highlight the absence of inflation pressures and justify the RBA remaining on hold through 2019 and 2020.
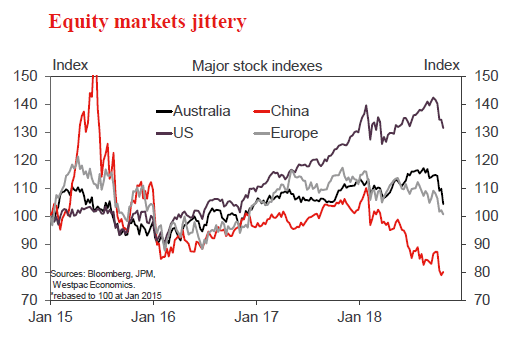
Chart of the week: Equities
October has seen a second global equity sell off for the year, coinciding with a jump higher in term US interest rates.
The US 10-year most recently peaked around 3.2% in October, and since the start of the month, the S&P500 has fallen circa 8%. Of course, declines in emerging markets have been much more severe over the year, given the threat tariffs, a higher USD and higher domestic interest rates (to stabilise their currencies) pose to growth there.
New Zealand: week ahead & data wrap
High rates of net migration were an important driver of the strong economy New Zealand experienced from 2014 to 2016. But the latest monthly data registered another decline, confirming that net migration is now trending downward. For the year to September, net migration was 62,700, down from the peak of 72,400 reached during 2017. The big factor weighing on net migration has been departures of non-New Zealand citizens. Three to four years ago, a large number of foreign citizens entered New Zealand on temporary work and student visas. Increasingly, those people are now heading home. But movements of New Zealanders are also evolving. We are now seeing fewer New Zealanders returning from abroad, and recently the number leaving for Australia has ticked up. The New Zealand economy is no longer outperforming Australia's, so it is not surprising to see people voting with their feet in this way.
We expect these trends to continue, and to be joined by a reduction in the number of foreign citizens entering New Zealand. This will add up to a continued decline in net migration, down to 53,000 by this time next year.
Businesses will feel the pinch from falling net migration in a few ways. Migration has been an easy source of growth for some businesses, simply by putting more feet in shop aisles. That source of growth is now waning. Some businesses might find that labour is harder to come by when net migration slows. And finally, strong population growth has been a major spur to construction activity – when population growth slows, there will be less need for new construction activity.
For households, the economic impact of the drop in net migration will be mixed. As businesses suffer from waning demand, there may be a negative impact on job availability. But there will also be less competition in the labour market.
For the Reserve Bank, falling net migration will reduce aggregate demand in the economy (tending to reduce inflation), but at the same time it will reduce aggregate supply in the labour market (tending to increase inflation). The Reserve Bank considers the aggregate demand effects to be slightly larger than the aggregate supply effects – in other words, falling net migration is considered to be a small negative for the inflation outlook, and is a (minor) argument in favour of reducing the OCR. That is very different to the perception in other countries such as Germany, where migrants are thought to add more to the supply side of the economy than to demand.
The reduction in net migration over the past year has been felt right across New Zealand. Almost every region experienced a small decline in the rate of population growth between the June 2017 and June 2018 years according to Statistics New Zealand's latest regional population estimates, released this week (the exceptions are Taranaki, West Coast and Southland).
However, today's regional pattern of population growth is very different to what it was in 2015. While Auckland is still the fastest growing region, its rate of population growth has fallen sharply. Canterbury's population growth rate has also fallen. Meanwhile, population growth rates have stepped up sharply across the central and lower North Island, including Wellington, and in Otago.
There is a popular notion that these population trends are about Aucklanders leaving the big smoke for greener pastures in smaller towns, and that is no doubt part of the story. But changing patterns of overseas migration are probably playing a bigger role. Many of the overseas citizens now leaving New Zealand were based in Auckland, which partly explains Auckland's reduction in population growth. Meanwhile, the number of New Zealanders leaving the country for Australia is lower today than it was in the mid-2010s. This is part of the reason that population growth rates have increased in the central and lower North Island and southern South Island.
The regional pattern of population growth rates neatly matches the regional patterns we are seeing in housing markets and in economic performance. In Auckland and Canterbury, rent inflation has cooled, house prices are flat or falling, measures of regional economic activity are weaker than elsewhere, and in Auckland, regional economic confidence is very low. These are the regions where New Zealand's economic slowdown has really been felt to date.
Meanwhile, in some other parts of New Zealand it feels as though there has not been an economic slowdown at all. They are still experiencing rapidly accelerating rents, rising house prices, strong economic activity and high confidence. These conditions may last for a while yet. But for businesses in these regions it is very important to understand that today's economic exuberance is has partly been driven by a burst of population growth that will not persist forever. In many of these regions, rates of construction activity are currently elevated, but will eventually drop away when population growth rates cool. That will mean fewer construction jobs locally. Similarly, consumer spending in many regions is still being propelled by an unsustainable rate of house price increase. When housing markets inevitably cool in these regions, so consumer spending will also take a breather.
Data Previews
Aus Sep dwelling approvals
- Oct 30, Last: –9.4%, WBC f/c: –2.0%
- Mkt f/c: 3.8%, Range: -3.0% to 10.7%
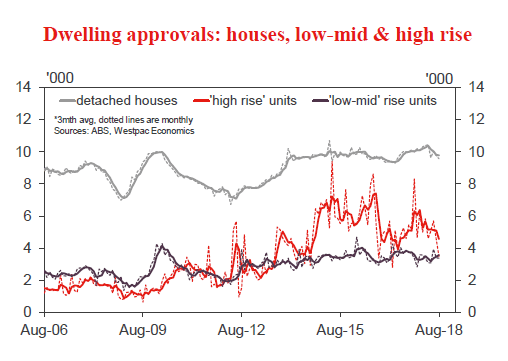
Dwelling fell sharply in Aug with a 9.4% decline led by a 17.2% drop in units (to the lowest level since Oct 2016) but with detached house approvals also moving 1.9% lower. The result provides the strongest confirmation yet of Westpac's view that activity is heading into a second leg lower.
More declines are likely near term. Housing markets weakened significantly through the third quarter as lending conditions tightened. Investor activity and the previously strong Sydney and Melbourne markets continue to lead the declines. Picking month to month moves in the lumpy 'high rise' segment is always difficult, and coming off back to back declines of over 20% there is both less scope for more big falls and some risk of 'noise' generating a give back rise. That said, there are more signs non high rise approvals are weakening with a notable drop off in construction-related finance approvals in recent months. On balance, we expect a further 2% decline cementing the 'second leg lower' view.
Aus Q3 CPI
- Oct 31, Last: 0.4%, WBC f/c: 0.5%
- Mkt f/c: 0.5%, Range: 0.3% to 0.7%
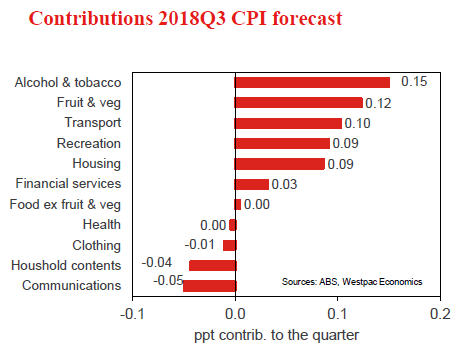
Westpac's forecast for the September quarter headline CPI is 0.5%qtr which will see the annual pace ease to 2.0%yr from 2.1%yr. Westpac's forecast leaves the two quarter annualised pace at 1.6%yr.
The September quarter is a seasonally strong one with the ABS projecting a seasonal factor of +0.30ppt. However, this is larger than the average of the June quarter seasonal factor for the previous two years (average 0.27ppt) so there is a risk that this estimate will be revised downward.
Core inflation is forecast to print 0.3%qtr (0.31% at two decimal places) seeing the annual pace ease to 1.8%yr from 1.9%yr. The trimmed mean and weighted median are both forecast to rise 0.31%. The two quarter annualised pace of core inflation eases back to 1.5%yr from 2.0%yr putting inflation momentum below the RBA's target band.
Aus Aug private credit
- Oct 31, Last: 0.5%, WBC f/c: 0.3%
- Mkt f/c: 0.4%, Range: 0.3% to 0.5%
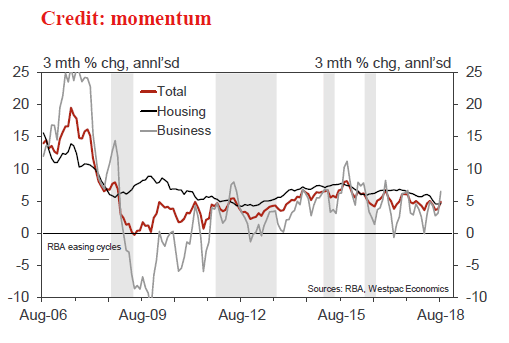
Private sector credit growth is modest, with a slowing trend as housing cools. Annual growth is 4.5% currently, having moderated from 5.4% a year ago.
For September, we expect a rise of 0.3%, in line with the average for the June quarter. Note that the July and August results were more resilient, at 0.4% and 0.5%, boosted by above par outcomes for business.
Housing credit, at this late stage of the cycle, is slowing as tighter lending conditions see new lending decline, particularly for investors. In August, housing credit grew by 0.4%, 5.4%yr (including investors, at 0.1%mth, 1.5%yr).
Business credit, 3.8% above the level of a year ago, is volatile around a modest uptrend as businesses increase investment in the real economy. After two strong results (0.5% and 0.8%) a more modest gain is likely in August.
Aus Oct CoreLogic home value index
- Nov 1, Last: –0.5%, WBC f/c: –0.5%
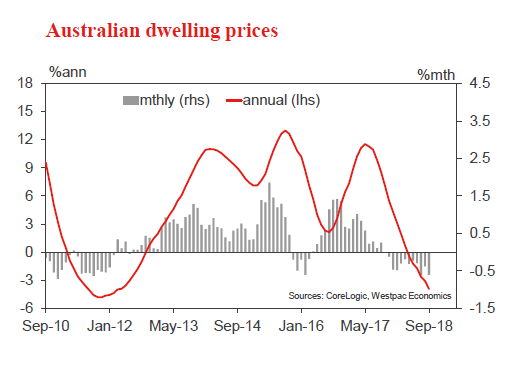
Australia's housing market continues to correct. The CoreLogic home value index, covering the eight major capital cities, fell 0.5% in September to be down 3.7%yr. The previously strong Sydney and Melbourne markets continue to lead the shakeout although softness has been more broad based in recent months suggesting tightening lending conditions are the underlying driver, small mortgage rate increases in August/September (three of the four major banks raised rates by 14-16bps) adding to the weak mix.
The daily index points to a further 0.5% fall in October. CoreLogic have also flagged revisions to the series following the incorporation of improved information on property attributes. This is expected to revise the annual pace of price decline nationally down from –3.7%yr to –4.1%yr for September pointing to a reading of around –4.5%yr for October. Revisions are likely to result in Sydney's annual pace of decline being closer to –7%yr.
Aus Sep trade balance, AUDbn
- Nov 1, Last: 1.6, WBC f/c: 1.7
- Mkt f/c: 1.7, Range: 1.1 to 2.25
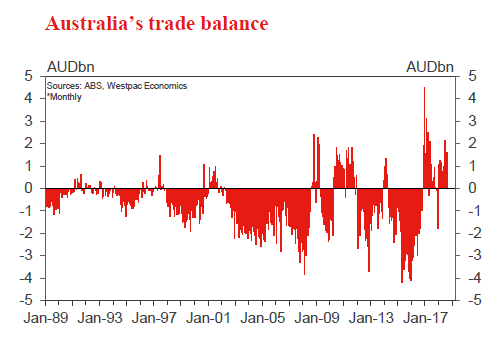
Australia's trade account has been in surplus every month so far in 2018.
In August, the surplus remained elevated, at $1.6bn.
For September, we expect the surplus to be broadly flat coming in at $1.74bn.
Export earnings are expected rise just 1% as stronger met coal prices, and a more modest rise in iron ore prices, combine with support from a slightly softer AUD but offset to some extent by a decline in coal and LNG volumes and flat iron ore exports.
The import bill is expected to rise a modest 0.8% with a slight depreciation in the TWI being particially offset by some consolidation in the volume of imports.
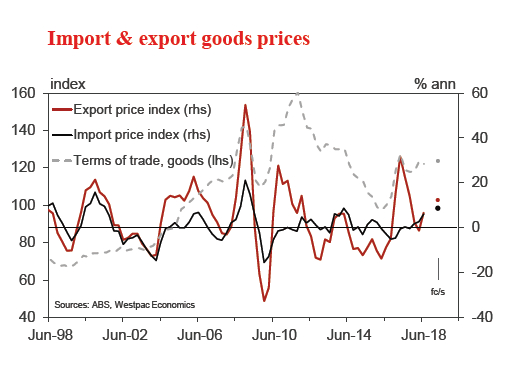
Aus Q3 export price index
- Nov 1, Last: 1.9%, WBC f/c: 2.2%
- Mkt f/c: 2.2%, Range: 1.5% to 3.2%
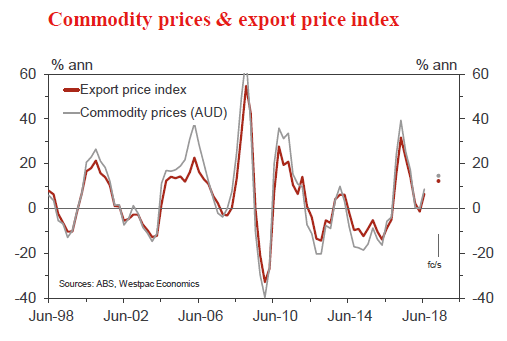
Export prices, after a soft patch through mid-2017, moved higher over the three quarters to June 2018.
In Q2, the export price index for goods increased by 1.9% to be 6.6% higher than in mid-2017.
For the September quarter, we expect export goods prices to lift by 2.2%, reflecting the impact of the weaker dollar and higher commodity prices. This would have the export price index 12% higher over the year.
The terms of trade for goods, on these estimates, increased by about 1.3% in the September quarter.
As to prices for services, an update will be available with the release of the Balance of Payments on December 4.
Aus Q3 import price index
- Nov 1, Last: 3.2%, WBC f/c: 0.9%
- Mkt f/c: 1.0%, Range: 0.5% to 2.2%
Prices for imported goods increased by 3.2% in the June quarter to be 6.0% above the level a year earlier. The lift in prices is centred on rising global energy prices and, more recently, the impact of a lower Australian dollar.
For the September quarter, we expect import prices to rise by a further 0.9% to be 8.7% higher than a year ago.
The currency was mixed in the quarter, moving lower against the US dollar, down 3.4%, but little changed on a TWI basis, following falls over the previous three quarters.
Oil prices moved higher once again, increasing the cost of imported fuels.
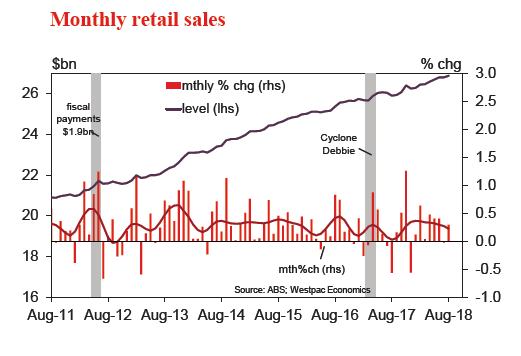
Aus Sep retail trade
- Nov 2, Last: 0.3%, WBC f/c: 0.2%
- Mkt f/c: 0.3%, Range: 0.1% to 0.6%
Retail sales increased 0.3% in August, holding annual growth at 3.8%yr but tracking a slower 3.2% annual pace over the last six months.
Indicators have been mixed in September. Consumer sentiment continued to unwind the mild positive boost from May's tax cut announcement, the change of PM, mortgage rate increases, and house price declines also impacting. Private business surveys showed soft readings amongst retail responses to the NAB survey but a lift in the AiG PSI. Aside from positives around population growth and job gains, July's extension of the GST to low value imported goods may be giving some support. On balance, we expect September to show a 0.2% gain. However, we are wary of downside risks with potential drags from the housing slowdown and some signs that the discretionary durables spend is being cut back (vehicle sales in particular look to be down about 5% in Q3).
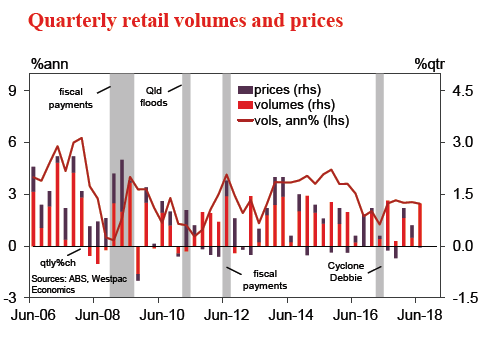
Aus Q3 real retail sales
- Nov 2, Last: 1.2%, WBC f/c: 0.4%
- Mkt f/c: 0.4%, Range: 0.2% to 0.8%
The Q2 retail report was a rare win for the sector with sales volumes posting a robust 1.2% gain that followed a choppy run of gains around a lacklustre trend over the previous three quarters (0.2%, 0.8%, 0.2%). Despite the improved result, annual growth remained subdued at 2.5%yr.
The Q3 update is likely to show a moderation. Nominal sales tracking towards a 0.6% gain for the quarter (vs 1.1% in Q2). On prices, the Q3 CPI detail is not yet available but our estimates point to a firmer retail deflator with droughtinfluenced food price increases contributing to an overall gain closer to 0.2%qtr than the –0.1%qtr dip in Q2. While the absence of price data makes the picture more uncertain than usual, the mix suggests retail volumes are likely to have posted a more subdued 0.4% gain in Q3.
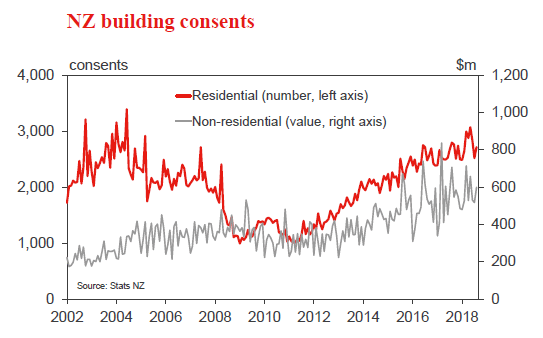
NZ Sep residential building consents
- Oct 31, Last: +7.8%, WBC f/c: -10%
Residential dwelling consent issuance rose by 7.8% in August. That strong increase was in part due to a large number of apartment consents in Auckland. As consents for apartments tend to be issued in lumps, we expect this will be followed by a pullback in September. We're forecasting a 10% drop over the month, which would still leave the annual figure at high levels.
Looking through the month-to-month volatility associated with apartment consents, the real focus is on the longerterm trend for Auckland. There, population pressures and regulatory changes have prompted a strong lift in consent numbers for standalone and medium-density houses. We expect that annual consent numbers in Auckland will remain strong at around 13,000.
NZ Oct ANZ business confidence
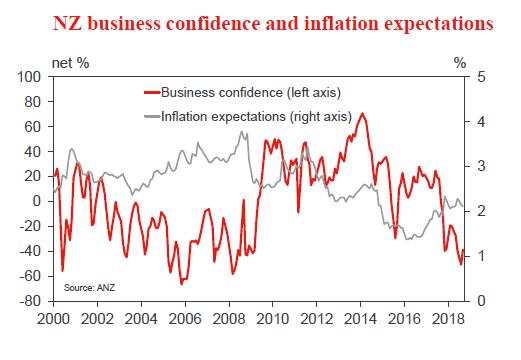
- Oct 31, Last: -38.3
Business confidence improved a little in September, but remained at very low levels. There were also small improvements in other components of the survey, including the outlook for firms' own activity. However, investment intentions deteriorated further.
The level of business confidence continues to suggest downside risk to the growth outlook. However, other more direct indicators of economic activity suggest growth has maintained reasonable momentum heading into the second half of the year.
Confidence surveys have shown a pickup in inflation pressure over the last year. In September pricing intentions rose further. We saw further rises in petrol prices over the early part of the month and this could put further upward pressure on inflation gauges in the October survey.
US Oct employment report
- Nov 2, nonfarm payrolls, last 134k, WBC 190k
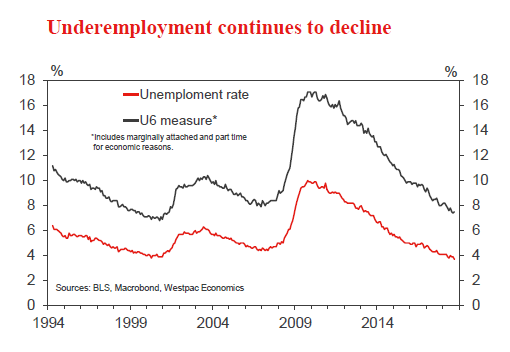
- Nov 2, unemployment rate 3.7%, WBC 3.7%
The September employment report again highlighted the susceptibility of nonfarm payrolls to poor weather, the 134k gain for the month well below the 3, 6 and 12-month averages. However, upward revisions to prior months made up for any disappointment. Coming out of hurricane season, the US economy is likely to again print a strong gain for jobs in November, likely in the region of 190k. Risks around revisions are skewed to the upside.
For the unemployment rate, recent strength in employment growth points to a holding of the 3.7% level. However, such a result is conditional on unchanged participation.
Hourly earnings growth will also remain a focus, with only a modest uptrend in place. To our mind, only when prime-aged participation heals will the wage growth trend accelerate.
UK Bank of England Bank Rate
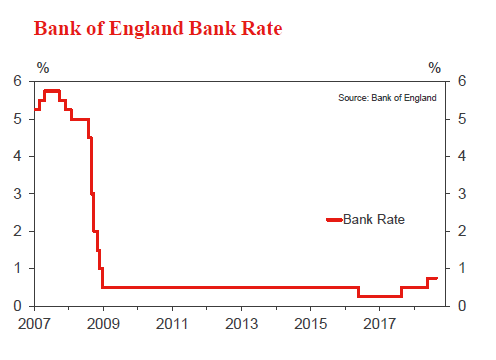
- Nov 1, Last: 0.75%, WBC f/c: 0.75%, Mkt f/c: 0.75%
The Bank of England left the Bank rate at 0.75% at its September policy meeting. The BOE also maintained its very modest tightening bias, reiterating that future increases are likely to be "at a gradual pace and to a limited extent".
Since the September policy decision, there have been mixed developments. Economic activity is continuing to expand at a moderate pace and unemployment remains low. However, inflation has eased back more than expected, and the slow pace of Brexit negotiations continues to cloud the outlook. Against this backdrop, we expect the BOE to remain on hold in November. The accompanying statement is likely to retain a very gradual tightening bias from September, but more weight may be given to uncertainties around the economic outlook.
Weekly Focus: Central Bank Optimism Despite Growth Risks
Market movers ahead
- In the US , the most important release is the jobs report for October on Friday, where we look for further signs that wage growth is accelerating.
- The focus remains on the ongoing Italian budget fight, while markets will also keep an eye on the euro area October HICP figures after recent months' core inflation misses.
- In the UK the most important event is the budget release, while we do not expect any policy changes from the Bank of England on Thursday.
- In China the focus turns to October manufacturing PMI, while we expect the Bank of Japan to keep its 'QQE with yield curve control' policy unchanged on Wednesday.
- In Scandinavia , markets will be paying attention to Danish FX reserve figures for October, as DKK has hovered on the weak side.
Global macro and market themes
- PMIs in Europe and the US disappointed, adding to recent trend of weaker growth momentum, but central banks in Europe still seem keen to move on with policy tightening.
- The gloves are off in Italy's budget fight, which could eventually result in the Commission launching an excessive deficit procedure against Italy.
- Global risks sentiment remains under pressure, but we still think it is too early to adjust the portfolio for a downturn.
Sunset Market Commentary
Markets
Global core bonds gained ground today as risk-sentiment deteriorated overnight. US equity markets closed yesterday’s session with gains but disappointing after-market Q3 results from important tech companies (Amazon, Alphabet (Google)) alarmed investors. Safe haven flows were in play with US Treasuries continuing the upward move from yesterday’s close. European bonds followed the move north as Asian and European equities join the risk-off trade today. Markets stabilized at noon, awaiting US Q3 GDP results. UST’s lost some ground ahead of the announcement. The US growth slowed less than expected in Q3, with the economy expanding 3.5% in Q3, coming from a 4.2% in Q2, beating market consensus of 3.3%. Treasuries eased temporarily, to pair some of the intraday gains but the move didn’t last. At the time of writing, UST’s resumed their upward trend. German Bunds behaved in a similar way but with a smaller magnitude. The German yield curve shifted down with changes between -1.9 bps (2-yr) and -4.3 bps (10-yr). The US yield curve bull steepened with moves ranging from -2.3 bps (30-yr) to -4.4 bps (2-yr). Intra-EMU peripheral bond spreads initially widened, but sentiment improved later in the session.
A few US tech giants reported disappointing earnings/guidance yesterday evening. It was enough for yesterday’s equity rebound to reverse into a new risk-off selling wave. Asian equities were sold and several EM currencies came again under pressure. Of late, the dollar didn’t always profit from a risk-off environment. However, this time, the dollar (ex USD/JPY) was again the preferred save haven destination. Major FX cross rates were captured by classic safe risk-off dynamics with EUR/USD, EUR/JPY and USD/JPY all trending south during the European morning session. Investors were looking out whether US markets would extend this risk-off trade. Or would the US Q3 GPD release ease investor fears on growth? EUR/USD changed hands in the 1.1340/45 area before the publication of the release. US Q3 GDP release was solid, but close to expectations. The risk-off trade eased a bit after the publication of the US growth report. EUR/USD and USD/JPY regained a few ticks, but the FX reaction is very limited after all. US equities open with substantial losses, but futures are off the intraday lows. The jury is still out whether the risk-off trade will ease going into the weekend. EUR/USD is trading in the 1.1350 area. The key 1.1301 support stays within reach. USD/JPY tries to sustain/regain the 112 big figure.
Sterling stayed in the defensive today. The UK currency touched a multi-week low against the dollar (below 1.28). EUR/GBP also maintained yesterday’s gain as investors are worried on the inability of the UK government/ conservative party to agree on an unequivocal and workable Brexit approach. The global risk-off context also doesn’t help sterling. EUR/GBP trades currently around 0.8865. Cable hovers near 1.28.
News Headlines
The US economy expanded a solid 3.5% Q/Qa in the third quarter, according to the first estimate released by the US Commerce department today. The figure was close to market expectations. Growth was again mainly driven by personal consumption (4.0% Q/Q). A build-up of inventories also supported overall growth (2.07% growth contribution). Net exports were a drag on Q3 growth (negative growth contribution of 1.78%). Part of the negative trade impact was due to frontloading of soya exports at the end of Q2 as exporters tried to avoid trade tariffs in China, imposed from early July.
The Russian central bank (CBT) left its key interest rate stable at 7.5% after an unexpected 25bp raise in September. The bank said the market situation had stabilized but is wary of the external risks (i.e. US sanctions). The CBT nevertheless hinted at future (December?) hikes to counter rising inflation. USD/RUB gains a few ticks (65.9) today, but that is largely due to a stronger USD.
Dow Jones Outlook: Bears Look for Eventual Break Below 24544 Fibo Support
Dow Jones Dec future contract was slightly higher after better than expected US Q3 GDP on Friday and still holding above pivotal support at 24544 (Fibo 61.8% of 23050/26962 Feb/Oct rally), where downside attempts were repeatedly rejected. Extended consolidation is expected to precede fresh weakness as overall structure is bearish and stocks remain in negative mode on fears about global growth and trade, with concerns over corporate profits, adding to negative sentiment. Negative reports that sent lower Dow components: SNAP; CL and CMG in pre-market trade on Friday, boost negative outlook ahead of the Friday's session. Bearish techs add to negative sentiment as index is on track for strong bearish weekly close and probes through weekly cloud top (24713) would add to negative tone on weekly close below cloud top. Bears look for eventual close below 24544 Fibo support to signal continuation of steep fall from 26962 03 Oct record high). Broken 200SMA (25127) is expected to cap upticks and keep bears intact.
Res: 24825; 25020; 25127; 25233
Sup: 24510; 24305; 24166; 24000
U.S. Real GDP Continued to Grow at a Strong Rate in Q3
The U.S. economy continues to grow at a strong rate, which likely will induce the Federal Reserve to continue raising rates at a gradual pace.
Strong Growth in Consumer and Government Spending
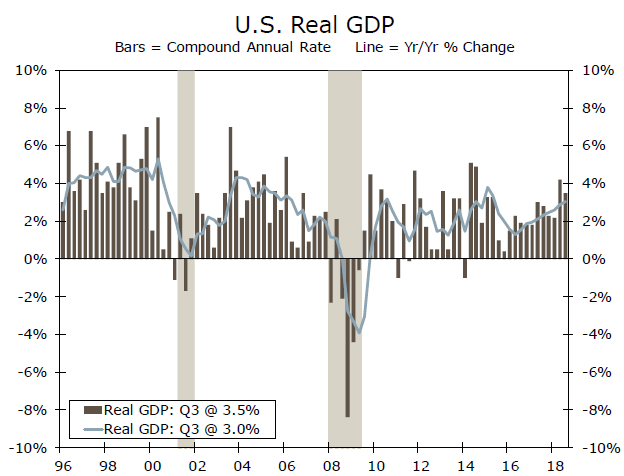
U.S. real GDP grew at an annualized rate of 3.5% in Q3-2018 on a sequential basis (top chart). The outturn, which was a bit stronger than the consensus forecast, represents a modest downshift from the 4.2% rate that was notched up in Q2. The overall rate of real GDP growth in the third quarter was driven in part by robust growth in real personal consumption expenditures (PCE), which surged 4.0%. The strength in real PCE in Q2 (3.8%) and Q3 likely reflects, at least in part, the boost to real disposable income that was delivered by reductions in personal income tax rates earlier this year.
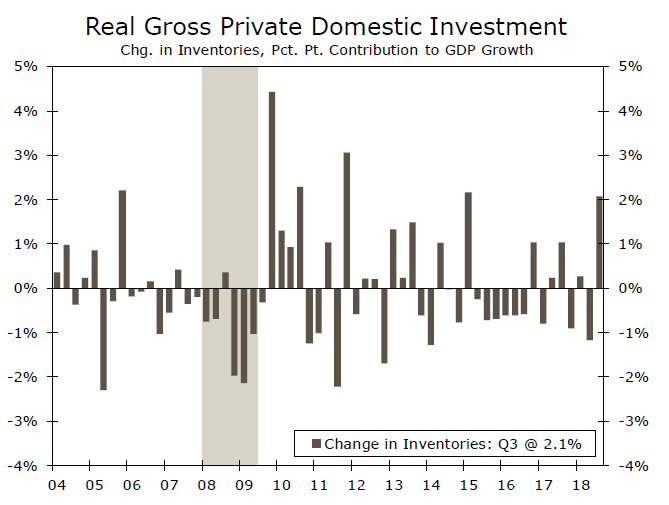
The effects of expansionary fiscal policy also showed up in government spending, which shot up 3.3% in the third quarter, the strongest sequential rate of growth in more than two years. Another boost to real GDP growth in the third quarter came from stock-building. Inventories dropped $37 billion in the second quarter, so businesses ramped up production in Q3 to rebuild depleted stocks. The $76 billion rise in inventories in Q3 added 2 percentage points to the overall GDP growth rate (middle chart).
Drags from Fixed Investment and Net Exports
But not everything was positive in the GDP accounts. Specifically, overall fixed investment spending contracted 0.3%. Although real spending on intellectual property grew 7.9% and spending on equipment edged up 0.4%, growth in these investment components was not strong enough to offset the 7.9% drop in non-residential construction and the 4.0% decline in residential construction. In that regard, many recent indicators point to leveling off, if not some outright contraction, in the housing market. It appears that affordability issues and higher mortgage rates may be exerting some drag on the housing market.
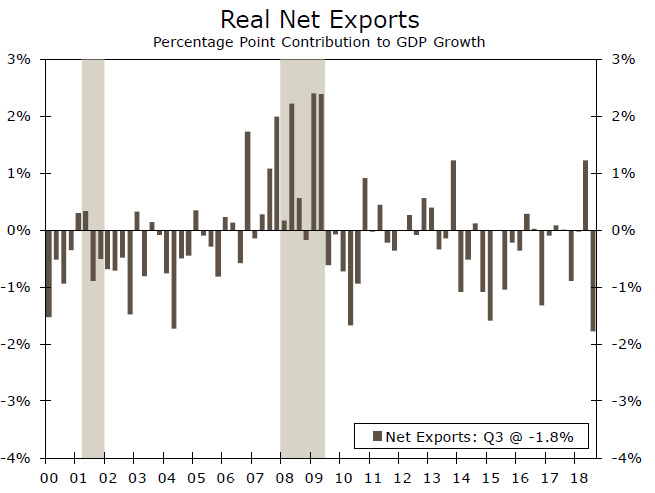
Net exports, which shaved off 1.8 percentage points from the topline GDP growth rate in the third quarter, was another area of weakness (bottom chart). The seesaw pattern of export growth recently—exports jumped 9.3% in Q2 but contracted 3.5% in Q3—reflects the effects of tariffs. Specifically, exports of soybeans surged in Q2 as farmers shipped their crops ahead of the implementation of foreign tariffs, but soybean exports have pulled back more recently, at least through the first two months of Q3.
Which Way Forward?
Growth downshifted a bit in Q3 and we look for some further slowing in the quarters ahead. That said, the U.S. economy continues to grow in excess of the rate that most analysts consider to be its long-run potential growth rate. Consequently, the unemployment rate, which has dropped to its lowest level (3.7%) in nearly 50 years, likely will recede further in coming months. With the labor market more or less at "full employment" and with some measures of inflation trending higher, we look for the Federal Reserve to continue raising rates at a gradual pace for the next year or so.
U.S. Q3 GDP Growth Stronger than Expected
Highlights:
- US Q3 GDP growth rose 3.5% which was down from the 4.2% gain in Q2 though stronger than the 3.3% expected going into the report.
- Final domestic demand rose 3.1% with inventories adding an additional 2.1 ppts. while net exports subtracted 1.8 ppts. as imports surged 9.1%.
- The annual increase in the core PCE deflator rose to 2.0% from 1.9% in Q2.
Our Take:
The U.S. Q3 GDP report implied continued solid above-potential growth of 3.5% with a slight upward surprise relative to market expectations. Growth in final domestic demand of 3.1% was generally in line with expectations though with the composition indicating greater strength in consumer spending being offset by greater weakness in both residential and business investment. The inventory change adding 2.1 percentage points while net exports subtracted a greater-than-expected 1.8 percentage points. The greater drag from the latter largely reflected a sizeable 9.1% jump in imports. The imposition of the U.S. tariffs on $200B of Chinese imports effective September 24 likely contributed to businesses advancing delivery of these imports, potentially for sale over the Christmas sales period, and placed in inventories until the seasonal demand emerges. The fourth quarter will likely see a drawdown of these inventories though the negative impact on GDP growth will be largely tempered by softer imports (which enters into the GDP calculation with a negative sign.) The solid above-potential growth reported in today’s GDP report is pushing the U.S. economy even further beyond capacity. This excess demand is starting to send inflation measures higher with today’s report indicating the annual rate of increase in the core PCE measure rising to 2.0% from the Q2 reading of 1.9% and 1.5% a year ago. Continued strong growth in conjunction with inflation measures moving higher are expected to keep the Fed tightening policy. Our forecast assumes another 25 basis point hike before the end of this year and similar-sized hikes every quarter through the end of next year. This results in the upper end of the Fed’s target range rising to 3.50% by the end of 2019 from a current 2.25%.
US: Hot Consumer Spending Leads the U.S. Economy to Expand at a 3.5% Pace in Q3
The U.S. economy followed through on its exceptional 4.2% (annualized) performance in Q2 with an impressive 3.5% pace of growth in Q3, slightly above consensus. Impressive growth in consumer spending was a key factor behind the solid growth tally.
Real personal consumer spending grew 4.0% in the quarter. That showing is even more impressive considering it comes on the heels of a 3.8% pace in Q2. This marks the strongest two-quarter pace for consumption in over three years. Strength was broadly based across goods and services, but spending on clothing and recreational goods and vehicles were particularly impressive, posting double digit gains.
Business investment took a breather in the third quarter, up only 0.8%, after setting a blistering pace in the first half of the year. Spending on structures fell 7.9%, after surging 14.5% and 13.9% in the previous two quarters. Investment on equipment was also soft, up only 0.4%, coming off a string of strong quarters. Spending on intellectual property held up better, rising 7.9%.
A 4% contraction in residential investment was another soft spot in the third quarter. That marks the third consecutive quarter of contraction, as new home construction is facing several headwinds, and activity in the resale market remains subdued.
Government spending ramped up further in the third quarter, as overall government spending (including state and local) rose 3.3%. Fiscal stimulus was also evident in a 3.3% gain in federal government expenditure, concentrated in defense spending (+4.6%). Growth in spending at the state and local level has also been healthy, rising 3.2%.
As expected, exports fell back (-3.5%) from their Q2 surge, with the downturn in foods, feeds and beverages (primarily soybeans). Imports grew an impressive 9.1%, mostly concentrated in motor vehicles and consumer goods. On net, trade subtracted 1.8 percentage points from growth after providing a 1.2% boost in Q2.
Hefty inventory stockpiling more than offset the drag from trade in Q3, boosting growth by 2.0 percentage points. That more than recoups its 1.2 percentage point drag in the previous quarter.
Hurricane Florence made initial landfall on September 14th, causing significant damage most notably in the Carolinas. The BEA stated, however, that it is not possible to estimate the overall impact of Florence on third quarter GDP.
Key Implications
The labor market is strong, consumer confidence is high and the wallets of Americans have been feeling a little fatter since the tax cuts earlier this year. So it isn't too surprising that consumer spending is healthy, but a 4% pace surpassed our expectations. That said, we expect that the growth surge in Q2-Q3 represents the high water mark for the U.S. economy. Growth is expected to come off the boil over the next year as the fuel from fiscal stimulus is spent, but still grow above the economy's potential. This should help keep inflation pressures brewing and gradual rate hikes on track.
On the other hand, while we expected business investment to take a breather in Q3, it cooled a bit more than expected, and this is where the risks going forward lie. Tensions on the trade front have already distorted trade data, and dented business confidence domestically and abroad. It is increasingly likely that this could delay investment in affected sectors in the coming quarters. It may be a bit early to call the investment slowdown in the third quarter the new trend, but if investment spending continues to be soft, dampening economic growth, the Fed would likely temper the pace of rate hikes.
So far though, there is certainly enough momentum to warrant another hike in December, bringing the upper end of the target range to 2.5%.
FX Strategy – Rise in Fed Funds Could Put an Early End to QT
- Upward pressure on the Fed funds rate continues and it now equals the IOER.
- Likely to see another 20bp 'adjustment' hike to IOER in December, but more importantly, it may speed up the Fed's discussion about ending QT next year.
- In our view, 6-12M EUR/USD FX forwards are still priced too low.
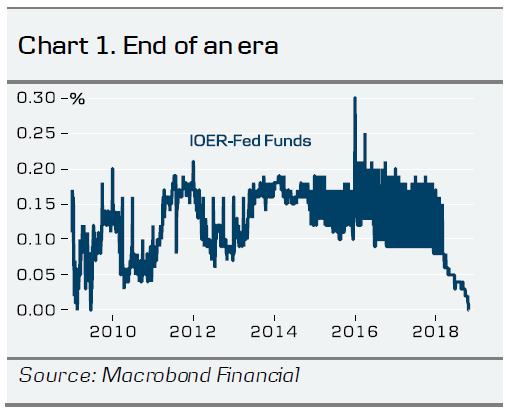
End of an era
This week, the effective Federal Funds rate (Fed funds) rose to 2.20. It means that it is now trading at par with the interest on excess reserves (IOER). That further marks the end of an era, where banks have received a higher interest rate by buying reserves rather than lending excess funds in the overnight money market (see Chart 1). That the Fed funds rate now equals the IOER is in itself less important. Keep in mind that among European central banks employing a corridor system, it is the norm that the overnight money market rate is above the central bank deposit rate. In the big picture, what is important to consider is that the Fed funds rate is creeping towards the upper bound of the Fed's target range again – it is now 5bp below than it was in May. The Fed prefers the Fed funds rate to be in the middle of its target range, which means it is about 7.5bp too high now.
Has the Fed underestimated the impact of QT?
The reoccurring upward pressure on Fed funds rate is mainly a result of the quantitative tightening (QT) policy, where the Fed reduces its holdings of US Treasuries and mortgage-backed securities and at a similar pace reduces the supply of reserves in the money market – see Chart 2 for the link between supply of reserves and the Fed funds rate. It thus beg the question, of whether Fed's QT policy is discordant with its interest rate policy, or at least whether the scope for further reduction of the balance sheet is limited.
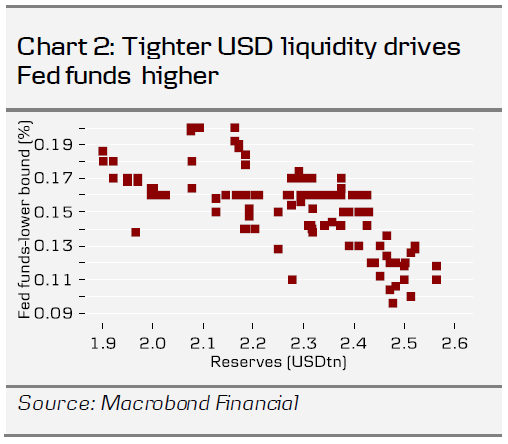
When the Fed made an 'adjustment' hike in June (by hiking only IOER 20bp), where the gap between Fed funds and the upper bound was also 5bp, Fed Chair Jerome Powell said during the Q&A session that, 'we don't expect to have to do this often or again, but we're not sure about that. If we have to do it again, we'll do it again', but here we are again already four months later. Furthermore, a working paper from a Boston Fed economist (see here) estimated that the effect on the Fed funds from QT in January 2019 would be 2bp. Taking into account the IOER adjustment, the effect has so far been 9bp.
Potential for early end to QT
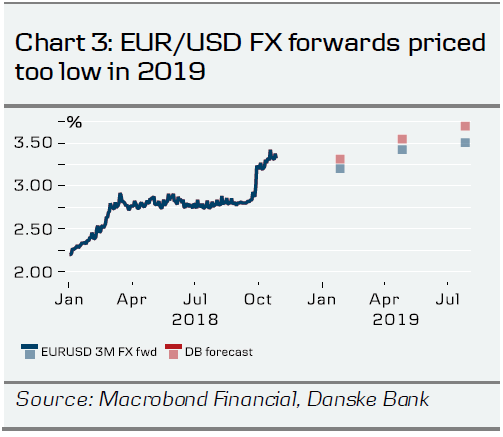
We are likely to see another 20bp 'adjustment' hike of the IOER in December, but there is also the possibility of a 5bp cut in November or a mere 15bp hike in December. However, in our view, the main implication is that it raises the potential for an early end to QT, i.e. the Fed ending it in H1 next year, while consensus is likely to still expect the Fed to continue QT into 2020. We note that US Congress is likely to have a preference for the Fed's balance sheet to return to a lower level. We have already factored this into our projection of EUR/USD FX forwards (Chart 3). Hence, we still see 6-12M EUR/USD FX forwards priced too low.
BTCUSD in Weak Momentum in Short-Term; Descending Triangle Still Holds
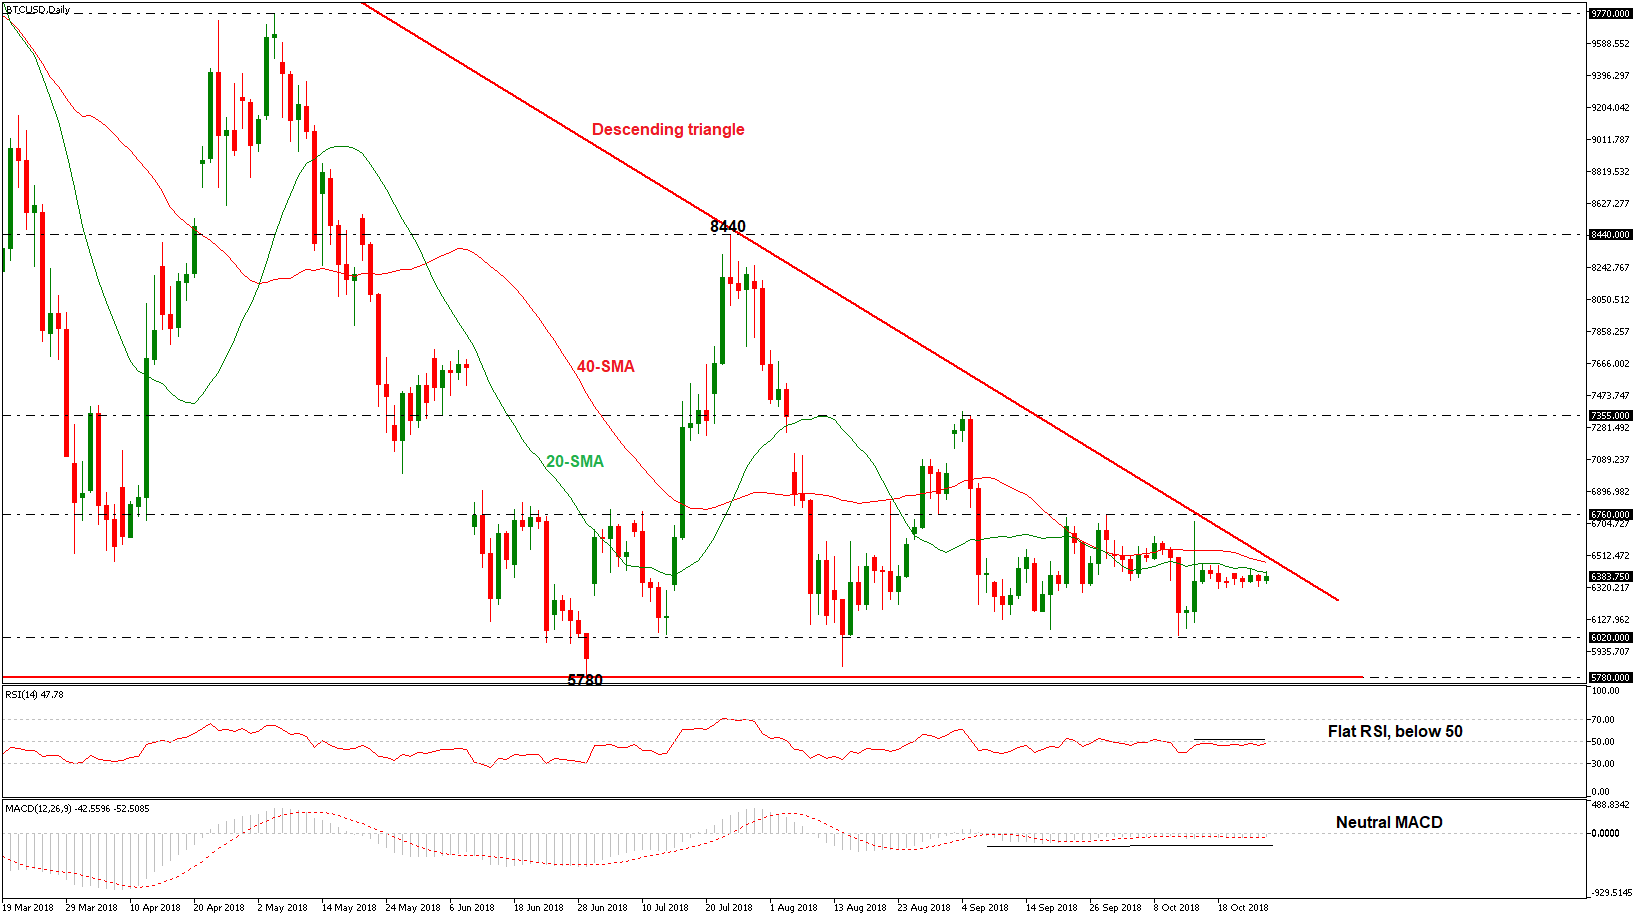
BTCUSD is moving sideways with weak momentum in a descending triangle pattern over the last eight months with a strong support obstacle being the 5780 barrier. The price found significant resistances on the 20- and 40-simple moving averages (SMAs) in the daily timeframe, over the last couple of weeks and has failed to create a rally above them.
In the short-term, the RSI indicator is moving slightly below the neutral threshold of 50 with weak movement, while the MACD oscillator is flattening around its trigger and zero lines, indicating that the pattern may stay in place for the next few sessions.
In case of a bearish move the price could challenge the 6020 support level before stretching south towards the 5780 barrier. A successful penetration of this hurdle would turn investors’ attention towards the 4890 support level, identified by the high of September 2014. A step lower could enhance the bearish sentiment, sending the price probably towards 2974, identified by the low of September 2017.
An alternative scenario is a surpass of the 20- and 40-SMAs which are acting as significant resistances at 6410 and 6470 respectively at the time of writing. If the bulls take the reins, BTCUSD could rise until the 6760 resistance level, penetrating the descending trend line to the upside. Steeper increases could also touch the 7355 barrier shifting the long-term bearish outlook to a more neutral to bullish one.
In the medium-term picture, the price remains in a bearish mode as it holds in a descending reversal pattern, which suggests that the next move could be to the downside rather than to the upside.
US 30 Index Turns Bearish in the Short-Term
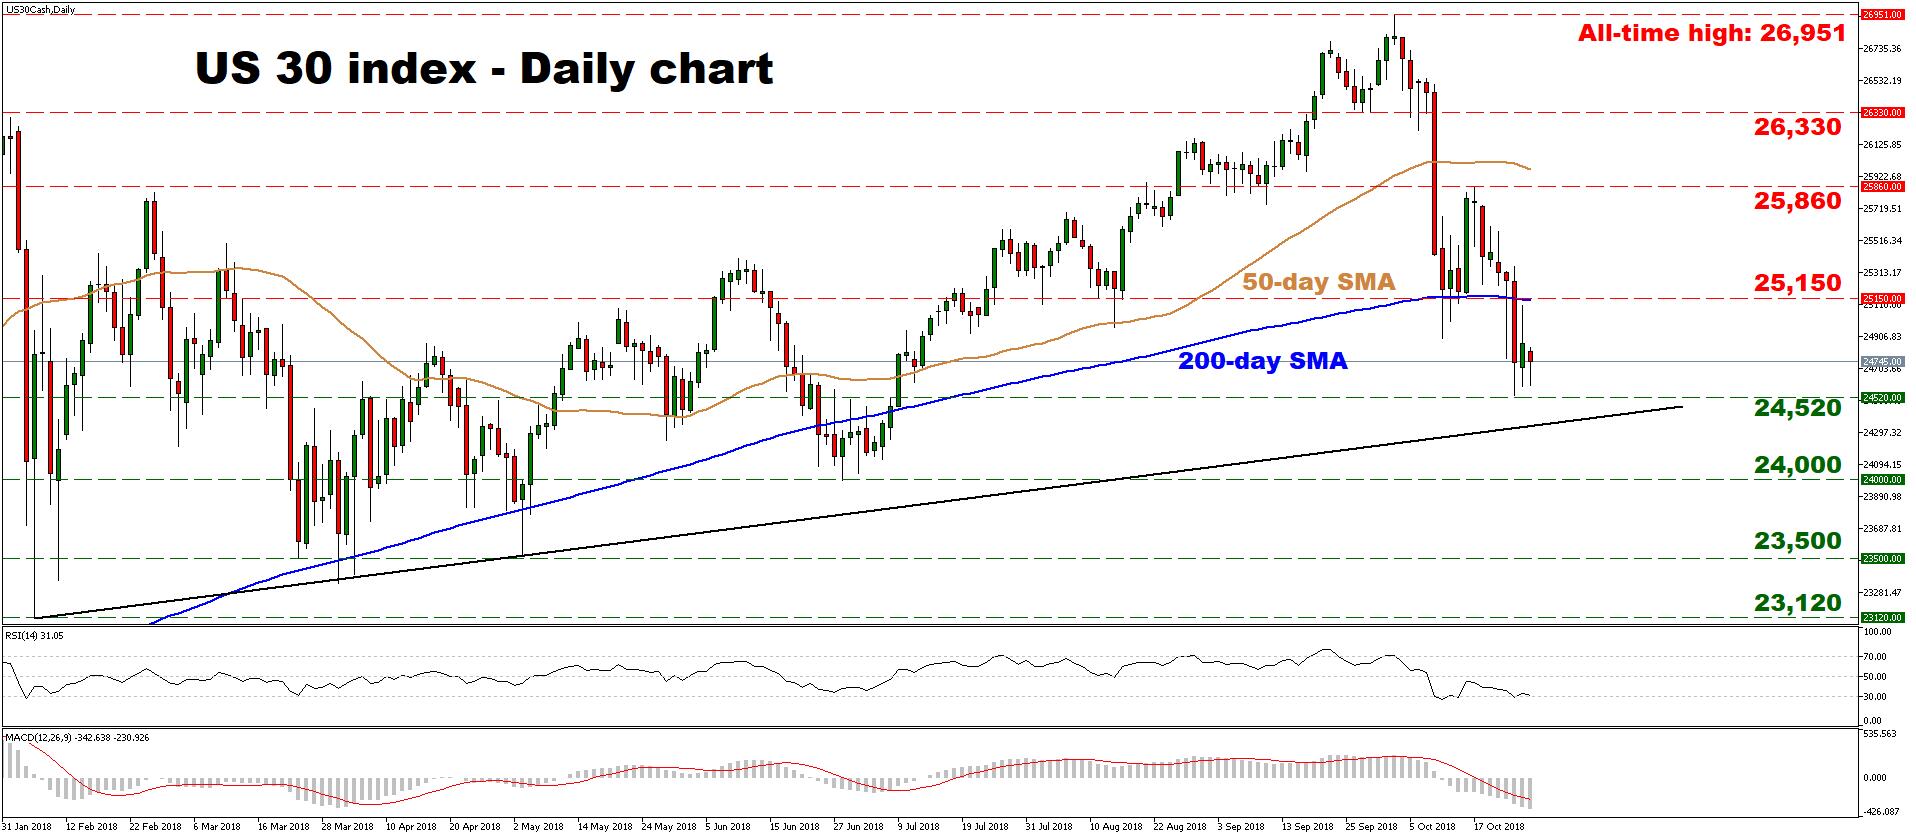
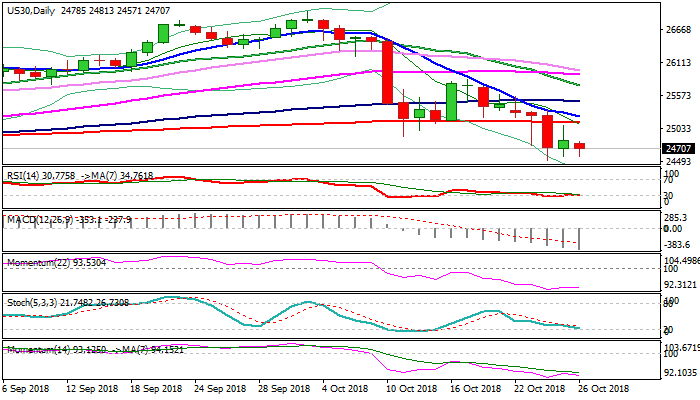
The US 30 index recorded considerable losses in recent weeks, touching a 3½-month low on October 24, and falling below both its 50- and 200-day simple moving averages (SMA). Hence, the short-term bias has turned negative, though the fact that the market is still trading above an uptrend support line drawn from the lows of February 6 keeps the medium-term outlook neutral for now.
Taking a look at short-term oscillators, the RSI – already below its neutral 50 line – is currently testing its oversold 30 level. Although its detecting accelerating downside momentum, the fact that it is nearing oversold waters suggests that a near-term rebound shouldn’t be ruled out. Meanwhile, the MACD is negative and below its red trigger line.
Further declines in the index could encounter a first line of support near the crossroads of the 24,520 level and the aforementioned uptrend line. A clear close below this area, would turn the medium-term outlook negative as well, likely setting the stage for more declines – initially towards the round figure of 24,000. Even lower, the bears could stall near the 23,500 hurdle, marked by the lows of May 3.
On the flipside, a rebound may find preliminary resistance near the 25,150 line, where the 200-day SMA is currently located as well. An upside break of this zone would shift the short-term bias back to neutral, potentially paving the way for a test of the 25,860 barrier – this being the high of October 17. Even higher, sell orders may be found around 26,330, an area defined by the inside swing low of September 27.
All in all, the short-term outlook is negative, and a decisive close below the 24,520 territory and the uptrend line would shift the medium-term outlook to negative as well.