Sample Category Title
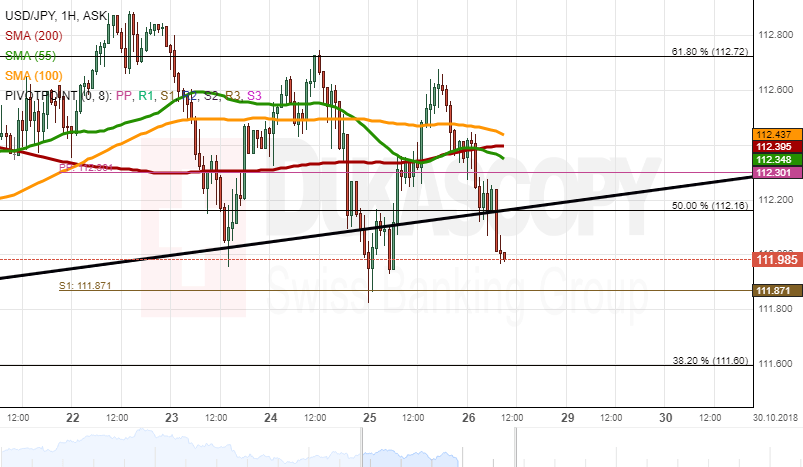
USD/JPY Analysis: Supported By 50.00 % Fibo
During Thursday's trading session, the currency pair passed through the support of the weekly PP at 112.30 to end the trading day at 112.27. On Friday, the US Dollar was trading in a range between the monthly PP and the 50.00% Fibo at 112.23.
In regards to the near-term future, most likely, the US Dollar will trade sideways in the range due to the support of the 50.00% Fibo and the resistances of the weekly PP at 112.30 and the 55-hour simple moving average.
However, the rate could break the resistance levels if the US Dollar will appreciate against the Japanese Yen after the US Advance GDP q/q data release at 12:30 GMT on Friday.
GBP/USD Analysis: Trades At 1.2780
During Thursday's trading session, the British Pound passed through the resistances of the weekly S2 at 1.2880 and the 62.20% Fibo at 1.2867 to end the trading day at 1.2814 mark. On Friday morning, the rate was trading sideways at the 1.2818 mark.
In regards to the near-term future, most likely, the British pound will move towards the monthly S1 at 1.2778 to trade at the 1.2780 level. The simple moving averages will try to catch up the rate during the trading session.
Besides, none of today's fundamental news could affect the exchange currency pair to surge upwards to the 62.20 % Fibo or break the support levels of the monthly S1 at 1.2778 and weekly S3 at 1.2749 on Friday.

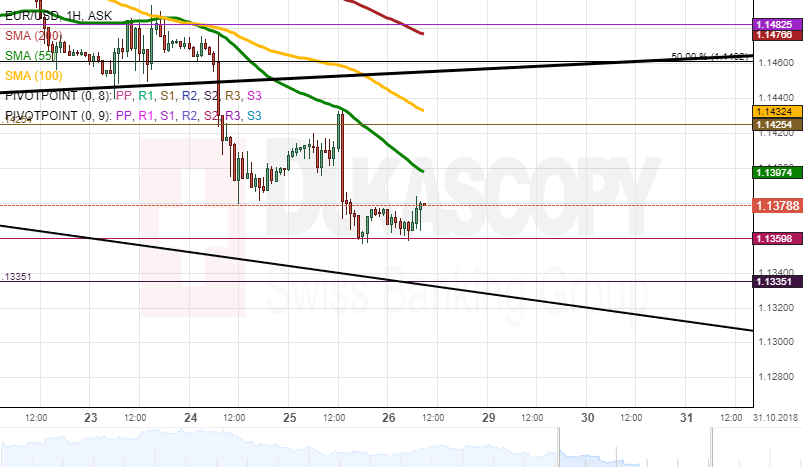
EUR/USD Analysis: Retraces To S2 At 1.1359
During Thursday's session, the currency pair was retraced by the 55-hour simple moving average to end the trading day at 1.1367. On Friday morning, the European Single Currency was supported by the monthly S2 to trade at the 1.1373 mark.
In regards to the near-term future, most likely, the currency pair will be supported by the monthly S2 at 1.1359 to trade sideways at the 1.1360 level. The 55-hour SMA will try to catch up the rate during the day.
On the other hand, the rate could pass through the support of the monthly S2 to depreciate to the weekly S2 at 1.1335 due to the resistance of the 55-hour SMA and the US Advance GDP q/q data release at 12:30 GMT on Friday.
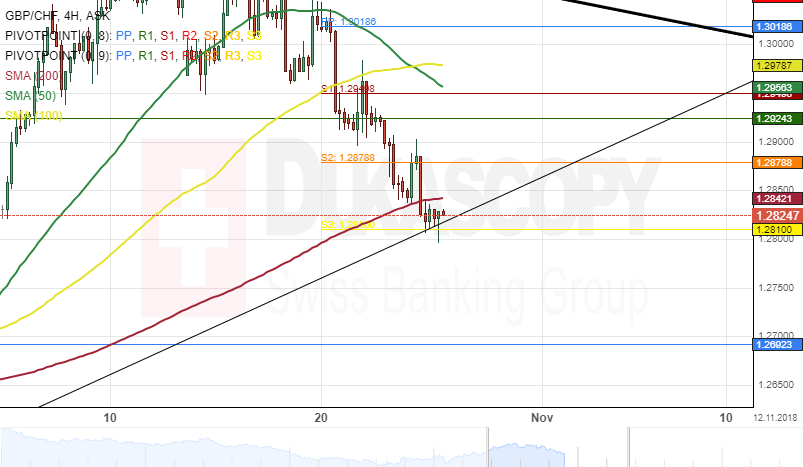
GBP/CHF 4H Chart: Potential Decline
The British Pound began to appreciate against the Swiss Franc after reaching the lower boundary of a long-term descending channel at 1.2400. this surge started early September and had since reached near July swing high of 1.3229.
Currently, the exchange rate is trading near the bottom border of a one-month ascending channel pattern at 1.2810 and could be set for a breakout.
Furthermore, given that the three SMAs is above the price level, and the 200-hour simple moving average is providing resistance for the currency pair at 1.2841, the GBP/CHF currency exchange rate is likely to aim at the monthly support level at 1.2692 during the following trading sessions.
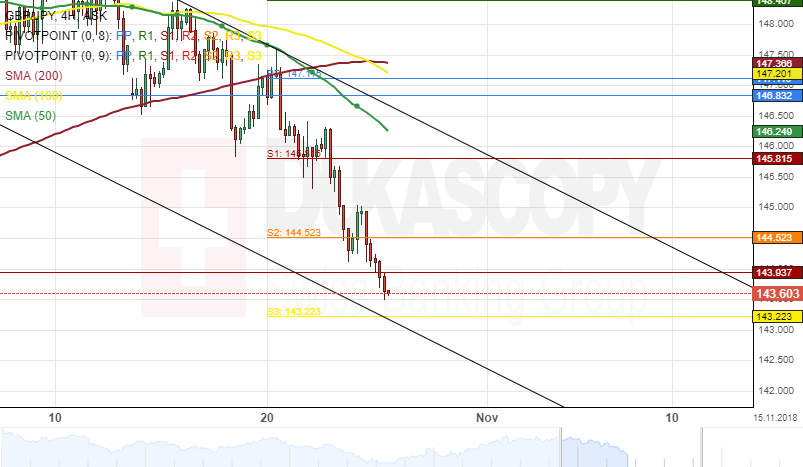
GBP/JPY 4H Chart: Moving Towards August Swing Low
The Pound Sterling started to depreciate against the Japanese Yen after hitting the upper boundary of a dominant descending channel pattern at 149.50. This decline began on October 9 and had since reached a one-month low level of 143.93.
The exchange rate is trading near the lower boundary of a three-week descending channel at 143.93 during the morning hour of Friday's session and could be set for a breakout.
If the breakout occurs, the GBP/JPY currency exchange rate will aim at August swing low at the 140.00 mark during the following trading sessions.
However, a support level formed by the weekly S3 could hinder the pair from hitting the target within the next 48 hours.
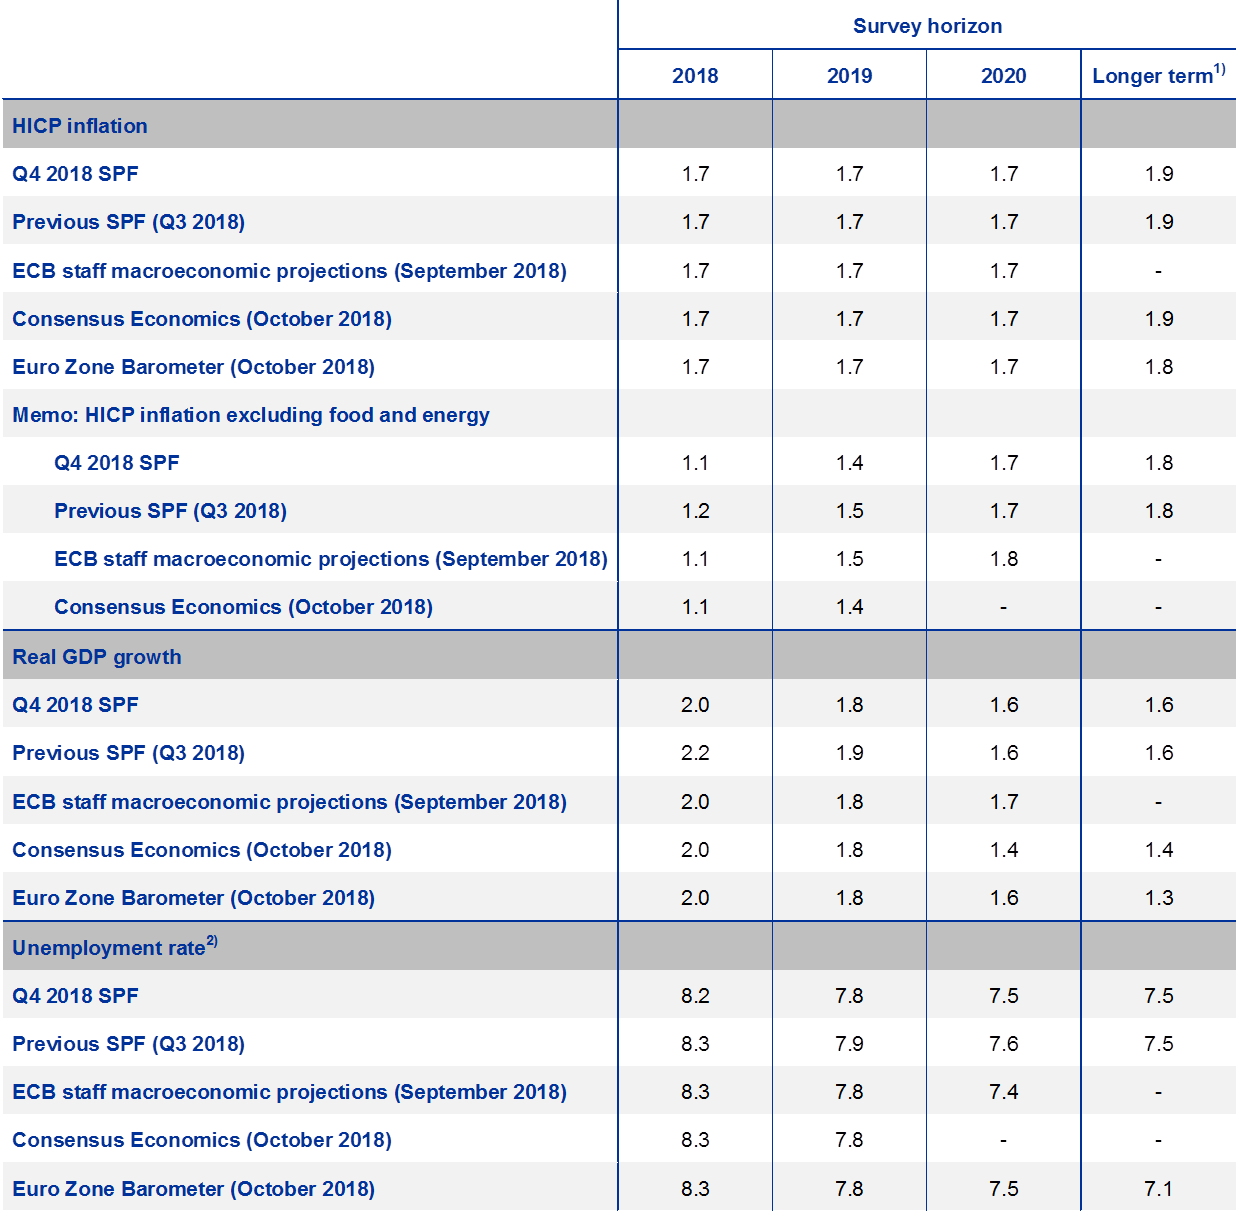
ECB: Professional forecasters lowered core inflation and GDP growth forecasts
The latest ECB Survey of Professional Forecasters (SPF) showed unchanged projections for headline inflation for 2018, 2019 and 2020. But Core inflation, excluding food and energy forecasts were revised slightly lower. Also, expectations for real GDP growth were also revised lower.
Headline inflation is projected to be at 1.7% in 2018, 1.7% in 2019 and 1.7% in 2020, unrevised. Core inflation is projected to be at 1.1% in 2018, 1.4% in 2019 and 1.7% in 2020, revised slightly down. ECB noted "he expected pick-up in underlying inflation remained underpinned by a pick-up in annual growth in compensation per employee, which was expected to increase to 2.3% by 2020." The convergence with between headline and core inflation is still a development that's welcomed by the ECB.
GDP growth is projected to be at 2.0% in 2018, 1.8% in 2019 and 1.6% in 2020. There were downward revision of -0.2% for 2018 and -0.1% for 2019. ECB noted "respondents typically attributed their revisions to external factors such as higher energy prices weighing on disposable income, with many also noting that they had now incorporated into their baseline forecasts at least some dampening impact on exports and investment due to increased uncertainty surrounding the outlook for world trade. "
The Analytical Overview Of The Main Currency Pairs
The EUR/USD currency pair
Technical indicators of the currency pair:
Prev Open: 1.13914
Open: 1.13722
% chg. over the last day: -0.14
Day's range: 1.13580 – 1.13836
52 wk range: 1.1299 – 1.2557
The single currency continues to show negative dynamics. The pressure is provided by weak economic reports from the eurozone. Yesterday, the EUR/USD quotes again updated local minima. The ECB, as expected, kept the main parameters of monetary policy at the same level. At the moment, the EUR/USD currency pair is consolidating in the range of 1.13550-1.13850. Positions must be opened from these marks.
The news feed on 26.10.2018:
At 15:30 (GMT+3:00) a report on US GDP will be published.
We also recommend paying attention to the speech of the ECB President Mario Draghi.
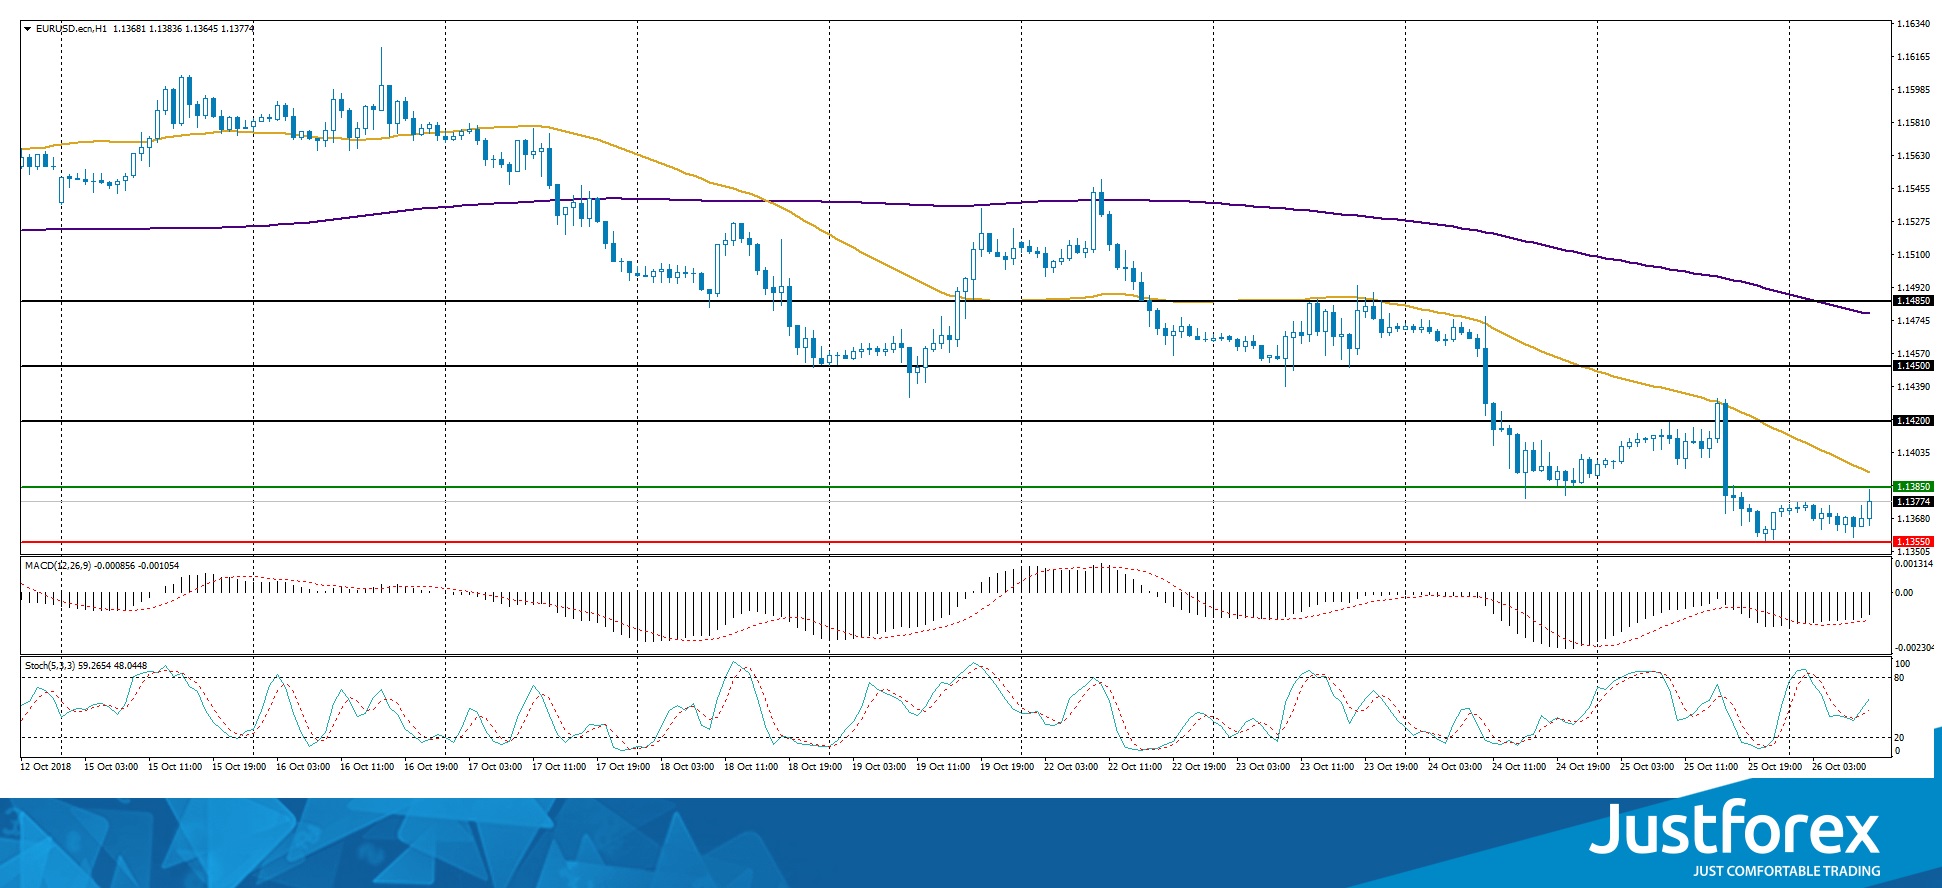
The price has fixed below 50 MA and 200 MA, which indicates the power of the sellers.
The MACD histogram is in the negative zone, but above the signal line, which gives a weak signal to sell EUR/USD.
The Stochastic Oscillator is in the neutral zone, the %K line is above the %D line, which indicates a possible correction of the EUR/USD quotes.
Trading recommendations
Support levels: 1.13550, 1.13000
Resistance levels: 1.13850, 1.14200, 1.14500
If the price fixes below the local support level of 1.13550, a further fall in the EUR/USD quotes is expected. The movement is tending to the round level of 1.13000.
Alternative option. If the price fixes above the “mirror” resistance of 1.13850, one should look for entry points to the market to open long positions. The movement is tending to 1.14200-1.14500.
The GBP/USD currency pair
Technical indicators of the currency pair:
Prev Open: 1.28794
Open: 1.28154
% chg. over the last day: -0.47
Day's range: 1.28026 – 1.28243
52 wk range: 1.2662 – 1.4378
The GBP/USD currency pair continues to update local minima. During yesterday's trading, the drop in quotes exceeded 65 points. At the moment, the trading instrument is consolidating near the round level of 1.28000. The local resistance is the mark of 1.28300. Shortly technical correction is not excluded. We recommend opening positions from key levels.
Publication of important economic reports from the UK is not planned.
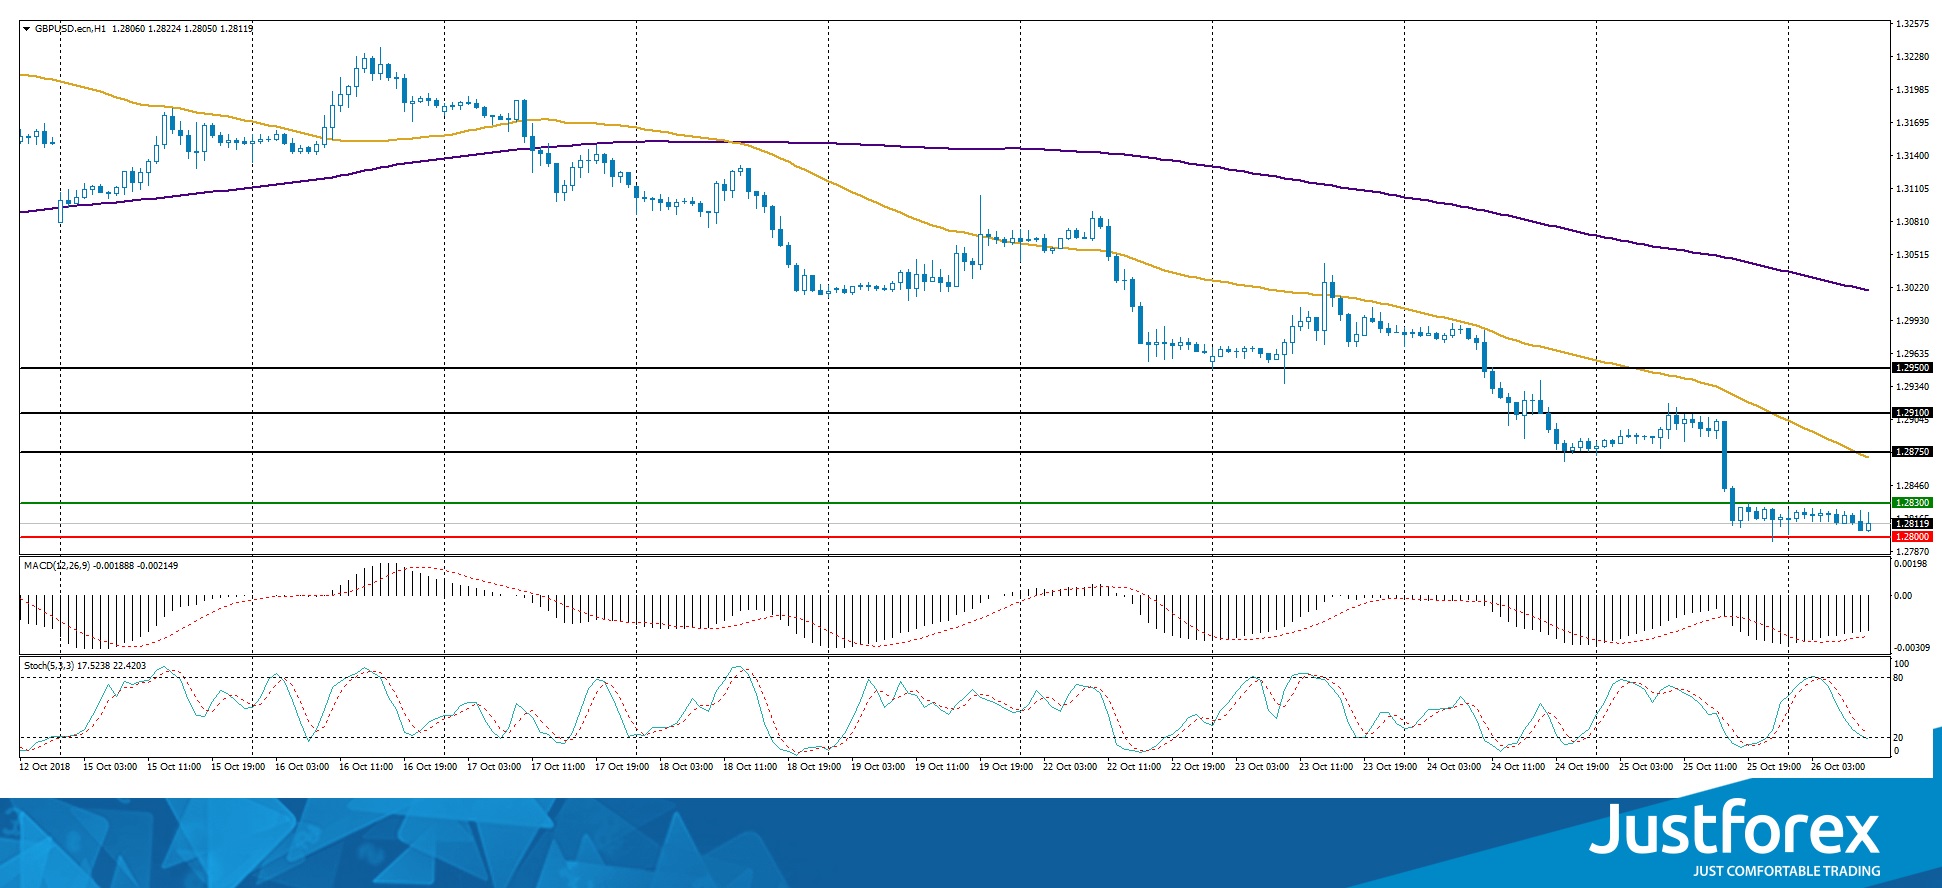
The price has fixed below 50 MA and 200 MA, which indicates the power of sellers.
The MACD histogram is in the negative zone, but above the signal line, which gives a weak signal to sell GBP/USD.
Stochastic Oscillator is in the neutral zone, the %K line is below the %D line, which also indicates the bearish sentiment.
Trading recommendations
Support levels: 1.28000, 1.27500
Resistance levels: 1.28300, 1.28750, 1.29100
If the price fixes below the round level of 1.28000, a further fall in the GBP/USD currency pair is expected. The movement is tending to 1.27600-1.27400.
Alternative option. If the price fixes above 1.28300, it is necessary to consider buying GBP/USD. The movement is tending to the "mirror" resistance level of 1.28750.
The USD/CAD currency pair
Technical indicators of the currency pair:
Prev Open: 1.30556
Open: 1.30677
% chg. over the last day: +0.14
Day's range: 1.30672 – 1.31439
52 wk range: 1.2248 – 1.3387
The USD/CAD currency pair has been growing. During yesterday's and today's trading, the growth of quotes was more than 80 points. The trading instrument approached the key resistance of 1.31500. The 1.31200 mark is already a "mirror" support. The USD/CAD currency pair has the potential for further growth. We recommend paying attention to the US GDP report. Positions should be opened from the key levels.
Today, the news feed on the Canadian economy is calm.
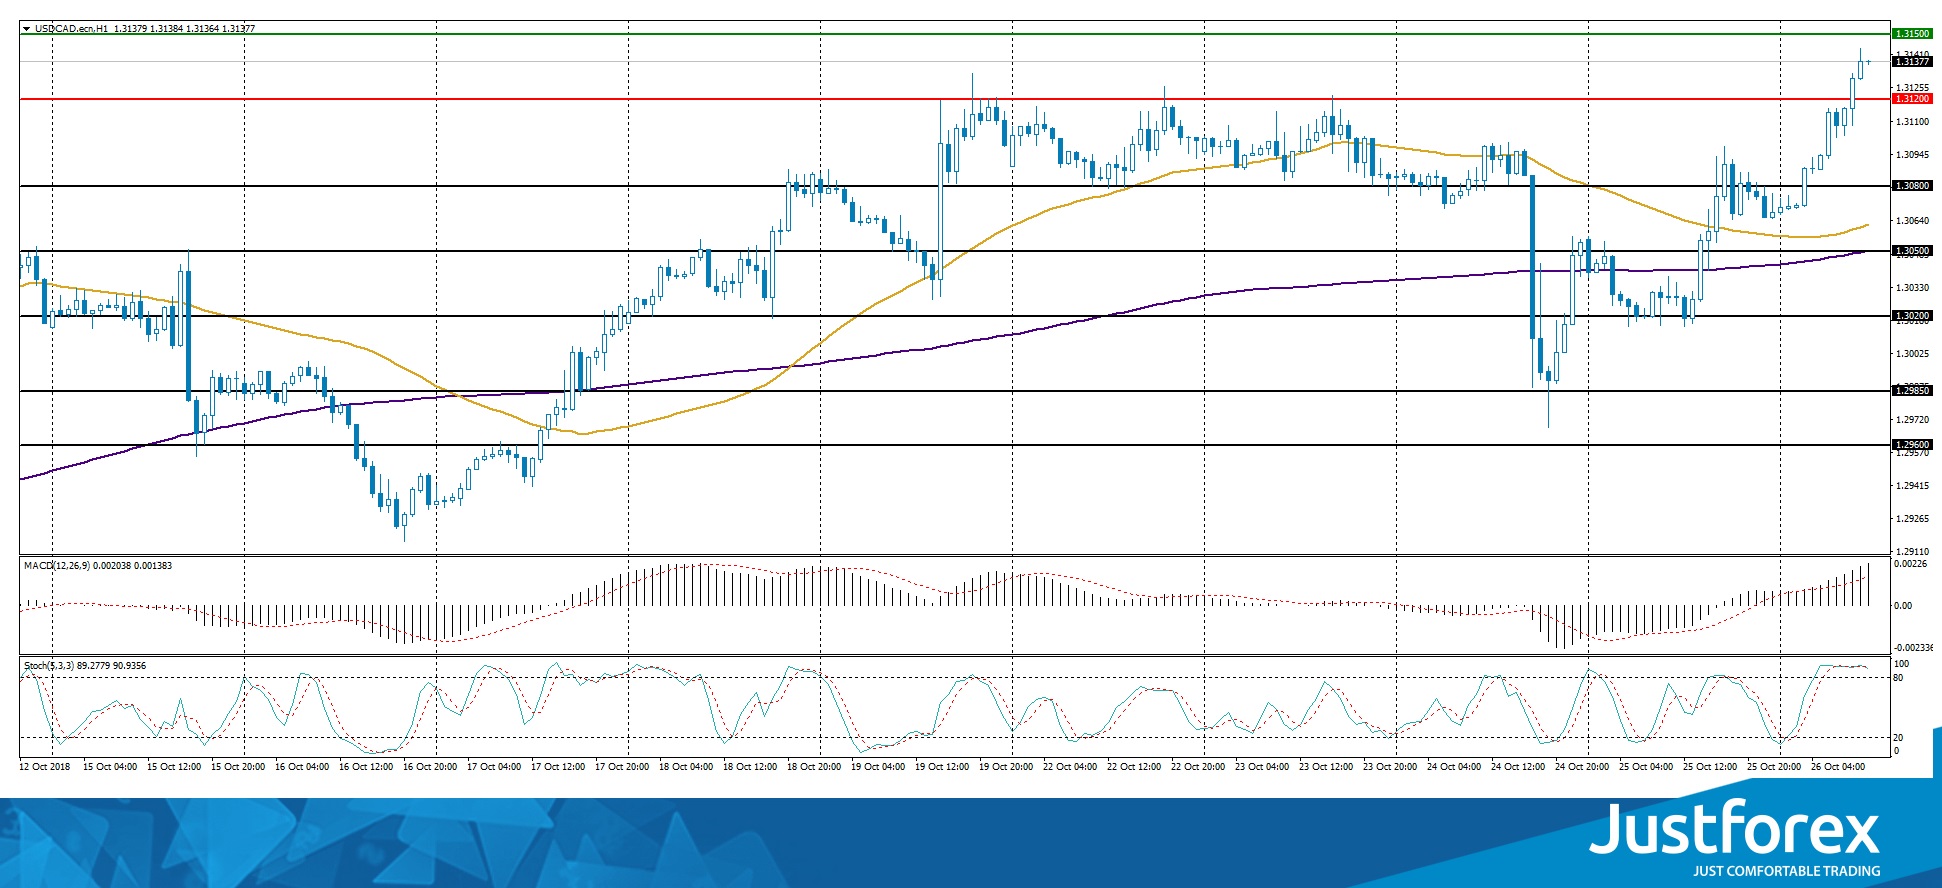
The price has fixed above 50 MA and 200 MA, which indicates the power of buyers.
The MACD histogram is in the positive zone and above the signal line, which gives a strong signal to buy USD/CAD.
Stochastic Oscillator is in the overbought zone, the %K line has crossed the %D line. There are no signals at the moment.
Trading recommendations
Support levels: 1.31200, 1.30800, 1.30500
Resistance levels: 1.31500, 1.32000
If the price fixes above the level of 1.31500, further growth of the USD/CAD quotes is expected. The movement is tending to the round level of 1.32000.
An alternative may be the decrease of the USD/CAD currency pair to 1.30800-1.30600.
The USD/JPY currency pair
Technical indicators of the currency pair:
Prev Open: 112.214
Open: 112.397
% chg. over the last day: +0.07
Day's range: 111.990 – 112.440
52 wk range: 104.56 – 114.74
The USD/JPY currency pair is still being traded in a prolonged flat. Unidirectional trend is not observed. At the moment, the USD/JPY quotes are testing the round level of 112.000. The nearest resistance is at 112.350. Investors expect a report on US GDP. Positions must be opened from key levels. We also recommend paying attention to the yield of US government bonds.
The news feed on the Japanese economy is calm.
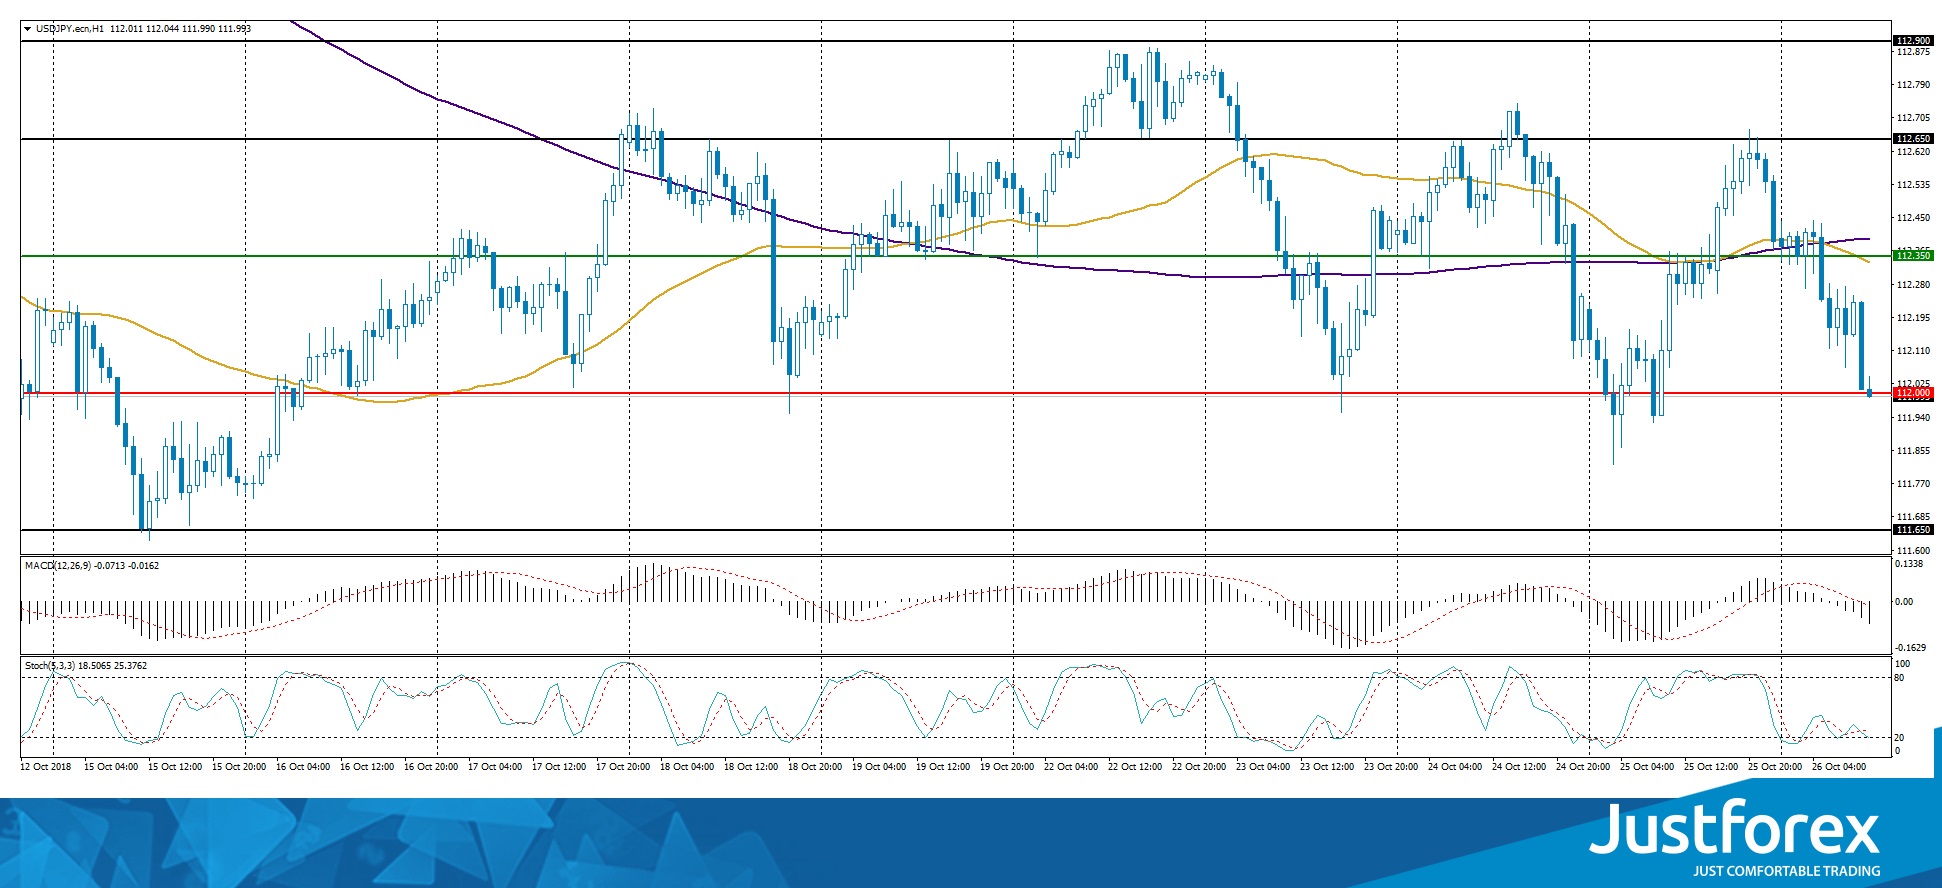
Indicators do not send accurate signals: 50 MA has crossed 200 MA.
The MACD histogram has moved to the negative zone, indicating the bearish sentiment.
The Stochastic Oscillator is located near the oversold zone, the %K line has crossed the %D line. There are no signals at the moment.
Trading recommendations
Support levels: 112.000, 111.650
Resistance levels: 112.350, 112.650, 112.900
If the price fixes below the support level of 112.000, the USD/JPY quotes are expected to fall. The movement is tending to 111.600-111.400.
An alternative could be the growth of the USD/JPY currency pair to 112.600-112.900.
USDCAD Price Action Suggests Test Of 1.3150/74 Area
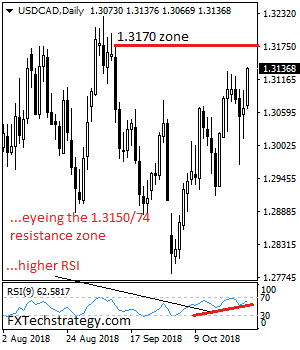
USDCAD price action suggests a further move higher and test of its key resistance at 1.3150/74 area. Support lies at the 1.3100 level where a break will target at the 1.3050 level. Further down, support comes in at the 1.3000 level. On further move lower, the pair may aim at the 1.2950 support level. On the upside, resistance lies at the 1.3150/74 levels where a violation will turn attention to the 1.3200 level. Further up, resistance resides at the 1.3250 level and then the 1.3300 level. Its daily RSI is bearish and pointing higher suggesting further weakness. All in all, USDCAD looks to strengthen further with trend resumption in the cards.
NIESR on no-deal Brexit: BoE to hike to above 2.5% on surge in inflation, but sharp slowdown in growth
The UK National Institute of Economic and Social Research (NIESR) said the UK economy has "recently gained momentum" with Q3 GDP growth at 0.7%. Under the main forecasts scenario, based on "soft" Brexit, 2019 growth forecasts were revised up to 1.9%, reflecting the stronger momentum. However, NIESR also warned that here is "an enormous amount of uncertainty" around the forecasts.
Under a no-deal Brexit scenario which UK has to revert to trade under WTO rule, growth is projected to slow sharply down to just 0.3% in 2019. Unemployment rate will jump to 5.8% in 2020. Inflation will surge above BoE's target range in 2019, forcing BoE to raise interest rate to above 2.5% in 2019, next year.
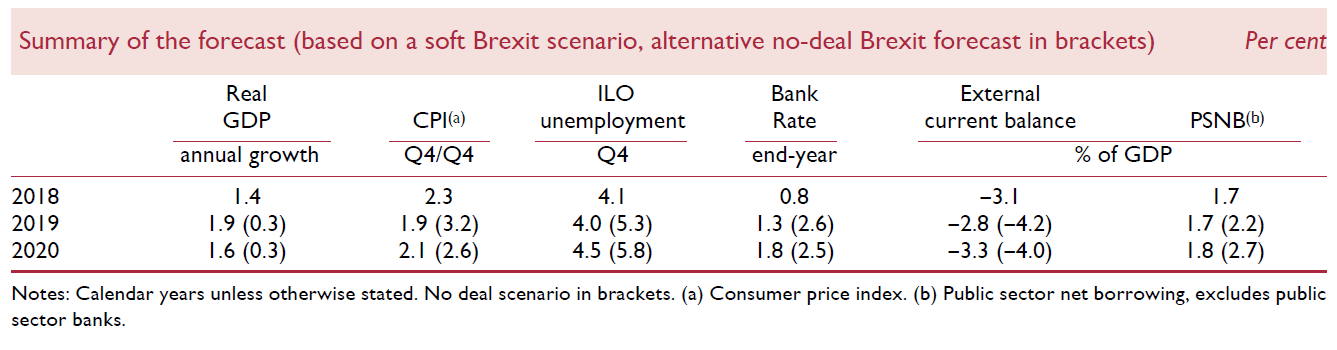
The summary of new forecasts show, under a soft Brexit scenario, GDP to grow 1.4% in 2018, 1.9% in 2019 and than slow to 1.6% in 2020. CPI is expected to slow from 2.3% in 2018 to 1.9% in 2019 and then climb back to 2.1% in 2020. Unemployment is projected to drop from 4.1% to 4.0% in 2019 then rise back to 4.5% in 2020. BoE interest rate will rise from 0.8% to 1.3% in 2019 and then 1.8% in 2020.
However, under a no-deal Brexit, GDP growth will slow sharply from 1.4% to 0.3% in 2019, and 0.3% in 2020. Inflation will surge to 3.2% in 2019 before falling back to 2.6% in 2020. Unemployment rate will jump to 5.3% in 2019 and rise further to 5.8% in 2020. BoE will have to raise interest rate much faster to 2.6% in 2019 before dropping to 2.5% in 2020.
Full forecast will be published later on October 31.
ECB Remains On Hold And The Eur Weakens
ECB kept interest rates unchanged at 0.0%, however disappointing comments by Mario Draghi weakened the EUR. The bank reaffirmed yesterday, that its QE program would end this year and that it would hike its interest rates after summer 2019. Overall, the accompanying statement was similar to the previous one, implying a consistency in the policy guidance. However, the bank may have failed to convince the market about the future course of the inflation, hence doubts about ECB’s rates remain. Analysts point out that the risk is therefore to the downside for the EUR, as the guidance that interest rates will stay at current levels through summer 2019, may be pushed back. Overall, the bearish sentiment for EUR could continue today as financial releases could prove unfavorable for the EUR and credit ratings for France, Germany and most importantly Italy, are due out today.
EUR/USD dropped yesterday, breaking the 1.1385 (R1) support level (now turned to resistance). We continue to retain a bearish outlook for the pair as the downward trendline incepted since the 16th of October remains intact. It should be noted that the RSI indicator in the 4 hour chart remains near the reading of 30, implying an overcrowded short position. Should the pair continue to be under the market’s selling interest, we could see it breaking the 1.1345 (S1) support line and aim for the 1.1300 (S2) support level. Should on the other hand, the market start favouring the pair’s long positions, we could see the pair breaking the 1.1385 (R1) resistance line and aim for the 1.1430 (R2) resistance level.
Pound drops as Brexit fears reemerge
The prospect of a no deal in the Brexit negotiations weighs on the pound, which weakened against the USD yesterday. Media headlines report, that in case of a no Brexit deal, UK’s GDP could be lower, as much as 1.6% lower (if compared to a soft Brexit), reaching +0.3% yoy, fueling Brexit fears. Also media reports, show there to be a halt in the Brexit negotiations, due to disagreements within the UK team. We fear that such disagreements could be reflected at the negotiating table, weakening the position of UK. ECB president Mario Draghi, mentioned that the longer the negotiations drag on, the more should businesses prepare for a hard Brexit. We see the case for inner political disagreements, as well as a difficulty to reach consensus for the Irish border agreement and a possible alternate plan, to increase substantially the risks of a hard Brexit. The pound seems to currently remain under pressure and the UK’s credit ratings, which are to be released today, could increase volatility.
EUR/USD dropped yesterday, breaking the 1.2850 (R1) support level (now turned to resistance). We continue to retain a bearish outlook for the pair as the downward trendline incepted since the 16th of October remains intact. It should be noted, that the RSI indicator in the 4 hour chart remains below the reading of 30, implying an overcrowded short position. Should the bears continue to dictate the pair’s direction, we could see it breaking the 1.2780 (S1) support line and aim for the 1.2700 (S2) support level. Should bulls take over on the other hand, we could see cable breaking the 1.2850 (R1) resistance line and aim for the 1.2920 (R2) resistance level.
In today’s other economic highlights:
In the European session we get Germany’s GfK Consumer Sentiment indicator for November. In the American session, we get from the US the preliminary GDP growth rate for Q3 and the Baker Hughes oil rig count. As for speakers, ECB governor Mario Draghi speaks.
EUR/USD H4
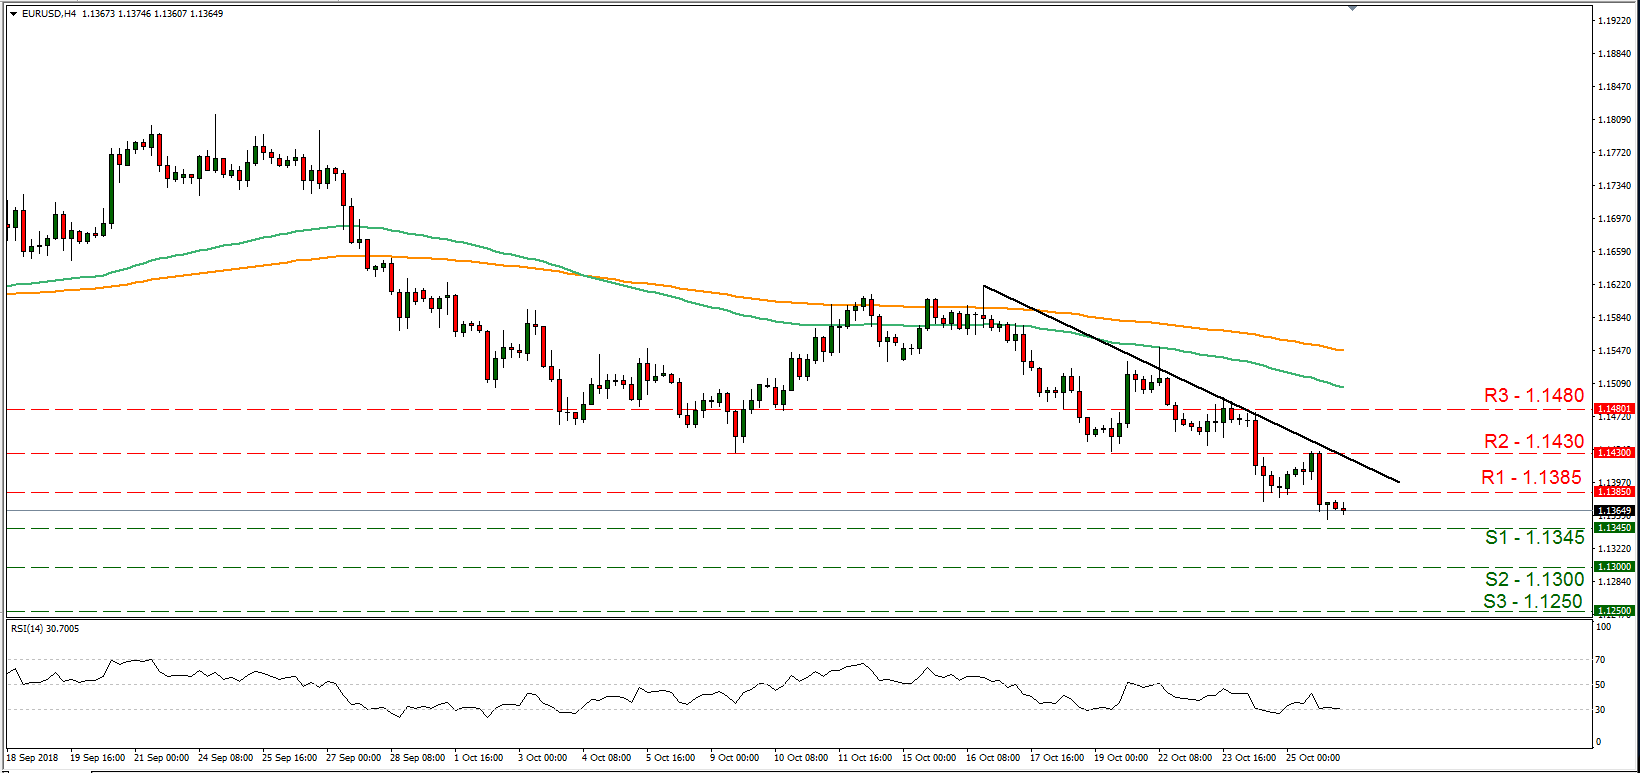
Support: 1.1345 (S1), 1.1300 (S2), 1.1250 (S3)
Resistance: 1.1385 (R1), 1.1430 (R2), 1.1480 (R3)
GBP/USD 4H
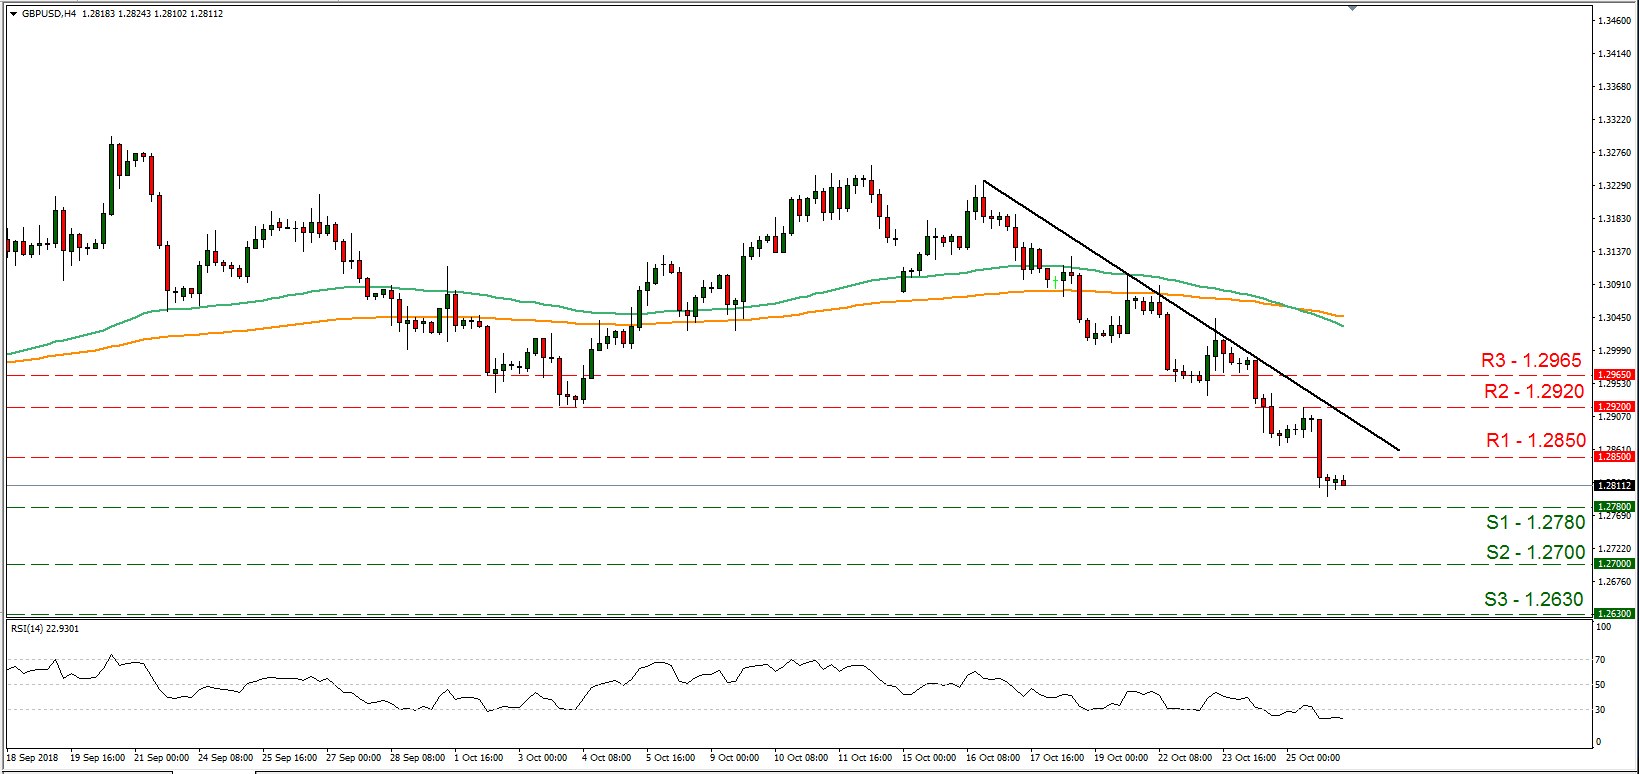
Support: 1.2780 (S1), 1.2700 (S2), 1.2630 (S3)
Resistance: 1.2850 (R1), 1.2920 (R2), 1.2965 (R3)