Sample Category Title
EUR/CHF Weekly Outlook
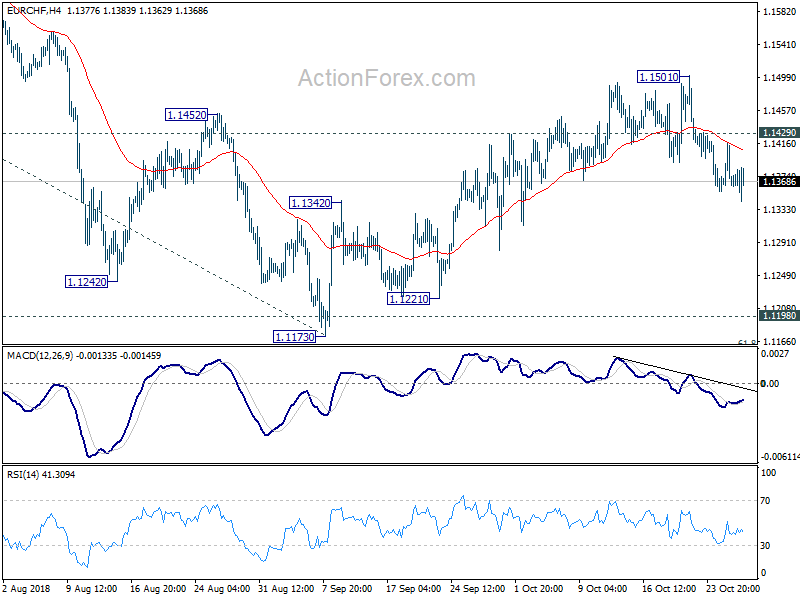
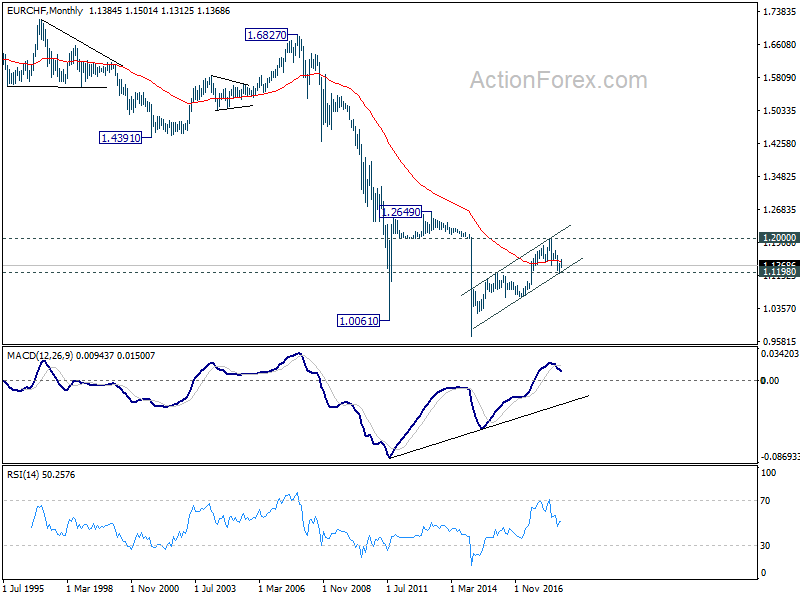
EUR/CHF edged higher to 1.1501 last week but dropped sharply since then. The development argues that corrective rise from 1.1173 has completed at 1.1501. Further decline is now expected this week as long as 1.1429 minor resistance holds. Deeper fall would be seen back to 1.1154/98 key support zone again. At this point, we'd still expect this key support zone to hold. On the upside, above 1.1429 minor resistance will turn focus back to 1.1501 first. But still, break there is needed to confirm rally resumption. Otherwise, risk will stay on the downside even in case of strong recovery.
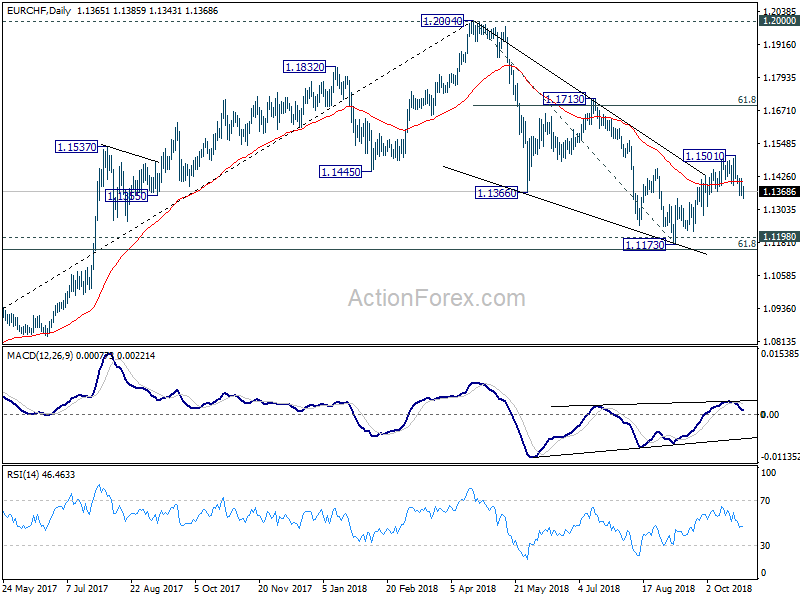
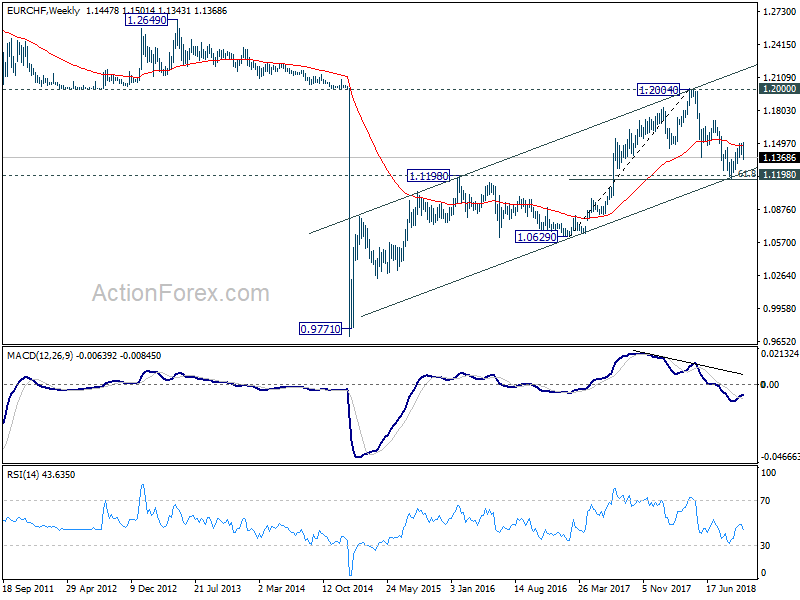
In the bigger picture, price actions from 1.2004 medium term top is seen as a correction only. Downside should be contained by support zone of 1.1198 (2016 high) and 61.8% retracement of 1.0629 to 1.2004 at 1.1154 to complete it and bring rebound. This cluster level is in proximity to long term channel support (now at 1.1243) too. A break of 1.2 key resistance is still expected in the medium term long term. However, sustained break of the mentioned support zone will mark reversal of the long term trend. In that case, 1.0629 key support will be back into focus.
Investors Starting to Change Their Mind on Fed Hike Path after Global Stock Market Rout
Global stock market rout intensified last week with major indices ended in deep red. Over the week, Nikkei was the worst performing one and lost -5.98%. S&P 500 was the worst one in the US and dropped -3.94%. NASDAQ closed down -3.78%, DOW down -2.97%. In Europe, DAX was the worst, closing the week down -3.06%. CAC followed and declined -2.31%. FTSE was relatively resilient as helped by free fall in Sterling, and closed down just -1.56%. China Shanghai SSE bucked the trend and closed up 1.90%.
Flight to safety sent global bond yield sharply lower. US 30-year yield lost -0.067 to 3.317, 10-year yield lost -0.121 to 3.077, 5-year yield lost -0.145 to 2.907. The decline was more serious at the shorter end. German 10 year bund yield dropped -0.101 to 0.362. It was above 0.5 just two weeks ago. Even Italian 10 year yield dropped -0.152 to 3.429. Though, German-Italian spread remains above 300. Japan 10 year JGB yield dropped -0.036 to 0.114, it was at 0.15 a week ago.
In the currency markets, Yen ended reasonably as the strongest one on risk aversion, in particular consider that Nikkei was the worst performer. Dollar ended as the second strongest. However, the greenback struggled to extend gains against all but Euro and Sterling. Also given the deepened selloff in the US markets, investors have been paring their bets on Fed's rate path in 2019. The greenback might lost more ground ahead if the coming set of data, ISMs and NFP, disappoints. Canadian Dollar was the third strongest after hawkish BoC rate hike.
Sterling was the weakest one on Brexit impasse and there is still no sign that the withdrawal deal could be done 100%. Further, there is even no sign the extra EU Brexit summit would be held in November. However, Sterling's outlook is a bit tricky indeed. NIESR forecast a very aggressive BoE rate path in 2019 should a no-deal Brexit occurs. We'll cover that below. New Zealand Dollar was the second weakest one. Euro was the third as weighed down by Italy-EU budget showdown as well as weak economic data.
Investors now less certain on Fed hikes in 2019, after stock market crash
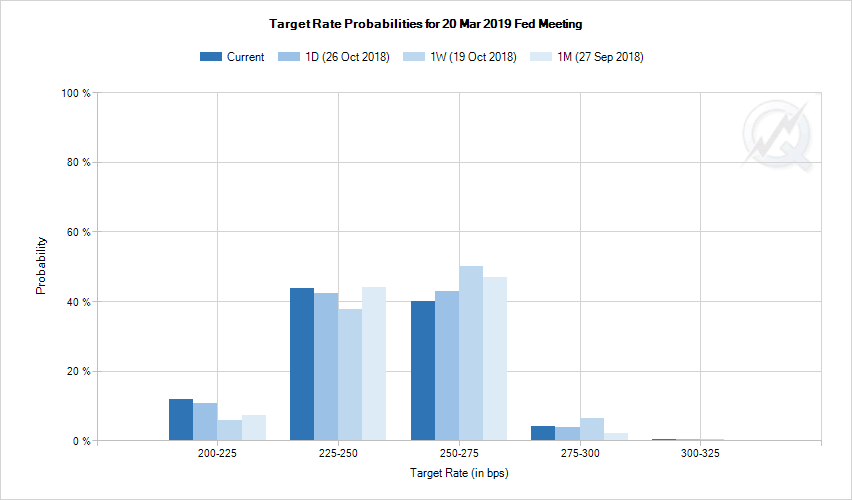
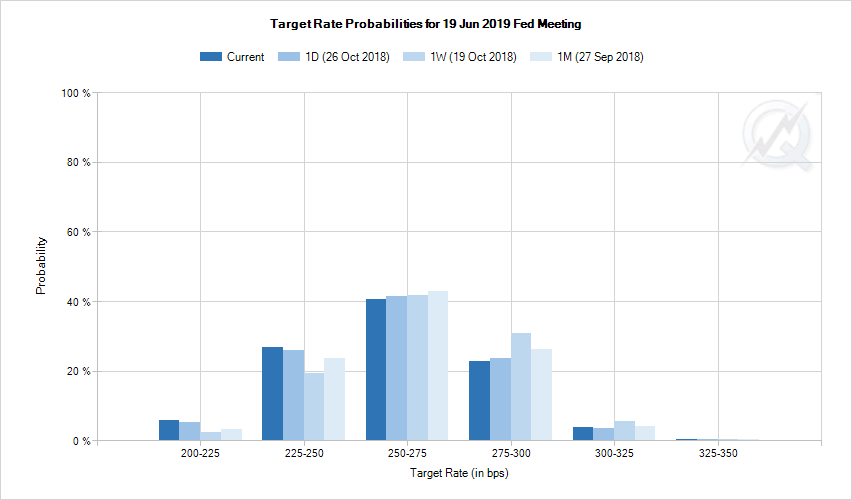
Comments by Fed officials were generally hawkish and affirmative to continuing rate hikes till neutral. Even Trump's new addition, Fed Vice Chair Richard Clarida supports gradual monetary policy accomodation removal. However, investors are starting to think otherwise. December rate hike is still a done deal for now but the picture changed beyond that. For March, fed funds futures are now only pricing in around 44% chance of another hike to 2.50-2.75%. That's sharply lower than 56% a week ago and was even lower than 49% a month ago. For June, the chance of yet another hike to 2.75-3.00% stands at 26.5%, comparing to 36.3% a week ago and 30.1% a month ago. The change in Fed expectations might limit Dollar's rally attempt ahead, or even push for a reversal.
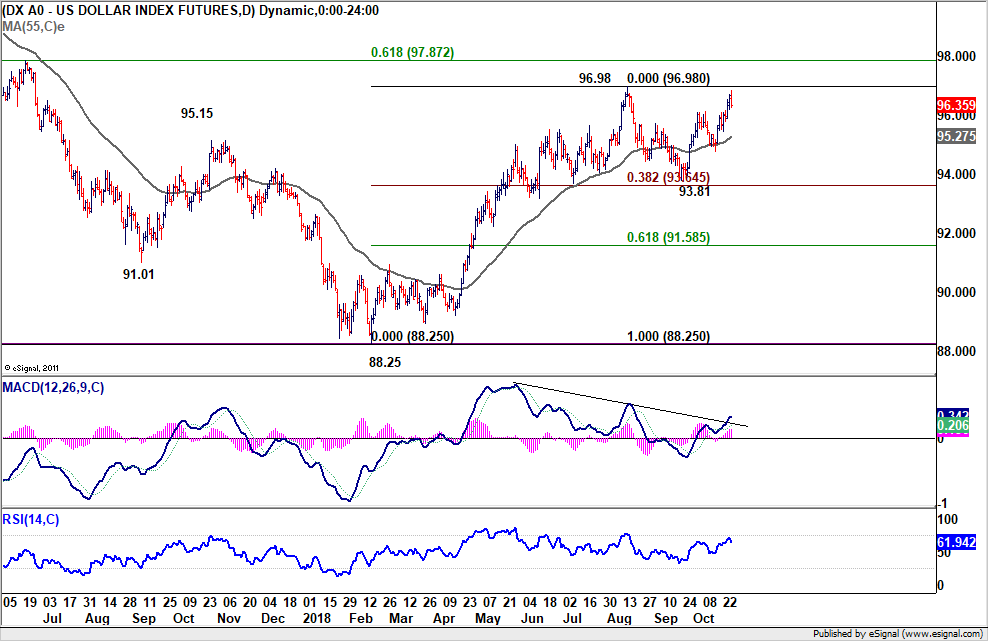
Technically, Dollar index rose to as high as 96.86 last week. It's now a perfect time for the index to reverse for the near term, given that it's close to 96.98 high. A break of last week's low at 95.46 will suggest rejection by 96.98 key resitsance. And consolidation from 96.98 would then extend with another falling leg towards 38.2% retracement of 88.25 to 96.98 at 93.64. Nonetheless, decisive break of 96.98 would confirm resumption of medium term up trend from 88.25.
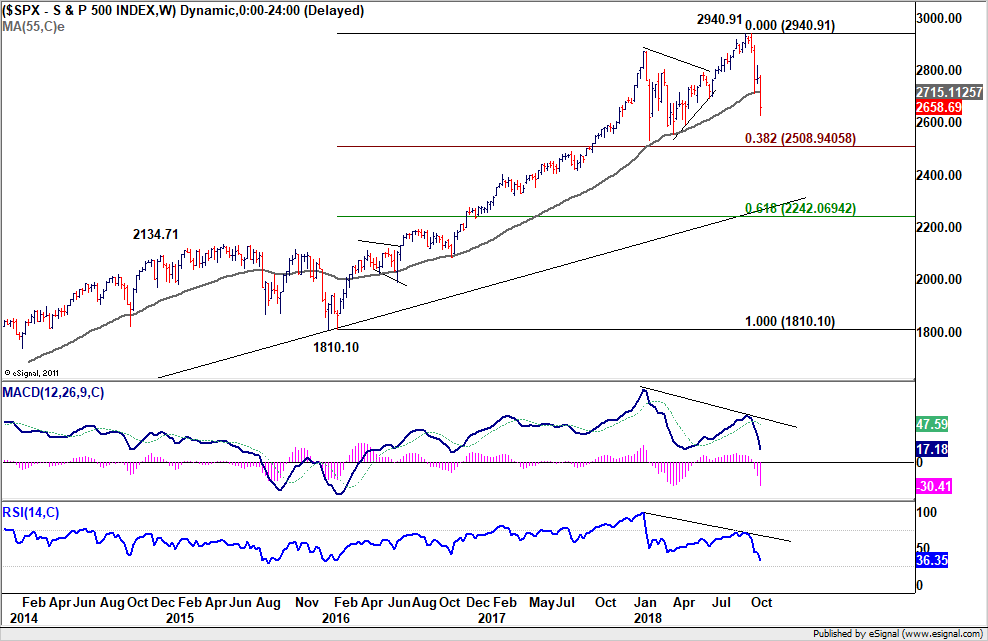
S&P 500's correction from 2940.91 resumed last week and took 55 week EMA decisively. Overall view is unchanged. As a less bearish case, SPX is just correcting the up trend from 1810.10 to 2940.91. Deeper fall would be seen to 38.2% retracement at 2508.94 before completing the correction. If that's what is going to happen, it will be consistent with another fall in the Dollar index in the near term. And, as sentiments stablized after the correction, as SPX rebounds from 2508.94, Dollar index could have the condition to break through 96.86 key resistance firmly. But of course, we can't tell for sure how things are going to play out unless we have a crystal ball.
Deteriorating economic outlook weigh on Euro and DAX
The European Commission formally rejected Italy's budget last week. The response from Italian government was clear... it's not going to change anything in the budget. Though, Economy Minister Giovanni Tria was also clear that current German-Italian spread is not sustainable. And in his own words, that's "not so much for the consequences it would have on debt interest payments", but "for the impact it would have on the weakest parts of the banking system". It's estimated that some small banks will need recapitalization if spread surges to 400 level. And in that case, government intervention might cause even more problems.
In addition to Italy, slowdown in Eurozone is also a factor that's weighing down the Euro. Eurozone PMI composite dropped notably to 52.7 in October, hitting a 25-month low. MarkitChief Business Economist Chris Williamson noted in the release that "although the survey's price gauges remain elevated and close to seven-year highs, the headline PMI has fallen to a level that would historically be consistent with a bias towards loosening monetary policy in order to prevent any further deterioration of economic growth." ECB President Mario Draghi sounded confident in his post meeting press conference last week. But the tone may change if the outlook continue to worsen ahead.
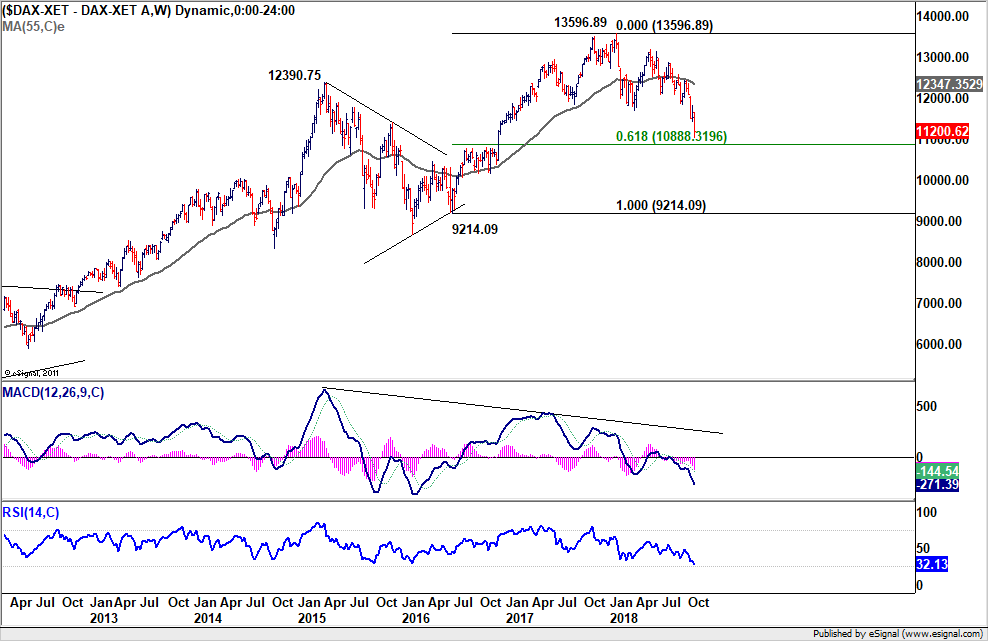
DAX was the worst performing major European index last week, partly because German PMI composite dropped to 41-month low at 52.7 in October. 61.8% retracement of 9214.09 to 13596.89 at 10888.31 is the next line of defense. For now, we're still adopting the less bearish view that fall from 13596.89 is only correcting the up trend from 9214.09. However, further downside acceleration through 10888.31 will start to shift to the case that it's correcting an even larger up trend, given that bearish divergence condition also appears in weekly MACD too. In that case, break of 92.14.09 support will become a real possibility. And that could serves as a signal of more troubles in other markets of the world.
NIESR releasd interesting interest rate forecast, BoE Inflation Report awaited
The UK National Institute of Economic and Social Research (NIESR) released rather interesting forecast last week. Under the main scenario of "soft Brexit, GDP growth will jump to 1.9% in 2019 before slowing down to 1.6% in 2020. Inflation will slow to 1.9% in 2019 and then rise back to 2.1% in 2020. Unemployment rate will drop to 4.0% in 2019 and then rise back to 4.5% in 2020. Meanwihle, BoE Bank Rate is projected at 1.3% by the end of 2019, and 1.8% by the end of 2020.
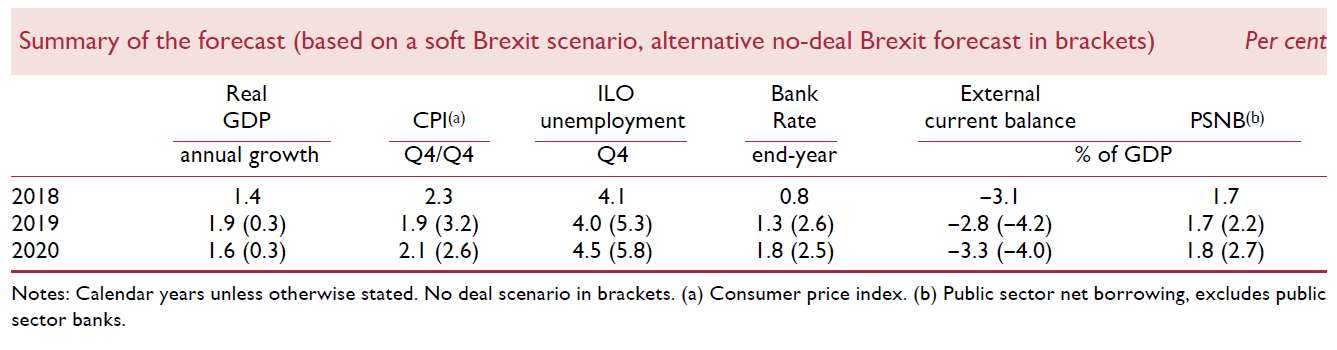
Under a no-deal Brexit scenario, GDP growth will slow sharply to 0.3% in 2019 and stay there in 2020. CPI will surge to 3.2% in 2019 then slow back to 2.6% in 2020. Unemployment rate will skyrocket to 5.3% in 2019 and worsen further to 5.8% in 2020. And in that case, due to much higher inflation, BoE Bank Rate will jump to 2.6% by the end of 2019 and drop back to 2.5% by the end of 2020. That is, considering Bank Rate at 0.75%, there would be seven 25bps rate hike next year!
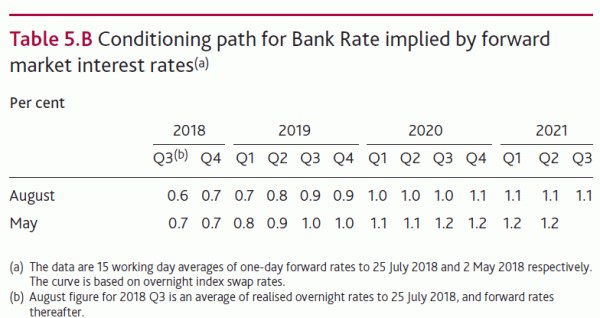
At the same time, let's have a look at BoE's conditioning path for the Bank Rate it adopted in the August Inflation Report. the Bank Rate would hit 0.9% by the end of 2019 and then 1.1% by the end of 2020. That is, one rate hike or less in 2019 and possibly one or even no hike in 2020. Under both scenarios, NIESR's Bank Rate projections were much more agressive than BoE' conditioning path.
BoE will meet this week and no one is expecting any change in the monetary policy. Though, the new quarterly Inflation Report will catch a lot of attention.
Position trading
On Friday, it looked like our AUD/USD short (sold at 0.7100, last updated here) was finally running well when the pair broke 0.7040 low. But we were then quickly stopped out at breakeven as the pair rebounded strongly before weekly close. We were correct three weeks ago in anticipating selloff in global stock markets, in particular Asia. China's SSE did break 2638 key support and reached as low as 2449. Naturally, as a risk sensitive currency, we should have seen Aussie tumbled further.
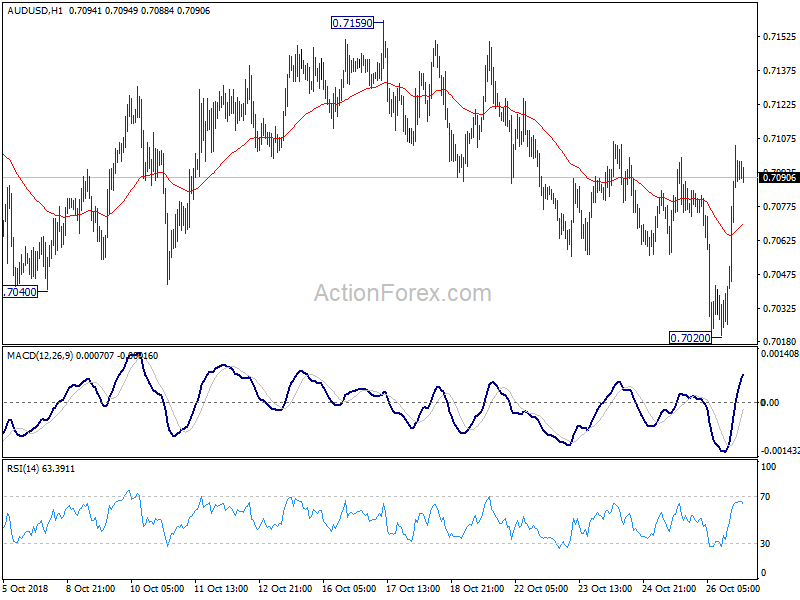
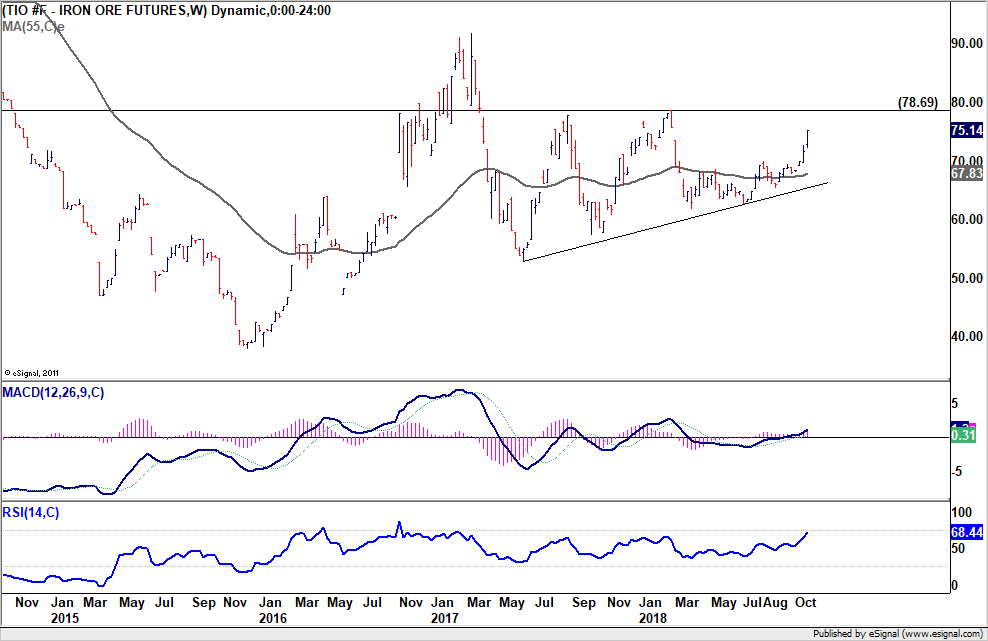
But two things went against our trade. Firstly, the strong rally in iron ore price has been providing strong support to Aussie throughout. Secondly, the tide somewhat turned after Trump's repeated attack on Fed after stock market crash. As noted above too, investors are starting to pare back bets on Fed's rate path in 2019. There is still no timing for RBA's next rate move yet. But monetary policy divergence between Fed and RBA might not happen as quickly as it was anticipated a month ago. Hence, while AUD/USD did extend recent down trend, downside momentum continued to diminish.
As for new strategy, it's actually a good them to sell Dollar for reversal, as the Dollar index is close to 96.98 key resistance. However, there are a load of important economic data to be released this week, PCE, ISMs and NFP, that could revive Dollar strength. Hence, we'll keep our hands off for a week first. In particular, we would want to see how the markets react to positive data that would support further Fed rate hikes.
GBP/JPY Weekly Outlook
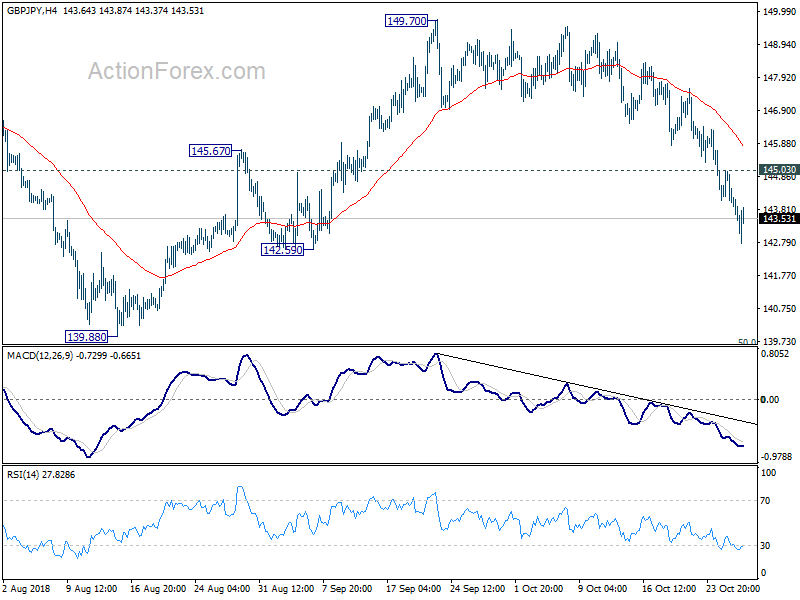
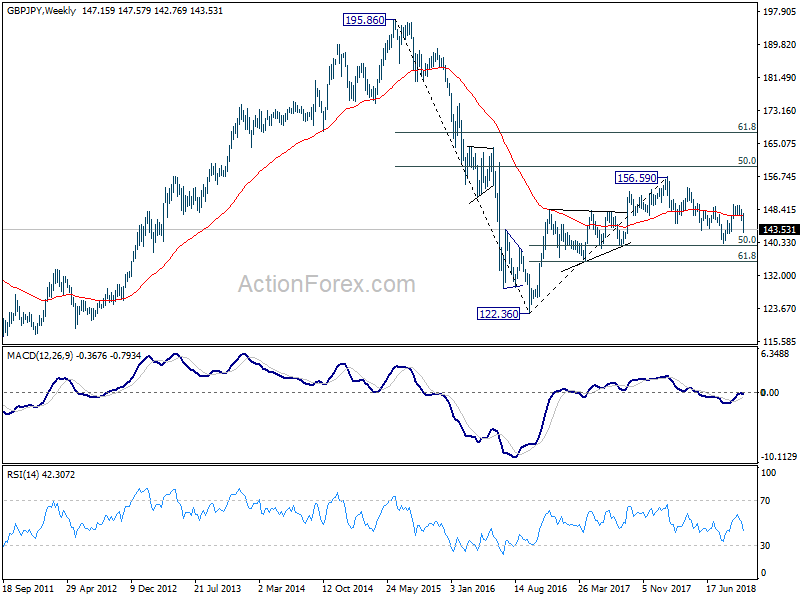
GBP/JPY dropped sharply to as low as 142.76 last week. The development confirmed completion of the rise from 139.88 at 149.77. Initial bias remains on the downside this week for 142.59 support. Break there will bring retest of 139.88 low. On the upside, above 145.03 will turn intraday bias neutral and bring consolidation first, before staging another decline.
In the bigger picture, as long as 139.29 cluster support (50% retracement of 122.36 to 156.59 at 139.47) holds, up trend from 122.36 (2016 low) would still extend beyond 156.69 high. However, decisive break of 139.29/47 will suggest that such up trend is completed and turn outlook bearish. In that case, next target is 61.8% retracement at 135.43.
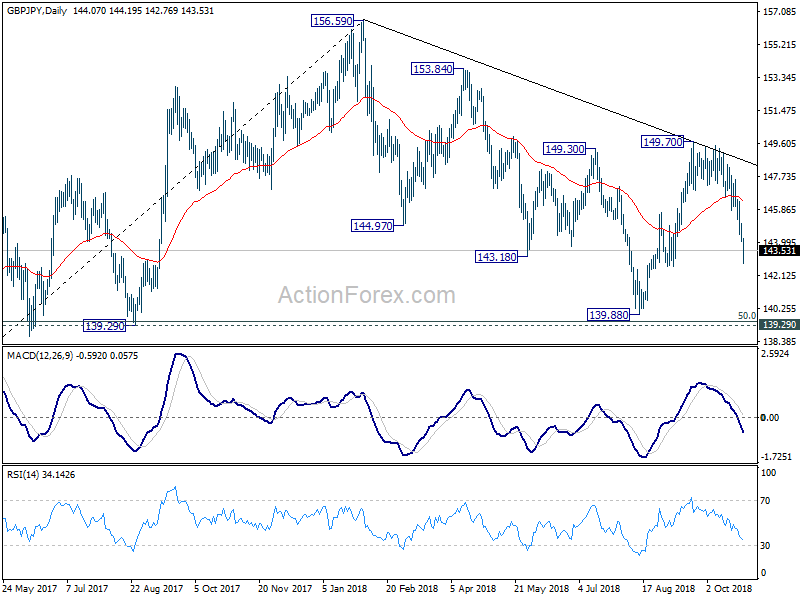
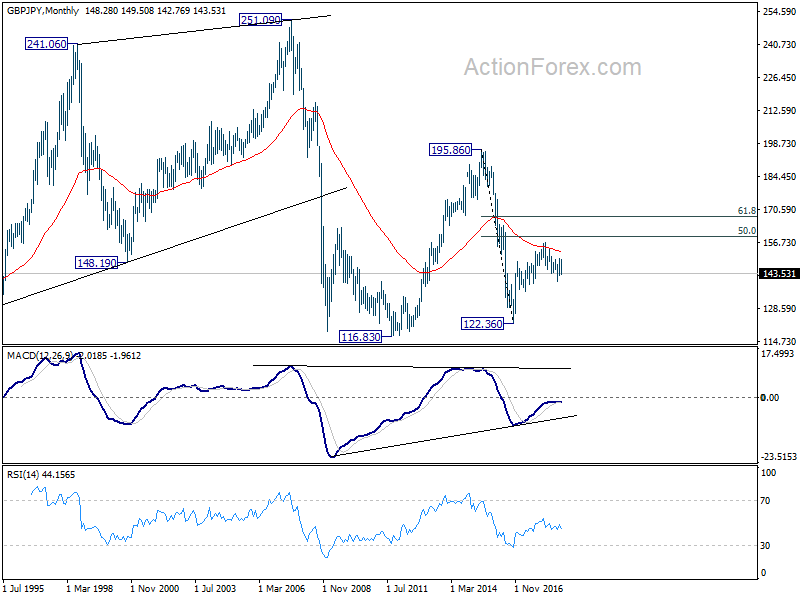
In the longer term picture, as long as 139.29 holds, rise from 122.36 is in favor to extend to 50% retracement of 195.86 (2015 high) to 122.36 (2016 low) at 159.11, and possibly further to 61.8% retracement at 167.78 before completion. However, firm break of 139.29 will turn focus back to 116.83/122.36 support zone instead (116.83 as 2011 low).
Summary 10/29 – 11/2
Monday, Oct 29, 2018
[php_everywhere instance="1"]
Tuesday, Oct 30, 2018
[php_everywhere instance="2"]
Wednesday, Oct 31 2018
[php_everywhere instance="3"]
Thursday, Nov 1, 2018
[php_everywhere instance="4"]
Friday, Nov 2, 2018
[php_everywhere instance="5"]
Weekly Economic and Financial Commentary: GDP Growth Remains Solid in Q3
U.S. Review
GDP Growth Remains Solid in Q3
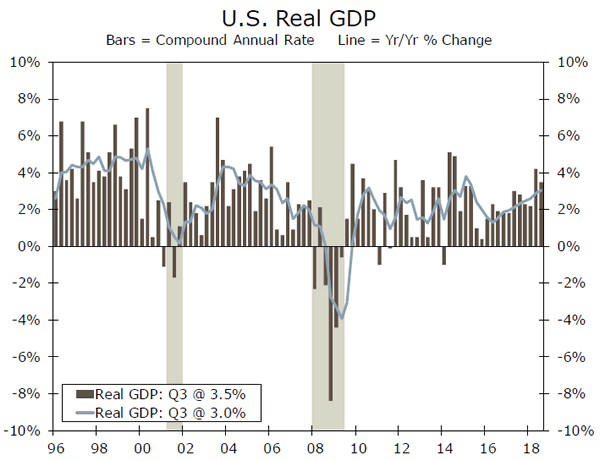
- Real GDP topped expectations and grew 3.5% in Q3. Consumer and government spending remained strong, and inventories also provided a substantial boost. Fixed investment and net exports were a drag.
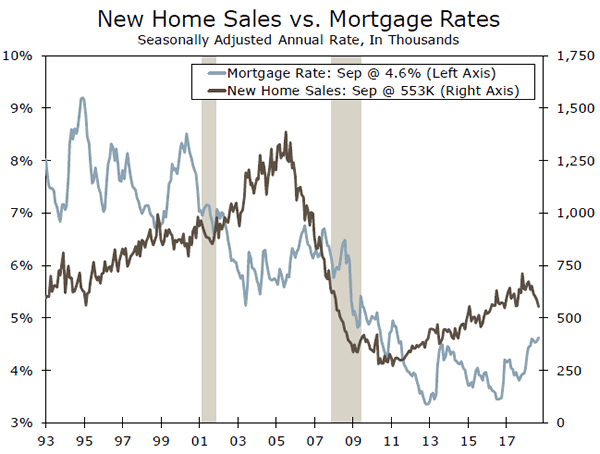
- The weakness in housing continued in September, as new home sales declined 5.5% to a 553,000-unit pace. The Pending Home Sales Index rose 0.5%, indicating that existing homes sales may see some improvement in coming months.
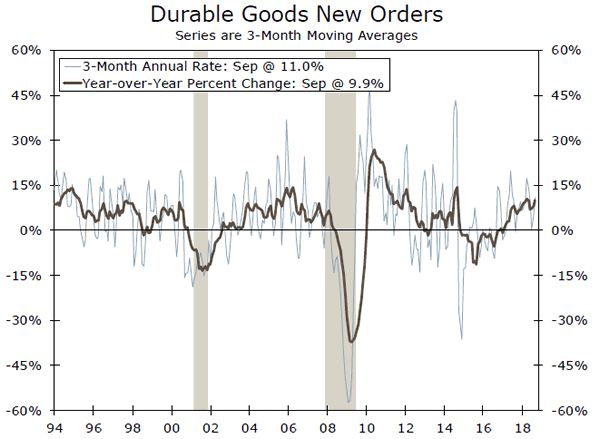
- Durable goods orders grew 0.8% in September. Core capital goods orders fell 0.1%, the second consecutive monthly decline, which suggests business investment spending may be slowing.
GDP Growth Remains Solid in Q3
The third quarter print of GDP data dominated an otherwise slow week of economic data. Real GDP topped consensus expectations and grew a solid 3.5% in Q3. The outturn represents a modest downshift from the 4.2% registered in Q2; however, the U.S. economy continues to grow at a strong rate that is likely above the long-run potential rate. We look for some further slowing in the quarters ahead. However, the recent solid pace of expansion will likely lead the Federal Reserve to continue raising rates at a gradual pace given the still-strong labor market and inflation steadily trending higher.
Consumer and government spending remained strong in Q3, while fixed investment and net exports were a drag. Real personal consumption expenditures rose 4.0%, driven in part by the boost to disposable income that was delivered by reductions in personal income tax rates earlier this year. The effects of fiscal stimulus showed up in a 3.3% jump in government spending, the strongest sequential rate of growth in more than two years. An added boost was provided by a rebuild of inventories amounting to $76 billion, which added 2.1 percentage points to the overall GDP growth rate.
Not everything in the report was positive. Fixed investment spending declined 0.3% on a dip in both nonresidential structures and residential fixed investment, which fell 7.9% and 4.0%, respectively. Deteriorating affordability and higher building costs may by exerting some drag on the housing market. Business spending was stronger elsewhere, as real spending on intellectual property grew 7.9% and spending on equipment edged up 0.4%. Net exports were also another area of weakness in Q3, shaving off 1.8% from the topline GDP growth rate, a reversal from the tariffinspired jump in exports in Q2.
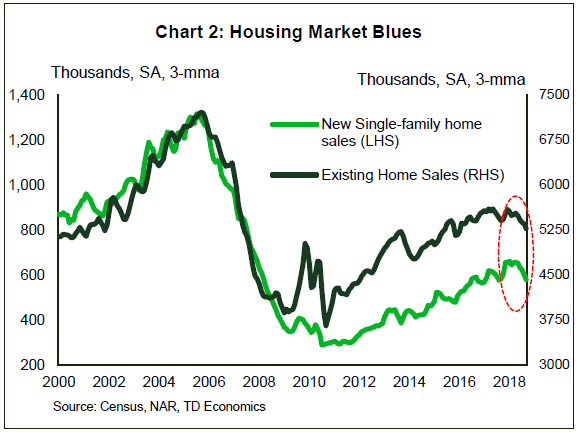
The weakness in the housing sector continued in September as new home sales declined 5.5% to a 553,000-unit pace. New home sales have fallen for five out of the past six months. The West registered a 12% drop, while the South posted a smaller 1.5% decline. Inventories rose for the sixth consecutive months to a 7.1 months' supply, the highest since 2011. New home prices also dropped as the median price fell 3.5% year-over-year.
New home sales are up 3.4% on a year-to-date basis and are faring slightly better than existing homes sales, which are trending lower relative to their year-ago pace. However, a 0.5% rebound in September's Pending Home Sales Index indicates that existing homes sales may improve in coming months. Pending home sales are based on signed contracts and lead existing home sales by roughly two months.
Meanwhile, there were signs that business spending may be slowing, although the trend has been firmly positive. Durable goods orders came in stronger than expected and rose 0.8% in September. Much of the gain occurred from a nearly 120% surge in defense orders. Aside from defense, orders were more modest. Transportation orders rose just 1.9%, while civilian aircraft orders dropped 17.5%. Orders for non-defense capital goods excluding aircraft fell 0.1%, the second consecutive monthly decline. Shipments of core capital goods orders have also stalled recently and have been flat in each of the past two months.

U.S. Outlook
Personal Income & Spending • Monday
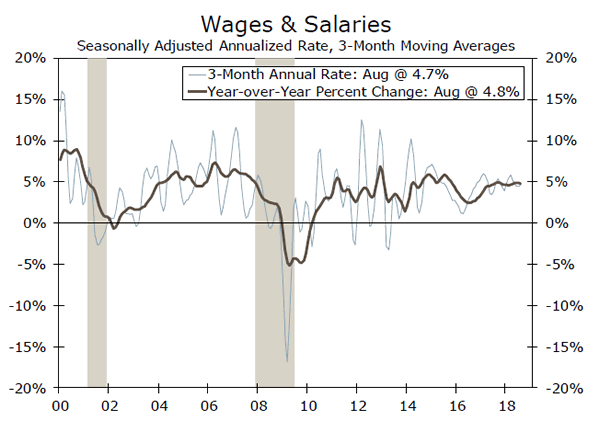
With this morning's Q3 GDP release, we learned that personal consumption expenditures rose 4.0% over the quarter. Continued strength in consumption partly reflects the boost to disposable incomes from tax cuts earlier this year. On Monday, we will receive September personal income and spending data. The strength exhibited in Q3 consumption, however, all but guarantees roughly a 0.3% nominal rise in personal spending for September.
The wages and salaries component of income posted its largest monthly increase since January in August, and while Hurricane Florence weighed on employment growth in September, the undeniably tight labor market appears to finally be translating to improvement in wages. Even with wage gains, however, energy prices remain elevated, which may have held back overall spending for September.
Previous: 0.3% & 0.3% Wells Fargo: 0.4% & 0.3% Consensus: 0.4% & 0.4%
ISM Manufacturing • Thursday
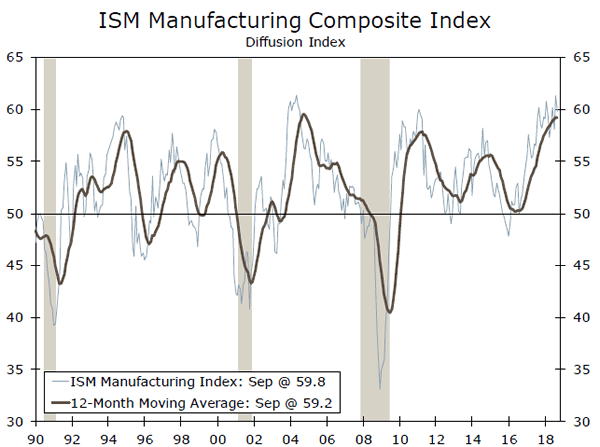
Following a 14-year high in August, manufacturing activity moderated in September. The September ISM slowed to 59.8, a stillelevated reading of activity. The slip was mostly due to moderation in the supplier deliveries, inventories and new orders components. This suggests that while supply chains are still tight, they are not as constrained as they were earlier this year. Similarly, the modest drop in the new orders index to 61.8 remains consistent with growth in factory orders, albeit at a more moderate pace. Despite shortages in labor and materials, the production and employment components of the index continued to rise last month. However, anecdotal evidence from respondents' comments highlighted rising input costs and supply constraints attributable to tariffs and labor shortages starting to weigh on activity. We expect the ISM to further moderate to 59.1 in October, as manufacturers continue to face production constraints.
Previous: 59.8 Wells Fargo: 59.1 Consensus: 59.0
Employment • Friday
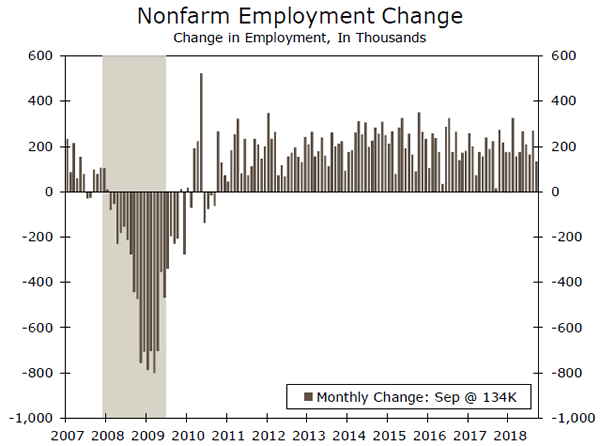
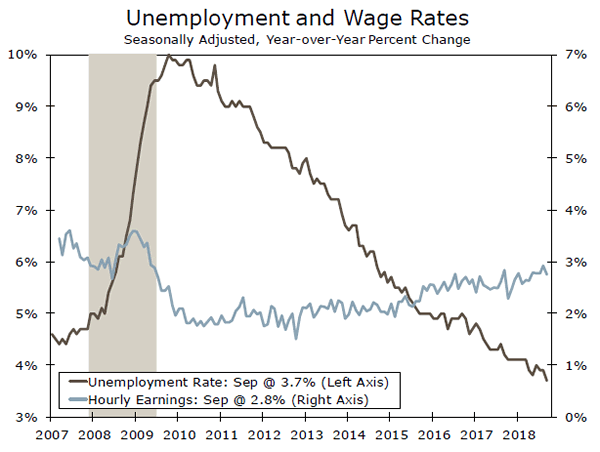
We expect employers to add roughly 200,000 payrolls in October, keeping the unemployment rate steady at 3.7%. This would follow a more modest increase of only 134,000 new jobs in September. Hurricane Florence was largely to blame for the depressed job growth last month, however, as about 300,000 workers said they were unable to work due to bad weather. This is compared to an average of 85,000 workers in a typical September. Other indicators suggest no signs of a cooling labor market. Demand for workers remains exceptionally strong, but that comes with increasing labor shortages. Last week, we learned that job openings continued to climb, breaching 7 million in August. The share of firms with a job opening that is hard to fill remains at a record high, while initial jobless claims remain among at the lowest levels since the late 1960s. Shortages of labor are likely pushing firms to raise wages.
Previous: 134,000 Wells Fargo: 200,000 Consensus: 187,000
Global Review
Monetary Policy Convergence Remains Slow and Steady
- Central bank decisions this week reinforce the still-gradual pace of monetary policy convergence, amid signs of muted growth prospects and ongoing trade and political uncertainty.
- The Bank of Canada raised rates 25 bps, and upwardly revised its business investment and export forecasts after the recent trade agreement removed much of the uncertainty surrounding North American trade policy.
- The European Central Bank remained on hold, reiterating its plans to end asset purchases by the end of the year but maintain current rates through summer 2019. Central banks in Sweden, Norway, Turkey and Russia also left policy unchanged.
Monetary Policy Convergence Remains Slow and Steady
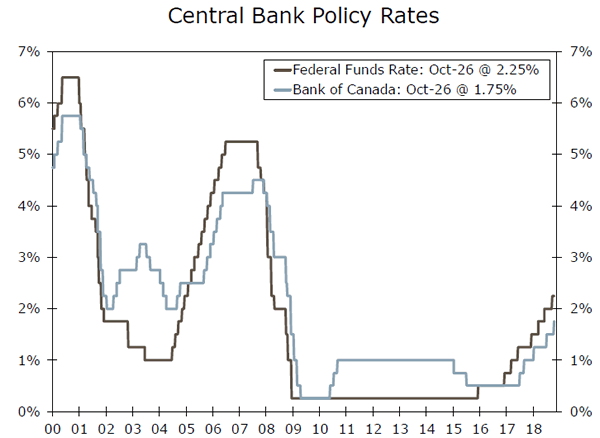
Several central bank decisions this week highlight the still-gradual pace of global monetary policy convergence. Arguably the furthest along its tightening path relative to the U.S. is the Bank of Canada (BoC), which delivered a widely-expected 25 bps rate hike this week (see chart on page 1). The new U.S.-Mexico-Canada Agreement reached earlier this month largely removed uncertainty surrounding North American trade policy, leading the BoC to upwardly revise its business investment and export forecasts. However, U.S.-China trade tensions remain a concern, and the BoC continued to highlight these tensions as a risk to its outlook.
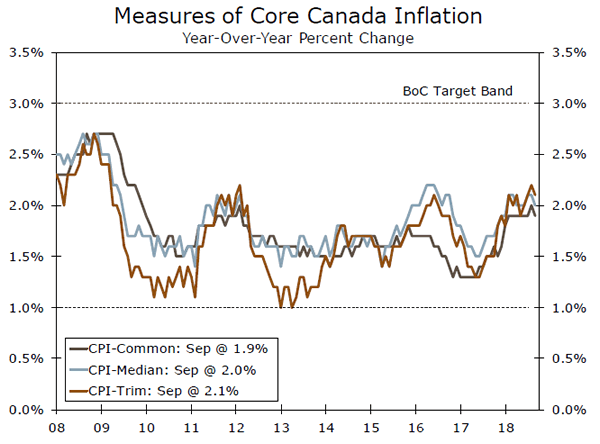
That said, in the near term several indicators signal that the Canadian economy is firing on all cylinders. The labor market remains tight, and although wage growth has slow slightly, it still remains solid and should position most consumers to withstand tighter financial conditions. In terms of inflation, a weaker CPI print of 2.2% year-over-year in September does not seem to be a major cause for concern for the BoC, as it was largely due to seasonal factors (top chart). Although the BoC dropped language from its statement regarding the gradual pace of policy tightening, we still see the BoC tightening policy in an orderly fashion, and look for three rate hikes in 2019.
While the BoC continues to tighten, several central banks in Europe remained on hold this week amid signs of muted growth prospects, ongoing trade tensions and political uncertainty. The European Central Bank (ECB) left policy unchanged, and while it continued to state it will wrap up its bond-buying program at the end of this year, it also reinforced plans to hold rates at their historic lows through at least summer 2019. In the press conference following the decision, ECB President Draghi noted that incoming data came in slightly weaker than expected since the last meeting, although he still characterized risks to the outlook as broadly balanced.
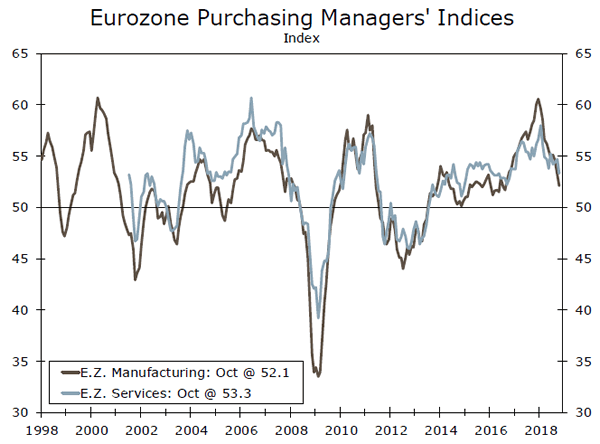
Consistent with Draghi's rhetoric around weaker data, preliminary estimates for the Eurozone October Markit PMIs released this week missed consensus expectations, with the manufacturing PMI dropping to 52.1, its lowest reading since 2016 (middle chart). In our view, subdued growth across the Eurozone combined with only gradually rising inflation gives the ECB little cause to speed up policy normalization. We take the ECB at its word that it could begin to hike rates after summer 2019, although slower export growth amid trade tensions, concerns of a "hard" Brexit and the Italian budget debate remain risks worth monitoring.
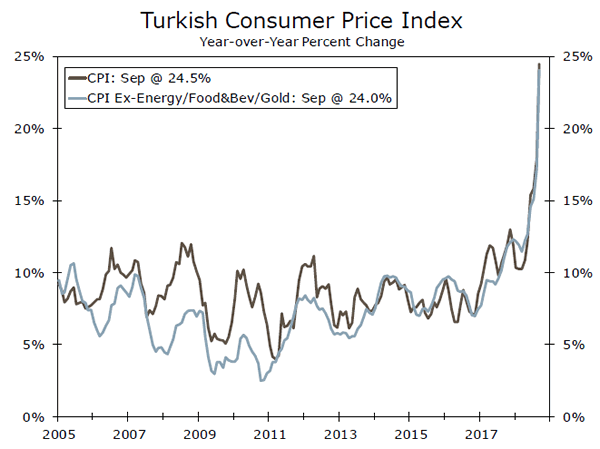
Elsewhere in Europe, Sweden's Riksbank left rates unchanged, although inflation is at target and the central bank looks for GDP growth of 2.3% in 2018, up from 2.1% last year. Policymakers reiterated their guidance on policy normalization from the last meeting, stating the first rate hike could come in December or February. Norway, Turkey and Russia's central banks also remained on hold. However, in Turkey, still-rampant inflation that surpassed 24% in September signals that further rate hikes may be in store (bottom chart). Policymakers in Russia also highlighted upside risks to inflation and the potential for further hikes.
Global Outlook
Eurozone GDP • Tuesday
Real GDP in the Eurozone rose 0.4% in Q2, continuing the more sluggish pace of growth seen so far this year after an upside breakout in 2017. While fixed investment spending rebounded 1.2% in Q2 after rising at a more tepid pace in Q1, growth in the consumer sector slowed, and exports only rebounded slightly after declining in Q1.
The picture does not look to have changed materially in Q3, as several higher frequency indicators continue to point to a more moderate pace of growth. Preliminary October PMI readings came in below consensus estimates, while retail sales declined in July and August. That said, we look for the Eurozone economy to continue to expand at a moderate pace in coming quarters, as the labor market remains solid and financial conditions continue to be accommodative. Also due next week are preliminary October inflation data and October confidence indices.
Previous: 0.4% Wells Fargo: 0.4% Consensus: 0.3%

Bank of Japan Decision • Wednesday
The Bank of Japan (BoJ) has maintained highly accommodative policy for several quarters amid low inflation and more moderate GDP growth. While the economy contracted slightly in Q1, a solid Q2 rebound was led by a pickup in business investment, which should be supportive of longer-term growth prospects. The labor market has also tightened in recent months, and gradually rising wages should be supportive of further growth in consumer spending.
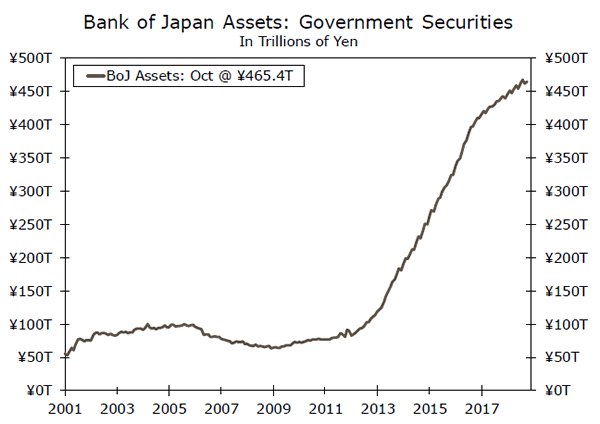
But inflation is likely more of a near-term concern for the central bank, as core CPI inflation remains stuck around 1%, well below the BoJ's 2% target. As such, interest rates have remained in negative territory and the BoJ has maintained its extensive bond-buying program, with total assets on its balance sheet amounting to nearly 100% of GDP at present. We look for the BoJ to keep policy highly accommodative for the foreseeable future, until inflation begins to show signs of a sustained upward trend.
Previous: -0.10% Wells Fargo: -0.10%
Bank of England Decision • Thursday
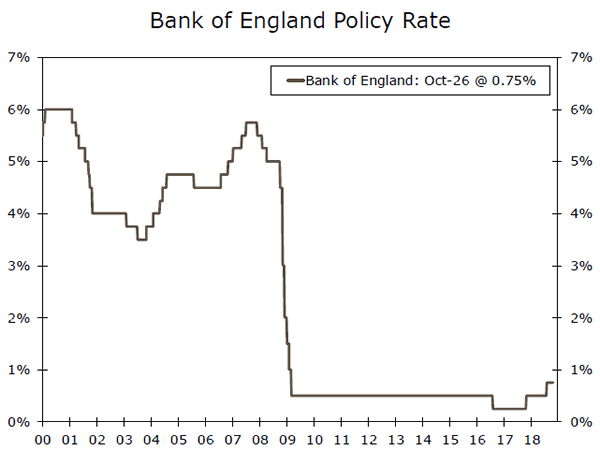
After raising rates 25 bps at its August meeting, we look for the Bank of England (BoE) to remain on hold at its meeting next week. The BoE is likely in the midst of a balancing act, managing still abovetarget inflation along with continued Brexit uncertainty.
In terms of the former, consumer price inflation still remains above the BoE's 2% target, but has come down significantly from its high of nearly 3% earlier this year, up 2.4% in September year-over-year. As price pressures have receded, real wage growth is showing signs of gradually picking up, which should be supportive of future growth prospects, especially after household spending growth slowed in Q2. However, with Brexit negotiations still underway and uncertainty surrounding the feasibility of reaching a deal by the March 2019 deadline, we believe the BoE will continue to adopt a wait-and-see approach before hiking rates.
Previous: 0.75% Wells Fargo: 0.75% Consensus: 0.75%
Point of View
Interest Rate Watch
Cross Currents
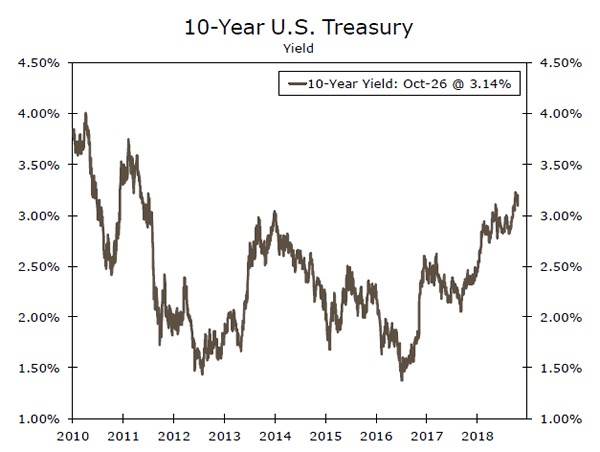
The bond market continues to take its cue from the stock market, with yields pulling back on days stocks sell off and rising on days stocks rebound. The earnings data have been mixed, with several large industrial firms reporting strong numbers but warning that tariffs are weighing on margins and also noting that global growth appears to be slowing. The yield on the 10-year Treasury security peaked earlier in the month at 3.23%, under a barrage of solid economic reports and hawkish statements by Fed officials.
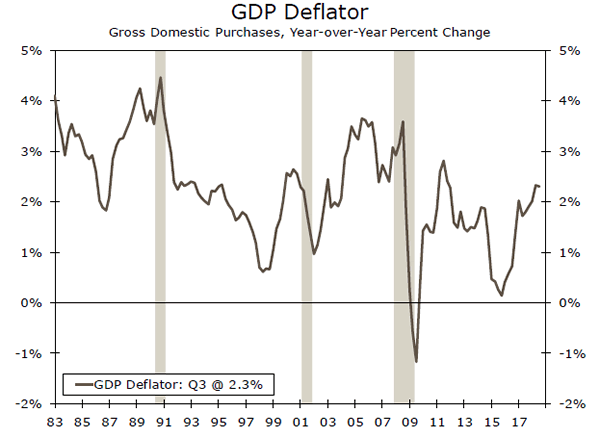
This morning's GDP data provide some new reference points. Real GDP grew at a 3.5% pace in Q3 and has averaged a 3.3% pace so far this year. With growth strengthening, inflation has firmed up, with the GDP deflator rising at a 1.7% pace in Q3 and rising 2.3% over the past year. The core personal consumption deflator rose at a 2.1% pace in Q3. While inflation has firmed, there is little in the data to suggest that it is likely to become problematic over the next few quarters. We look for growth to moderate in Q4, as interest-rate sensitive areas such as home sales, motor vehicle sales and business fixed investment weaken.
The Fed has become slightly more nuanced in its public comments given the volatility in the financial markets. While its earlier bullishness was genuine and likely aimed at firming up bond market expectations for rising interest rates, the Fed may have gotten more than it bargained for. The weakness in the housing market, which saw new home sales tumble 5.5% in September, is now really beginning to bite. Residential investment will likely subtract from economic growth every quarter this year.
The coming week will provide our first look into the fourth quarter. Manufacturing appears to be slowing and that may soon become apparent in the ISM survey. Friday's jobs data should also show average hourly earnings up more than 3% year-overyear. Since wage growth has been so elusive throughout this expansion, firming average hourly earnings may further stoke fears that wages and inflation are set to rise now that the economy has blasted past traditional measures of full employment.
Credit Market Insights
CRE Lending Continues to Grow
According to the Mortgage Bankers Association, total commercial and multifamily mortgage originations grew 2% year-over-year in the first half of 2018. Fannie and Freddie collectively saw a 14% rise, while life insurance company originations grew 7%. Meanwhile, CMBS and commercial portfolio originations declined. While these traditional lenders hold roughly 88% of outstanding mortgage debt, non-traditional lenders are increasingly playing a large role. Loans from REITs, debt funds, and specialty finance companies increased 12% during that same time period. Delinquency rates across every class of lender remain exceptionally low. Solid economic growth is boosting occupancy and keeping upward pressure on rents, which is making conditions favorable for further lending. The value of total outstanding mortgage debt picked up in the first half of the year to a pace not seen since 2007, rising to just north of $1.3 trillion.
The rise in lending can be attributed to strong investor demand for hotels and multifamily properties, the value of which grew 22% and 17%, respectively. Occupancy at hotels is at near record highs, driven by strong consumer spending and elevated corporate profits. Demand for apartments has also been reignited as home prices and mortgage rates continue to climb. Lending also rose slightly for retail properties, increasing 1%, a sign that the sector may be rightsizing. Office, industrial and health care loans were all lower in the second half of 2018 compared to the year prior.
Topic of the Week
The Midterms and Our Economic Outlook
The 2016 United States election was a landmark event, and its impact has rippled through nearly all asset classes and the domestic and global economies. On November 6, 2018, Americans will go back to the polls for the midterm elections. Might this round of elections have similarly significant financial market and economic consequences?
In short, we are skeptical the 2018 midterms will match the 2016 election in terms of sweeping macroeconomic implications. The 2016 election was a watershed election, and it resulted in the first "unified government" (i.e., one party controlling the White House and both chambers of Congress) since 2009-2010 and the first Republican unified government since 2005-2006. Generally speaking, the move from divided government to unified government opens up more possible policy outcomes as one party unites to pass landmark legislation. As we look to the other side of the 2018 election, the two possible outcomes are a move from unified government to divided government or a continuation of the status quo. Regardless of which occurs, we believe these two outcomes are less likely to produce a clear inflection point in the nation's fiscal policy, as happened in 2016.
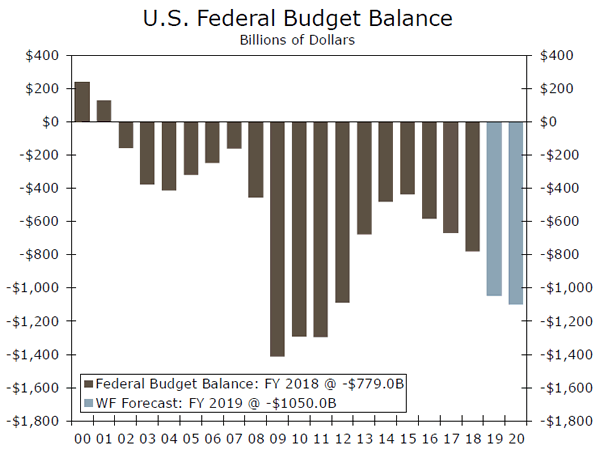
More specifically, the tax cuts enacted at the end of last year are unlikely to be repealed or significantly expanded, in our view. In addition, unless the economy begins to decelerate markedly, we are also skeptical the stars will align for another discretionary spending increase as large as the one that Congress passed in Q1-2018. Even without additional tax cuts/spending increases, we look for the FY 2019 federal budget deficit to widen to $1.05 trillion, from $779 billion in FY 2018. The United States-Mexico- Canada Agreement (USMCA) to replace the North American Free Trade Agreement (NAFTA) will likely see a vote in 2019, although a divided government could make this a bit more of a rocky process.

The Weekly Bottom Line: Economy is Hot, but Markets Worried About the Future
U.S. Highlights
- It was a sea of red in equity markets this week as risk off sentiment set in. As it stands, downturn in October has erased all the stock market gains from the start of the year.
- International developments didn't help to lift investors' spirits. The U.S. – China trade negotiations appear to have hit a stalemate, and the European Commission has rejected Italy's government budget.
- Domestically, the advance estimate of Q3 GDP was the only major data release this week. After an impressive Q2, the U.S. economy has downshifted slightly in Q3, but at 3.5% (annualized), growth has nonetheless remained very hot and well above potential, giving the Fed ammunition for another rate hike in December.
Canadian Highlights
- The Bank of Canada hiked its overnight interest rate by 25 bps to 1.75%, in a move that was unanimously expected and almost fully priced-in.
- In its relatively hawkish statement, most notable was the removal of its reference to "gradual" in its tightening approach, with the emphasis now on its path forward to a neutral rate, seen as sitting in the 2.50% to 3.50% range.
- The week saw few and unremarkable Canadian data releases, with an almost unchanged wholesale trade print, a modest decline in small business confidence, and a decent payrolls release.
U.S. - Economy is Hot, but Markets Worried About the Future
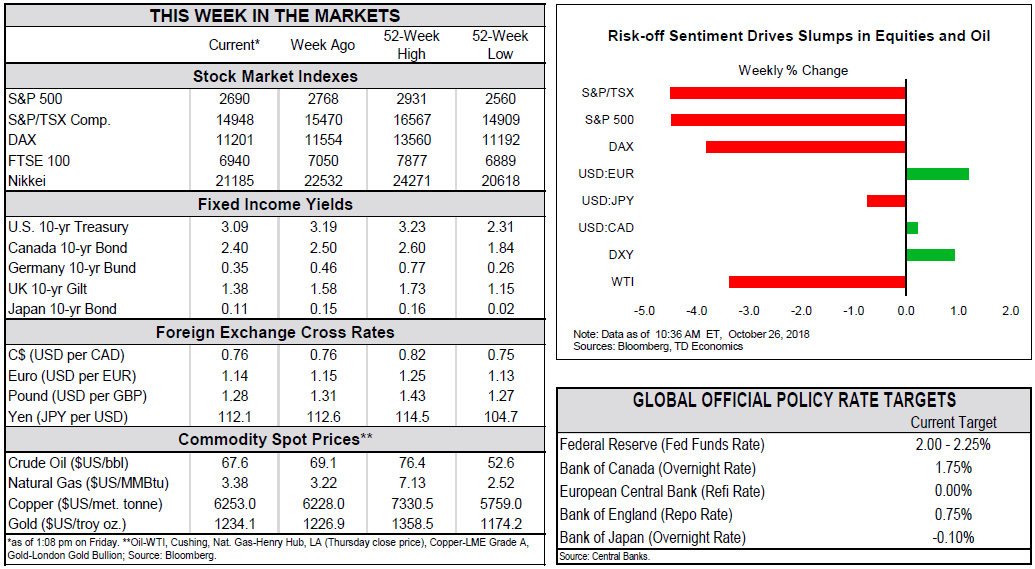
This was a tough week for financial markets. All major indexes fell precipitously, set to end the week deeply in the red. As it stands, markets' downturn in October has erased all the gains from the start of the year. While domestic economy remains on solid footing and Q3 corporate earnings have so far exceeded expectations, investors' conviction that corporate profits may have peaked is growing. Forward-looking investors are increasingly worried about slowing global growth, mounting trade tariffs, rising interest rates and a fading boost from fiscal stimulus.
International developments didn't help to lift investors' spirits. It seems that the U.S. – China trade negotiations have hit a stalemate. This threatens to undermine a scheduled meeting between the two presidents in November, and raises the probability of further tariffs. Also, in an unprecedented (even if widely expected) step, the European Commission has rejected Italy's budget.
Domestically, there was relatively little on the economic radar this week, with the advance estimate of Q3 GDP the only major data release. As anticipated, after an impressive 4.2% print in Q2, the U.S. economy has downshifted slightly in Q3, but at 3.5% (annualized), growth nonetheless remained very hot and well above potential (Chart 1). Looking under the hood, consumer and government spending were both exceptionally strong, advancing by 4% and 3.3% in the quarter. Coming on the heels of a similarly robust 3.8% gain in Q2, this marks strongest two-quarter pace for consumer spending in over three years courtesy of a tight labor market and income tax cuts. .
Even as consumers are hitting malls in masses, the housing market remains unloved due to deteriorating affordability and lack of supply. Sales of new and existing homes are down by 11% and 6%, respectively, since December (Chart 2). With both homebuilders and prospective buyers facing a number of hurdles, residential investment has been contracting for three consecutive quarters.
Business investment was another fly in an ointment in today's GDP report. After setting a blistering pace in the first half of the year, spending took a breather in the third quarter, up only 0.8%. While one quarter does not make a trend, given the tensions on trade front this is where the risks lie going forward. Tariffs have already dented business confidence and could lead to further delays in investment in the coming quarters. If investment spending continues to be soft, dampening economic growth, the Fed would likely temper the pace of rate hikes.
All in all, with trade risks percolating and the boost from fiscal stimulus expected to fade, performance over the last two quarters likely represents the high water mark for the U.S. economy. So far though, despite President Trump taking yet another jab at the Fed this week, it certainly looks like current economic fundamentals warrant another interest rate hike in December, bringing the upper end of the target range to 2.5%.

Canada - Speeding Up to Neutral
This week was thin on major Canadian data, with generally lackluster releases. Wholesale trade headline and volumes prints both edged down 0.1% on the month. Meanwhile, the payrolls report was positive but unremarkable, showing a modest gain of 0.1% in non-farm employment but unchanged weekly hours. Perhaps most informative was the CFIB small business confidence release, which, while edging lower, strongly reinforced the tightening labour market and capacity constraints narrative echoed in last week's Business Outlook Survey.
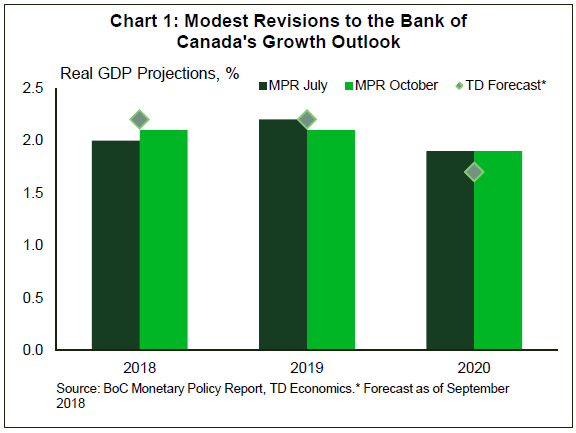
Stealing the show this week, however, was the Bank of Canada. On Wednesday, the central bank hiked its overnight interest rate by 25 bps to 1.75%, the highest level since late 2008. The statement delivered a relatively hawkish tone, suggesting a still-positive global backdrop, and an improved Canadian outlook on the back of the recently agreed-upon USMCA. The Canadian growth estimate was upgraded 10 bps for 2018, but downgraded an equal 10 bps in 2019 and left unchanged in 2020. While this may look surprising given the resolution of USMCA and the bank's upbeat tone, a slight downgrade to global growth and escalating U.S.-China trade uncertainty may have helped offset the USMCA upgrade. On the positive side, the Monetary Policy Report sees a shift from consumption to business investment and exports as drivers of GDP growth, a welcome assumption if realized given years of lagging investment.
Markets, however, were more attuned to the forward-looking aspects of the central bank's statement. Specifically the removal of "gradual" helped push the OIS-implied probability of a December rate hike more than 10 p.p. up to 26%, before slightly falling off today. This removal also raised the implied likelihood of further hikes in 2019. We still maintain the view that a December rate is unlikely and a January rate hike is most probable, projecting a total of three hikes in 2019 to reach the lower end of the Bank of Canada's 2.5%-3.5% neutral range. Supporting our view was a coinciding uptick in the market's pricing of a January rate hike after the Bank of Canada's decision. All told, the bank may be sending a message that slower headline inflation, as expected in its inflation outlook, will not be a major impediment to its path to neutral, especially in the face of positive data.
Of course, downside risks remain – with U.S.-China trade uncertainty being near the top, and tightening financial conditions in Canada likely weighing on consumption growth. Nevertheless, the USMCA agreement and the bank's citing of stabilizing household vulnerabilities suggest that downside risks have moderated.
Meanwhile, Canadian markets were not spared the global risk-off sentiment, which heightened this week. Oil markets were negatively impacted, with benchmark WTI oil prices lower on the week. The energy-heavy S&P/TSX composite appears set to end the week down about 3.5% (as of 11 AM). Ongoing risk-off sentiment also didn't help the Canadian dollar, which has continued to depreciate for its fourth straight week.

U.S.: Upcoming Key Economic Releases
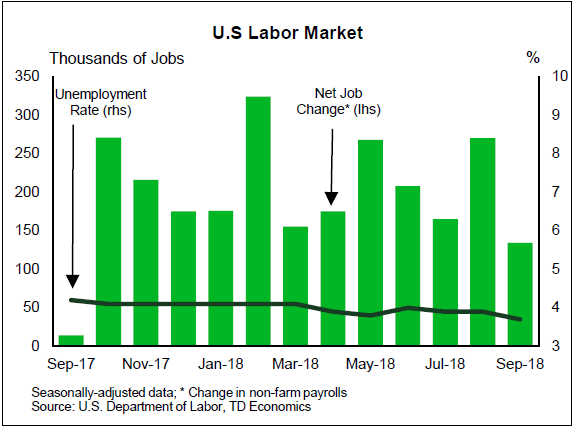
U.S. Employment - October
- Release: November 2, 2018
- Previous: 134k, unemployment rate: 3.7%
- TD Forecast: 160k, unemployment rate: 3.7%
- Consensus: 190k, unemployment rate: 3.7%
We expect nonfarm payrolls to come in on the weak side at 160k in September, this time dampened by Hurricane Michael. The latter should more than offset any rebound from Hurricane Florence, which contributed to the weaker September print, in our view. We expect wages to lend a more upbeat tone to the report and rise 0.3%, taking the y/y pace to 3.2%. However we see risk for downward revisions.
Canada: Upcoming Key Economic Releases
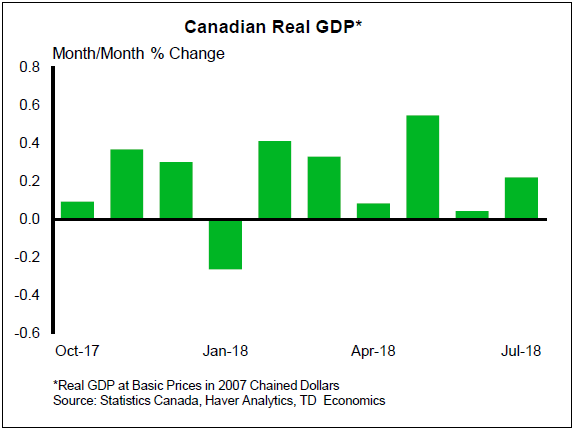
Canadian Real GDP - August
- Release Date: October 31, 2018
- Previous: 0.2%
- TD Forecast: 0.0%
- Consensus: N/A
TD looks for a flat print on industry-level GDP for August, in line with observed weakness in activity data. Services should lead growth on further gains in real estate, which may be short-lived amid a recent pullback in home sales, and professional services while the goods sector will underperform. Residential construction will exert a drag on growth following a deceleration in housing starts while a decline in real manufacturing sales will provide another headwind to GDP. However, a rebound in the energy industry will provide a modest offset after production outages constrained oil sands output in July. While unchanged GDP might give the impression that data momentum is shifting to a lower gear, we still look for Q3 growth to print near 2% after the strong hand off from June, slightly above projections from the October MPR.
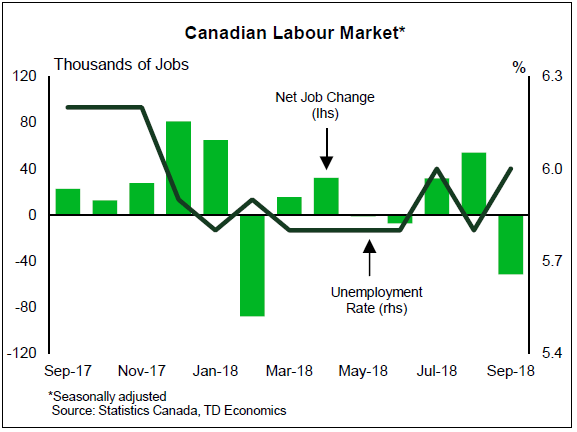
Canadian Employment - October
- Release: November 2, 2018
- Previous: 63k, unemployment rate: 5.9%
- TD Forecast: 5k, unemployment rate: 5.9%
- Consensus: N/A
The Canadian economy is projected to add 5k jobs in October on rebound in full-time hiring. LFS employment has oscillated in recent months but total job growth through August has sharply underperformed that reported by the Survey of Employment, Payrolls & Hours (SEPH) over 2018; while we do not expect that gap to close in one month, it does imply that we shouldn't expect a full unwind of the September gains. However, we do expect some giveback in part time employment after 80k jobs were created in September and look for the construction sector to give up some of the 28k added jobs.
Our forecast is consistent with the unemployment rate holding at 5.9%, although the risks are tilted towards a tick lower should last month's improvement in the participation rate correct. However, wage growth will be hard pressed to push higher given strong base effects. A 10% increase to Alberta's minimum wage will help support the m/m print but this follows a more significant hike in 2017.
Canadian International Trade - September
- Release Date: November 2, 2018
- Previous: $0.5bn
- TD Forecast: $0.2bn
- Consensus: N/A
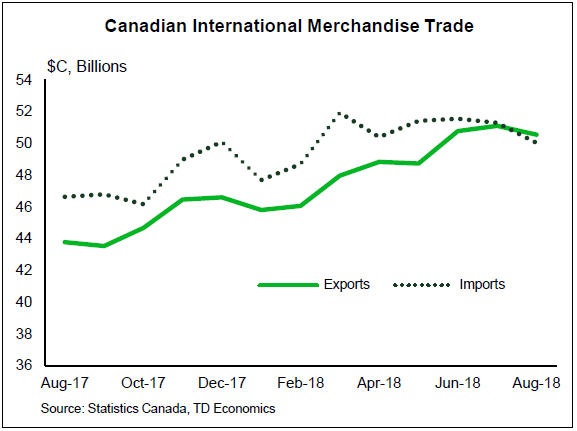
TD looks for the international trade surplus to narrow to $200m in September on a rebound in import activity while exports should see another modest decline, concentrated in energy products. Non-energy exports are likely to post a slight increase on a rebound in motor vehicles after auto exports fell by 6.2% last month. However, we do not expect a full recovery amid weaker production figures. Meanwhile imports should rebound on the heels of up upbeat advance trade data out of the US, which would represent the first increase since June.
Dollar Pays Heavy Price for Equity Sell Off
The US dollar was lower against most major pairs on Friday. The greenback dropped as investors flocked to safe havens away from the US currency. Trade war concerns and its impact on US companies have triggered a massive sell off in equities. The US dollar is on the back foot despite strong growth as evidenced by the release of the flash GDP for the third quarter that showed a 3.5 percent gain beating expectations.
The end of October and the start of November bring a packed weekly economic calendar. Central bank action and employment data will guide markets that are still sensible to geopolitics.
- Bank of Japan to avoid Halloween surprise
- Bank of England to keep monetary policy on hold until Brexit clarity
- US economy expected to have added 200,000 jobs in October
Euro to Underperform as Italian Budget Drama Continues
The EUR/USD lost 0.93 percent in the last five trading sessions. The single pair is priced at 1.1406 after a strong Friday saw funds exit the US dollar to look for safety elsewhere. European fundamentals make this a short term strategy as Italian budget concerns with neither side backing down, and the ongoing saga of Brexit negotiations are major headwinds for the currency.
Fears of an economic slowdown in the US proved to be premature, but investors worry that the boost from Trump tax cuts is evaporating. Stocks have been vulnerable as the U.S. Federal Reserve stands firm on its plans to hike one more time this year and three or four in 2019 on its path to rate normalization. US-China relations have not improved and earning reports have started to reflect the impact of tariffs on China.
The growth gap between US and Europe continues to widen, but for the most part has been already priced into the EUR/USD. The political situation where the European Council is opening too many fronts is a concerns for investors. Italy and the United Kingdom are asking for too much in the views of the EC, but it seems there is no clear middle ground in Italian budget negotiations or the trade deal after Brexit.
Brexit top of Mind for Sterling with BoE and Autumn Budget
The GBP/USD lost 1.97 percent during the week. Sterling is trading at 1.2832 versus the dollar. The equity market sell off did help the pound gain 0.11 percent on Friday. The risk event calendar in England is stacked with the Autumn Budget on Monday and the Bank of England (BoE) super Thursday not to mention the ongoing Brexit negotiations.
The lack of progress in the short term on Brexit will keep the BoE from making any changes to its monetary policy. A no-deal scenario is still very much alive and will limit what Governor Carney can propose, until those unknowns are sorted. The next rate hike in the UK could come until summer of 2019.
Stock Sell Off Puts Loonie Back in Defensive Mode
The Canadian dollar was the only major currency to not advance on the weakened dollar. The loonie lost 0.17 percent on Friday and with that would give back most of the gains earlier in the week and only end up 0.13 percent ahead of the greenback.
The Bank of Canada (BoC) delivered an expected 25 basis points rate lift on Wednesday, putting the currency pair near the 1.30 price level, but a combination of risk aversion and strong US data combined to once again put the loonie over 1.31 ahead of next week.
Employment data in the US and Canada will be the highlight for the pair. The US is forecasted to keep its steady pace of growth with employment its biggest pillar. The US could gain more than 200,000 jobs and wages see a rise of 0.2 percent, validating the Fed’s tightening policy and push the greenback higher.
Canadian jobs will prove crucial as the BoC was more hawkish than anticipated at its press conference following the rate hike announcement. Monthly GDP and raw material prices on Wednesday will precede the jobs announcement and together they will paint a clearer picture on the economy.
Oil Losses for Third Straight Week
Crude prices were higher on Friday but continue to fall as supply anxiety with conflicting Saudi Arabia comments and downward pressure from lower growth forecasts around the globe.
The equity market sell off also dictated the direction for oil to follow. Organization of the Petroleum Exporting Countries (OPEC) and other major producers are starting to worry about over supply as their production cut agreement is coming to and end, but as the same time global energy demand might be on the decline.
Gold Rises as Safe Haven Appeal Persists
Gold rose 0.28 on Friday as the stock market sell off hit the US dollar. US fundamentals continue to show a strong economy, but investors are still anxious about falling stocks and headed towards the safety of gold.
Gold has recouped its place as a safe haven after six months of losses. The Fed’s monetary policy and trade disputes have made stock markets drop and with investors liquidating long positions they have chosen the yellow metal as a destination. November if full of geopolitical risk events with US midterms, Italian budget and Brexit all in the agenda. Gold is expected to benefit from rising uncertainty, but is sensitive to a correction once the dust has settled.
Market events to watch this week:
Monday, October 29
- 8:30am USD Core Personal Consumption Expenditure
Tuesday, October 30
- 6:00am EUR Flash EU Gross Domestic Product
- 10:00am USD CB Consumer Confidence
- 8:30pm AUD CPI q/q
- Tentative JPY BOJ Policy Rate
- Tentative JPY Monetary Policy Statement
- Tentative JPY BOJ Outlook Report
Wednesday, October 31
- Tentative JPY BOJ Press Conference
- 6:00am EUR Flash EU CPI
- 8:15am USD ADP Non-Farm Employment Change
- 8:30am CAD GDP m/m
Thursday, November 1
- 5:30am GBP Manufacturing PMI
- 8:00am GBP BOE Inflation Report
- 8:00am GBP MPC Official Bank Rate Votes
- 8:00am GBP Monetary Policy Summary
- 8:00am GBP Official Bank Rate
- 8:30am GBP BOE Gov Carney Speaks
- 10:00am USD ISM Manufacturing PMI
- 8:00pm NZD ANZ Business Confidence
- 8:30pm AUD Retail Sales m/m
Friday, November 2
- 8:30am CAD Employment Change
- 8:30am CAD Trade Balance
- 8:30am CAD Unemployment Rate
- 8:30am USD Average Hourly Earnings m/m
- 8:30am USD Non-Farm Employment Change
- 8:30am USD Unemployment Rate
*All times EDT
US Core PCE Index Seen Slightly Weaker in September
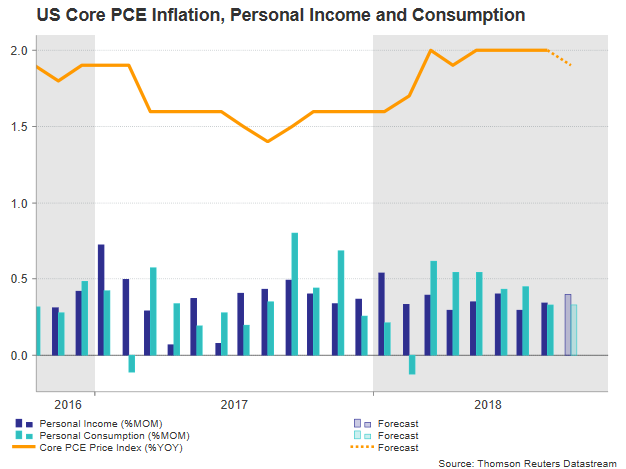
The Bureau of Economic Analysis will update its core Personal Consumption Expenditure (PCE) price index, which the Fed consults to set monetary policy, on Monday at 1230 GMT. The data are expected to show that inflation dropped a shy below the central bank’s price target. However, upside inflationary risks stemming from the US labor market and the restrictive trade environment could be a good reason for the Fed to continue to raise interest rates in the coming years to keep inflation at the target.
According to forecasts, the core PCE price index which strips out food and energy is said to have inched down to 1.9% year-on-year after holding at 2.0% for the past four months, still remaining the highest in 6 years.
While inflation looks to be holding at the target, the Fed has pledged to keep raising interest rates in the coming years despite the US President’s complaints about fast rising borrowing costs. A tightening labor market seems to be the bigger trigger behind the Fed’s rate plans as wage growth is awaited to return to the nine-year high of 2.9% y/y in October after inching down to 2.8% in September. The unemployment rate is also on the plus side, as it is anticipated to flatten at 3.7% in the same month, at the lowest since 1969, reflecting sustained consumer spending in the future. Note that the new USMCA trade agreement between the US, Canada and Mexico which replaced the previous NAFTA deal has stricter local content and minimum wages requirements, which would translate into higher labor costs in the future once the accord gets approved from legislative bodies in each nation probably by 2020.
Looking at personal consumption and personal income readings published alongside inflation figures, household spending is expected to have improved by 0.3% m/m in September as in August. Recall that on Friday personal consumer expenditures appeared higher by 4.0% in annualized terms in the third quarter compared to 3.8% in Q2, posting the strongest advance since Q4 2014, while consumption’s net contribution to the surprisingly larger 3.5% US GDP growth in the third quarter was the biggest relative to other GDP components, at 2.69%.
Income including wages and other benefits received by consumers is anticipated to have grown by 0.4% m/m in September versus 0.3% seen in August. This is above the anticipated 0.1% monthly increase in the core PCE index and thus consumption-positive.
US import tariffs are another supportive factor for inflation as higher costs to buy from abroad especially from China, which faces restrictions to a bigger list of exported products, reduce profit margins for US businesses. This in return forces companies to raise prices. Yet the dollar’s appreciation in September has probably limited the positive tariff effect on import prices, though this would also have made US products more expensive abroad. Recall that China has taken countermeasures against the US as well, imposing tariffs on US imports and hence turning US goods sold overseas less competitive. It is also worth noting that net exports substracted 1.78% from GDP growth.
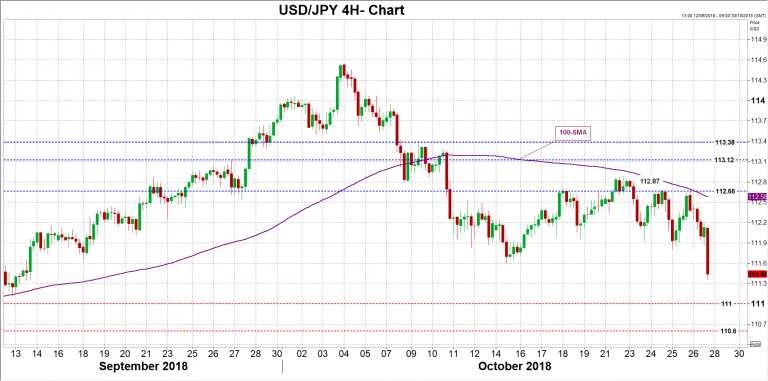
Should inflation or personal consumption/income readings arrive stronger than analysts project, justifying Fed’s decision to deliver further rate hikes in coming years, dollar/yen could bounce back above the 112.00 handle and test the recent peaks between 112.66 and 112.87, while if these fail to hold, traders could look for resistance in the 113.12-113.38 area, identified by the highs on September 26 and October 9 respectively.
In the alternative scenario, a miss in the data would increase worries that inflation has reached its peak at 2.0%, putting investors into doubts about whether the Fed should move with further monetary tightening in the future. The odds for a rate hike in December may decline as well. In the aftermath, dollar/yen could weaken towards the 111.00 psychological mark, while steeper declines could find support around 110.60 before eyes turn to the 110 round level.
Week Ahead – US Jobs Report and Eurozone GDP Eyed amid Growth Fears; BoJ and BoE Meet
After a turbulent week for global stocks, attention should shift back to currency markets over the next seven days as a barrage of important economic data are on the agenda, along with more central bank meetings. The latest nonfarm payrolls report from the US and the first print of third quarter GDP growth for the Eurozone will be the biggest attractions. Other highly anticipated releases will include inflation numbers from Australia, the Eurozone and the United States, the Canadian employment report and UK and Chinese manufacturing PMIs. It’s not going to be quiet in the central bank world either as the Bank of Japan and Bank of England hold scheduled policy meetings.
Aussie in the spotlight as busy week ahead for Australian data
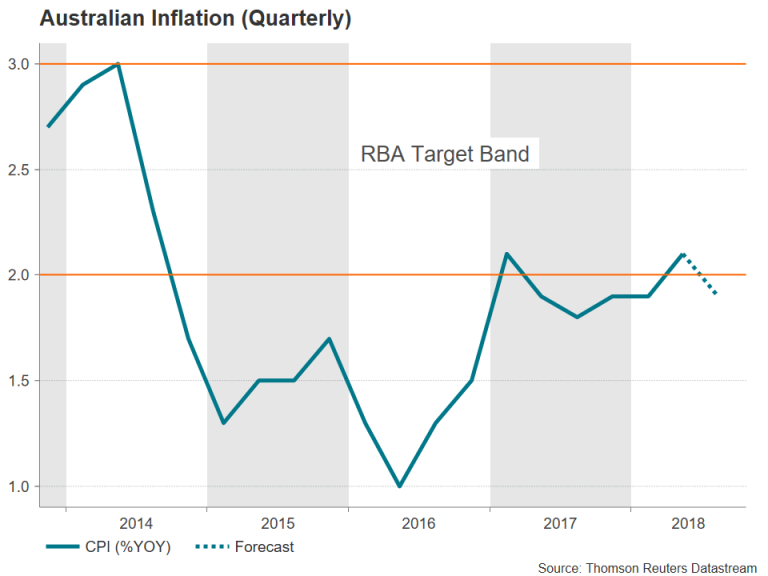
The Australian dollar was relatively resilient versus its US counterpart for much of the week despite the strong risk averse environment before finally giving way on Friday to fall to a new 32½-month low versus the greenback. The coming week could be more volatile for the aussie, however, with several key releases lined up. Starting first with September building approvals (a closely-watched barometer for construction activity) on Tuesday, to be followed by private sector lending figures and third quarter inflation figures on Wednesday. The annual rate of CPI is forecast to have moderated to 1.9% in the third quarter, to below the RBA’s lower target band, from 2.1% previously. An even weaker reading could further weigh on the aussie. On Thursday, the AIG manufacturing index for October and the September trade balance are due ahead of the latest retail sales numbers on Friday. Retail sales are expected to have maintained steady growth of 0.3% month-on-month in September.
Another focal point for aussie traders will be PMI data out of China. The official manufacturing and non-manufacturing PMIs are out on Wednesday, with the private Caixin manufacturing PMI coming up on Thursday. Both gauges of manufacturing activity are forecast to inch lower by 0.1 points in October.
Loonie looks to Canadian employment report to extend gains
The Canadian dollar got a major lift from a Bank of Canada rate hike this week, which was accompanied by a more hawkish tone. While weaker oil prices are capping the loonie’s gains, next week’s data may provide the extra boost needed for the currency to rise beyond this week’s one-week high of C$1.2965 per US dollar. First up are the monthly GDP estimates for August on Wednesday, together with September producer prices. On Friday, attention will turn to the October jobs report. Last month’s strong headline figure was misleading as all the gains were in part-time jobs, with full-time jobs declining in September. A rebound in new full-time positions in October would strengthen expectations that the BoC could soon be raising rates again. Also to watch on Friday are trade figures for September.
No surprises anticipated from Bank of Japan meeting
The Bank of Japan’s policy meeting on Wednesday will be the highlight of the Japanese calendar but before then, some economic releases will come into focus. Retail sales for September are due on Monday with the unemployment rate for the same month out on Tuesday. The preliminary reading on industrial output in September will follow on Wednesday. After eking out growth of just 0.2% in August, Japanese industrial production is forecast to have shrunk again in September, falling by 0.3% m/m.
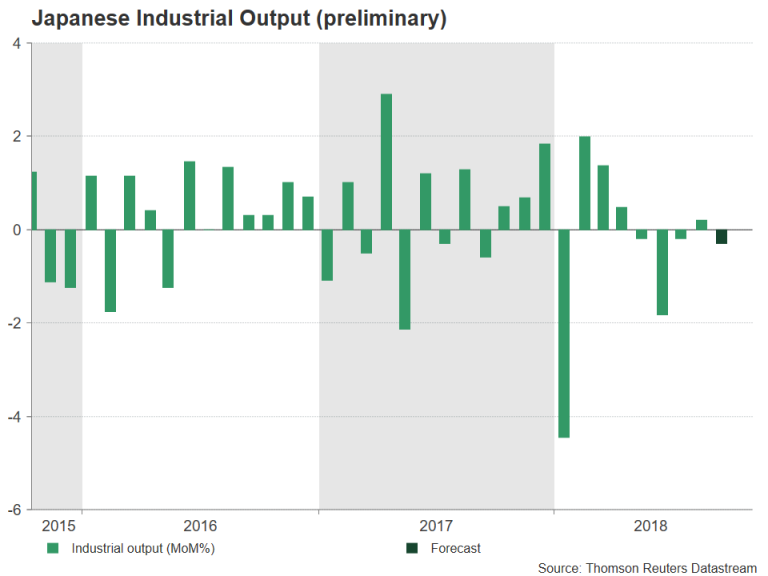
Moving to Wednesday, the BoJ is widely expected to stand pat in October but its quarterly outlook report, which it will publish alongside its policy statement, will be analysed for any changes to its inflation and growth forecasts. The yen could weaken if the Bank lowers its inflation forecasts as this would signal continued quantitative easing and lower rates for longer.
Bank of England’s ‘Super Thursday’ unlikely to halt pound’s slide
The Bank of England will announce its latest monetary policy decision on Thursday and like the Bank of Japan, the UK’s central bank will also publish quarterly forecasts. With Brexit talks dragging on and the dimming outlook for world growth, the Bank could slightly nudge down its projections for GDP growth, and possibly inflation too. However, it’s less probable that the BoE will modify its guidance of 1-2 rate increases per year over the next few years. The pound could firm slightly if Governor Mark Carney stresses in his press conference that the risks to inflation remain to the upside. But any signs of increased caution over the outlook could pull sterling below this week’s 7-week trough below $1.28.
It will be somewhat quieter on the data front for pound traders, with the main releases being the manufacturing and construction PMIs on Thursday and Friday, respectively.
First glimpse at Eurozone Q3 growth
GDP numbers out of the Eurozone on Tuesday – the initial reading for the third quarter – will be eagerly awaited as all evidence points to a further slowdown in Eurozone growth in the second half of the year rather than the expected pick-up. Gross domestic product in the euro area is predicted to have expanded by 0.4% quarter-on-quarter in the three months to September, unchanged from the second quarter. Also out on Tuesday is the economic sentiment indicator from the European Commission for October. On Wednesday, the flash estimate of inflation in October will be monitored for any improvement in underlying inflation, which unlike headline inflation, has failed to move higher during 2018. The headline rate of CPI is expected to edge up to 2.2% year-on-year in October, while the figure that strips out all volatile items is expected at 1.0% versus 0.9% in the prior month.
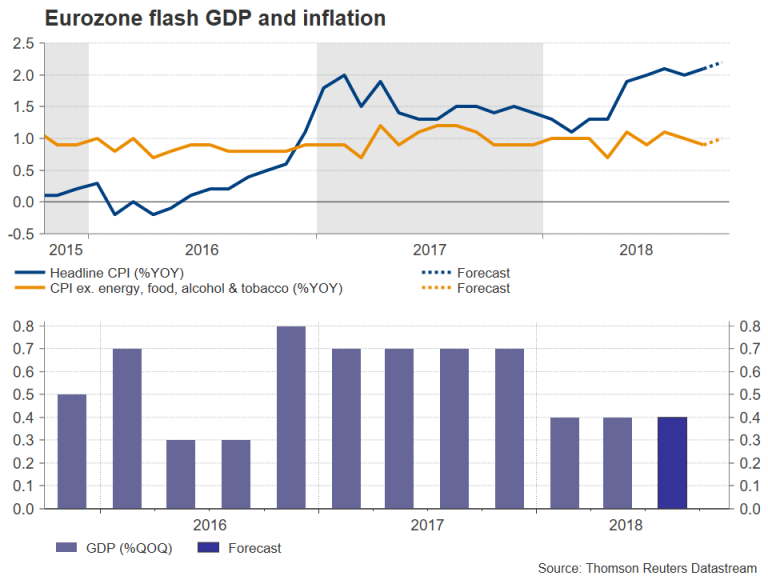
The euro could come under additional selling pressure should the GDP and CPI numbers disappoint as it would raise the heat on the European Central Bank to slow down its policy normalization plans.
PCE inflation and wage growth to be main focus for US dollar
Despite the panic selling in equities markets, partly driven by concerns of a slowdown in US and global growth, US fundamentals so far continue to point to a solid economy. Investors could get a reminder of this from next week’s data, which will include the personal income and outlays report, productivity growth and the all-important nonfarm payrolls report.
The personal income and spending numbers will start the week on Monday. Personal income growth is expected to have quickened slightly from 0.3% to 0.4% m/m in September, while personal consumption is forecast to have expanded by 0.3%, unchanged from the prior month. A key part of the personal income report is the personal consumption expenditures (PCE) price index, which the Fed looks at most closely when setting monetary policy. The core PCE price index is forecast to have dipped slightly to 1.9% y/y in September from 2%, suggesting inflationary pressures, although clearly present, remain under control.
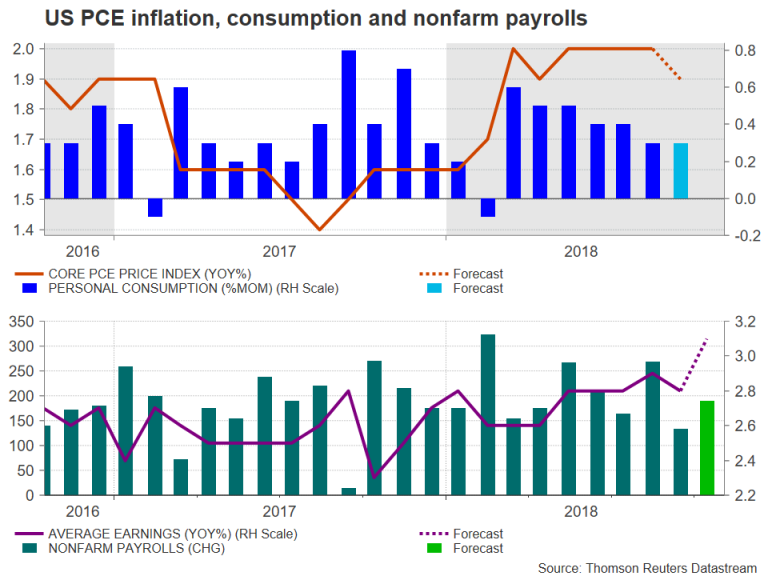
On Tuesday, the Conference Board will publish its consumer confidence gauge for October, with the index expected to ease from 18-year highs. Other US surveys to keep an eye on next week are the Chicago PMI on Wednesday and the ISM manufacturing PMI on Thursday. Also due on Thursday are the preliminary prints on third quarter labour costs and productivity. Higher productivity growth is seen as key in boosting wages, though this doesn’t appear to have taken place yet as productivity growth likely slowed from 2.9% to 2.0% during the third quarter.
More data on wages will follow on Friday from the October jobs report. As investors increasingly question the Fed’s tightening policy, the latest assessment on the US labour market is unlikely to give the US central bank cause for a pause in hiking interest rates. Nonfarm payrolls are projected to have risen by 190k in October, improving on September’s 134k, which was negatively impacted by Hurricane Florence. The jobless rate is anticipated to remain at 3.7% in October, but average hourly earnings growth likely accelerated to above 3%, rising to a more than 9-year high of 3.1% y/y according to consensus forecasts. Friday’s other noteworthy releases from the US are September trade figures and factory orders.
With volatility on Wall Street affecting the dollar’s moves in the near term, the upcoming data may not stir much market reaction if they fall mostly in line with expectations and only big surprises in the numbers – particularly in core PCE inflation and wage growth – are likely to trigger large swings.
Crude Oil Trading Bearish – Elliott wave Analysis
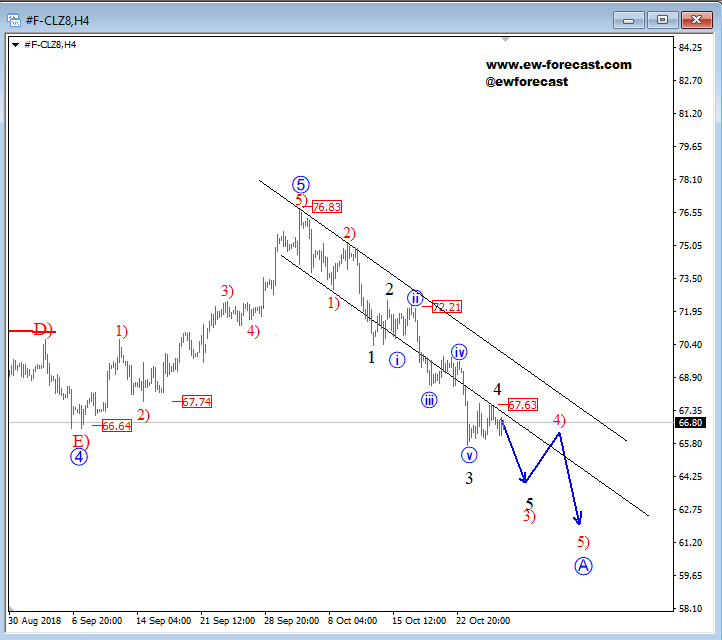
Crude oil is nicely unfolding a five-wave drop within sub-wave 3) of A, as part of a bigger, three-wave reversal. We currently see a minor pullback within a downtrend in play, which can look for resistance near the 67.6 area, where the lower channel line can also act as a reversal trigger and more weakness may follow.
Crude oil, 4h
USDJPY Outlook: Acceleration through Key Supports on US GDP Data Risks Deeper Fall
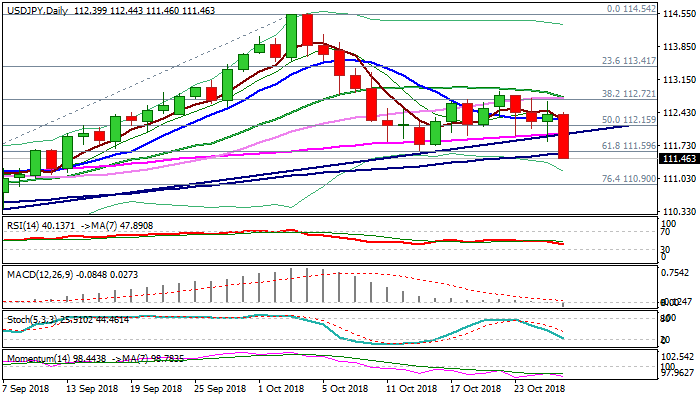
The pair accelerated lower and cracked key support at 111.62 (15 Oct low) after US Q3 GDP data showed that the US economy slowed less than expected (Q3 3.5% vs 3.3 f/c and 4.2% prev). Markets got more cautious about interest rate outlook as slowdown in Q3 would have negative impact on Fed, which is on track for another rate hike in Dec. Violation of strong technical supports at 111.62/55 (15 Oct trough, reinforced by rising 100SMA and Fibo 61.8% of 109.77/114.54) could generate fresh bearish signal for further easing. Bearish daily techs and risk-off mode help yen, with the latest US data , adding to negative outlook. Weekly close below 111.62/55 pivots would open way towards 110.90 (Fibo 76.4%) and would risk extension towards 110.38 (07 Sep low) and psychological 110 support.
Res: 111.62; 111.82; 111.98; 112.32
Sup: 110.90; 110.68; 110.38; 110.00