Sample Category Title
EUR/JPY Daily Outlook
Daily Pivots: (S1) 128.32; (P) 128.88; (R1) 129.54; More....
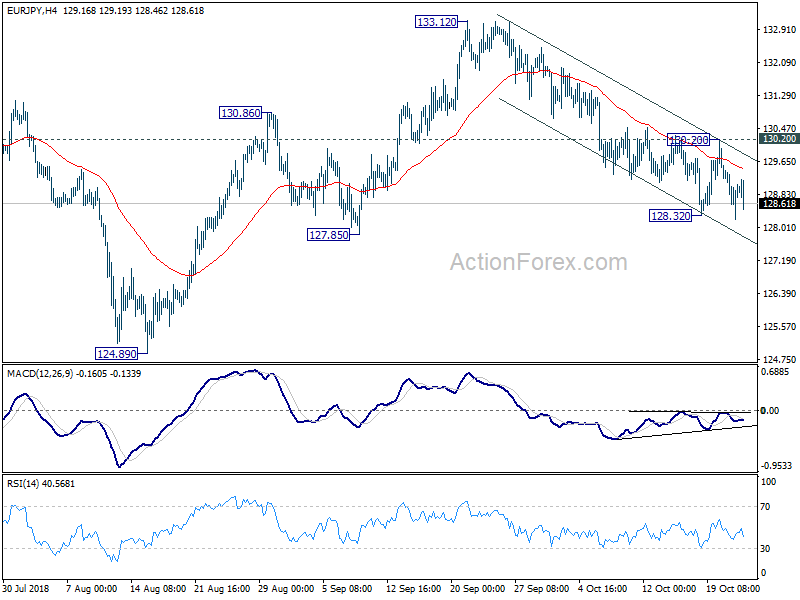
Prior break of 128.32 suggests that decline from 133.12 is resuming. Further fall is expected as long as 130.20 resistance holds. Break of 127.85 support should confirm completion of rebound from 124.89 at 133.12 and bring retest of this low.
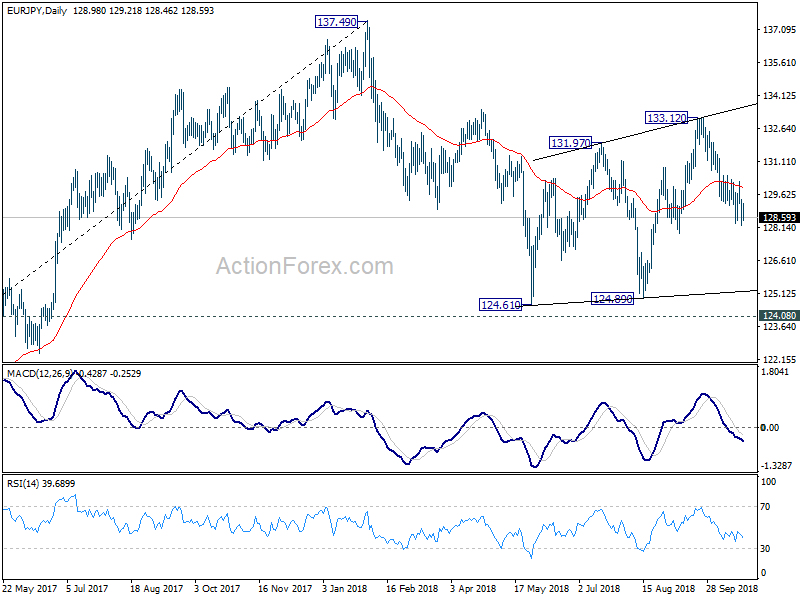
In the bigger picture, as long as 124.08 key resistance turn supported holds, larger up trend from 109.03 (2016 low) is still in progress. Firm break of 137.49 structural resistance will target 141.04/149.76 resistance zone next. However, decisive break of 124.08 will argue that such rise from 109.03 has completed and turn outlook bearish.
EUR/GBP Daily Outlook
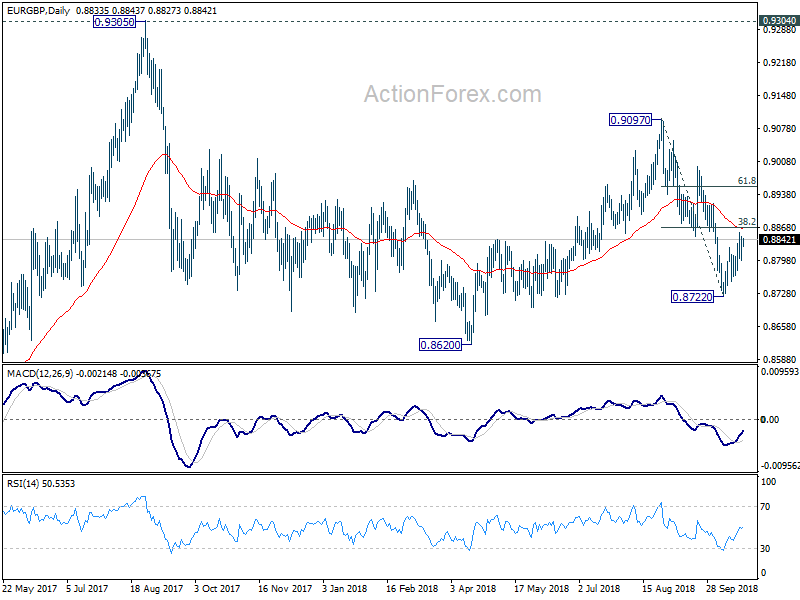
Daily Pivots: (S1) 0.8806; (P) 0.8828; (R1) 0.8856; More...
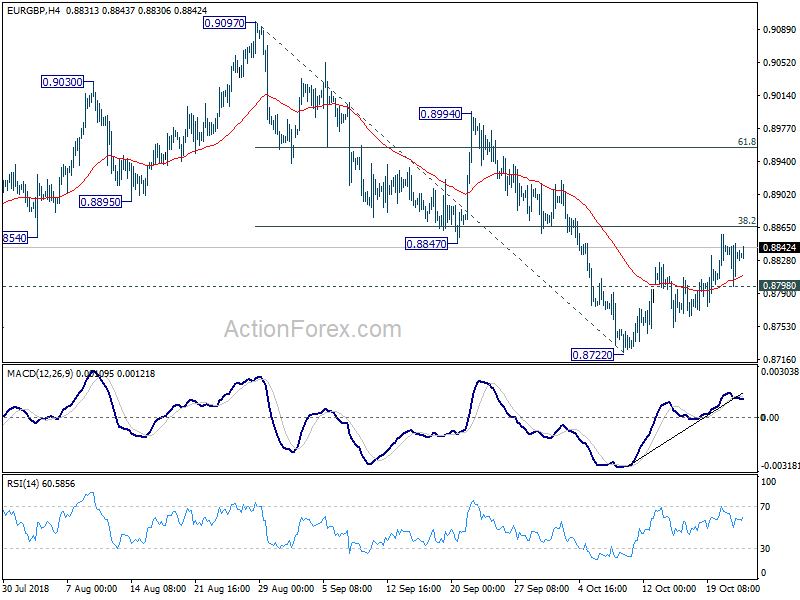
EUR/GBP's corrective rise from 0.8722 is still in progress and could extend to 38.2% retracement of 0.9097 to 0.8722 at 0.8865. Break will pave the way to 61.8% retracement at 0.8954 and above. On the downside, however, break of 0.8798 minor support will turn bias back to the downside for 0.8722 and possibly below.
In the bigger picture, EUR/GBP is seen as staying in long term range pattern started at 0.9304 (2016 high). Current development suggests that fall from 0.9303, as a down leg in the pattern, is still in progress. But in case of deeper fall, downside should be contained by 0.8116 cluster support, 50% retracement of 0.6935 (2015 low) to 0.9304 at 0.8120, to bring rebound. On the upside, break of 0.9097 will target 0.9304 resistance instead.
EUR/AUD Daily Outlook
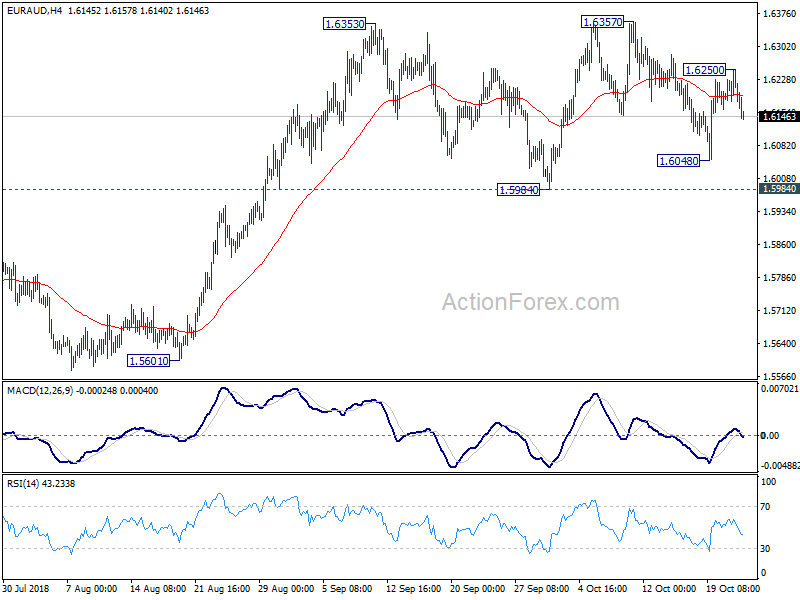
Daily Pivots: (S1) 1.6160; (P) 1.6207; (R1) 1.6236; More....
EUR/AUD retreats again after hitting 1.6250. With 4 hour MACD crossed below signal line, intraday bias is turned neutral again. Recent sideway trading is set to extend further. But as long as 1.5984 support holds, further rise is expected. On the upside, break of 1.6357 will resume larger up trend to 1.6587 key resistance next.
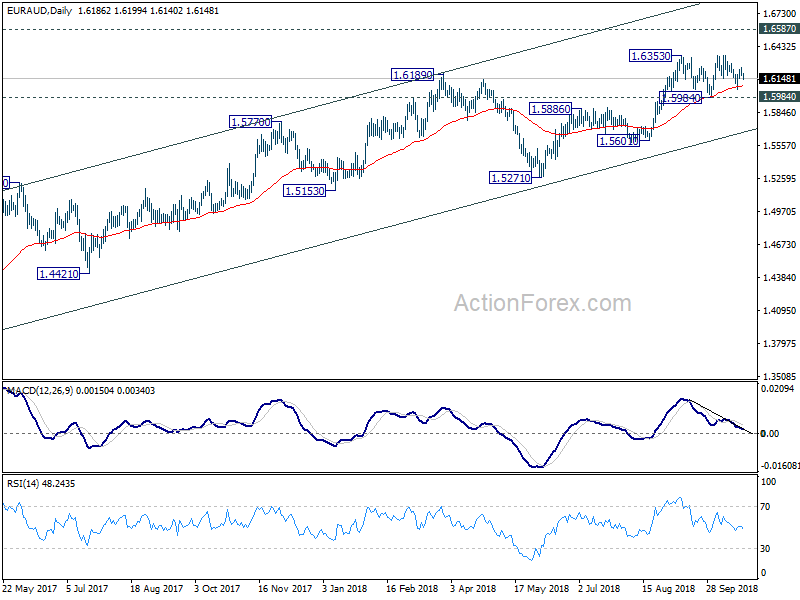
In the bigger picture, up trend from 1.3624 (2017 low) is still in progress. Further rise should be seen to retest 1.6587 (2015 high). Decisive break there will resume the long term rally and target 1.7488 fibonacci level. On the downside, break of 1.5984 support is need to be the first sign of medium term reversal. Otherwise, outlook will remain bullish in case of deep pull back. However, sustained break of 1.5984 will be an early sign of trend reversal.
Crude Oil Declines Sharply After Surprise Inventory Build
The Japanese yen declined slightly against the USD after the Japan’s manufacturing PMI numbers rose to 53.1. This was higher than the consensus estimate of 52.6. It was also the highest level in six months and came amidst a challenging business environment. At the same time, the country’s stocks declined to the lowest level in 13 months. This was mostly because of the problems in Italy and concerns about the Chinese economy.
The euro was little moved even after yesterday’s decision by Brussels to reject Italy’s budget plan for 2019. In recent weeks, the new Italian government has been in talks with the EU regarding the proposal, but the country has now been told they need to redraft the budget which proposed a controversial deficit equal to 2.4 percent of the country’s annual output – a figure much higher than the deficit goal promised by the previous Italian administration. Today, traders will continue to focus on the budget issue. They will also receive important PMI numbers from Germany and the EU.
The Canadian dollar strengthened slightly as traders waited for the interest rates decision from the Bank of Canada. Today, the BOC is expected to raise interest rates to 1.75%, the first hike since Canada made a deal with the US on the new NAFTA. This will be the second and possibly the final rate hike this year. Two more hikes are expected in 2019. This will be an important rates decision because of the disappointing inflation data released on Friday. Market participants will listen to the BOC to learn more about its impact on future hikes.
USD/CAD
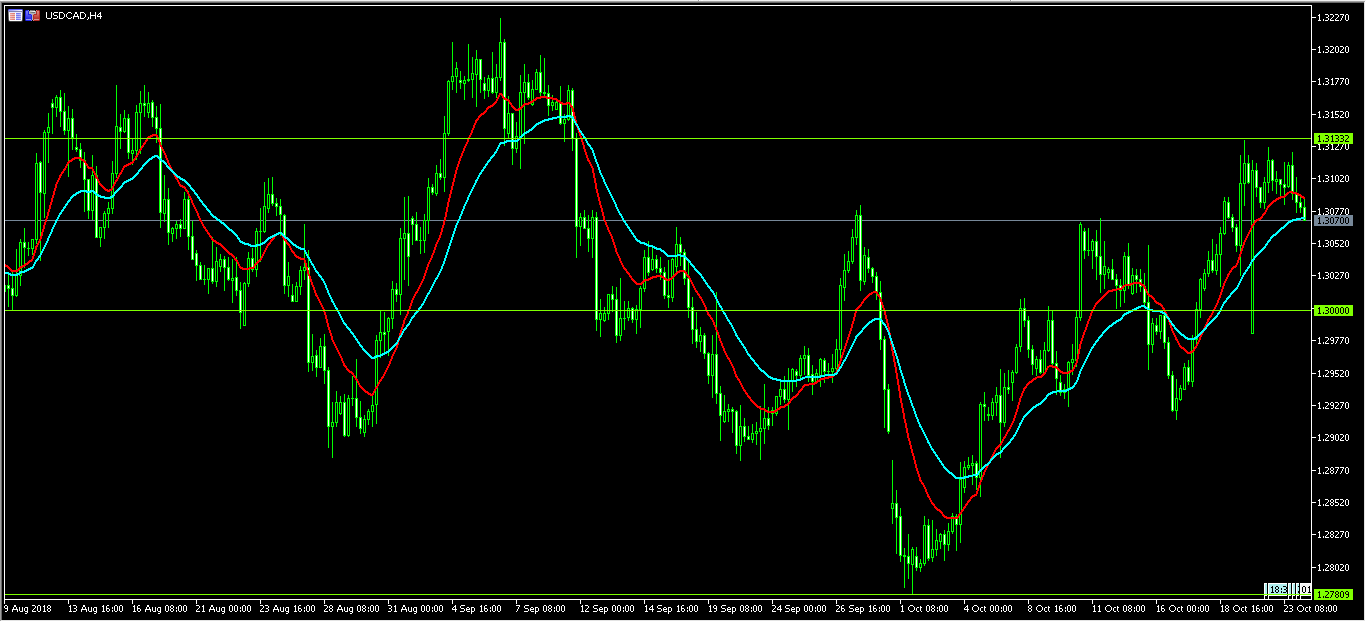
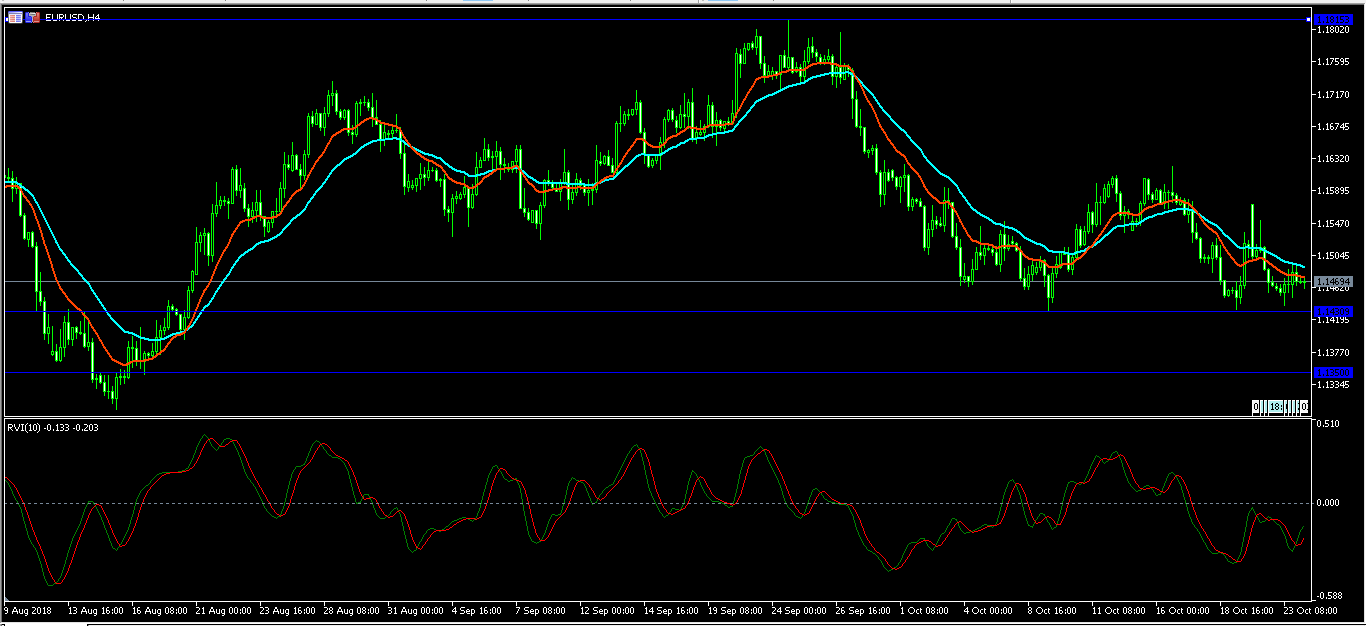
This month, the USD/CAD pair has risen from a low of 1.2780 and reached a high of 1.3133. Today, it has fallen slightly ahead of the important decision by the BOC. The current price is along an important support level as shown in the four-hour chart below. It is also at an important point where a crossover between the 28-day EMA and 14-day EMA is starting. This means it’s likely that the pair will continue moving lower, potentially to the 1.3000 level.
EUR/USD
Yesterday, the EUR/USD pair had a false upward breakout. This ended when the pair reached a high of 1.1492. Today, it was little moved in the Asian session as traders waited for the important manufacturing data from the EU. The pair will likely test the important support of 1.1430 and attempt a downward breakout. If it does, and based on the double EMA, the pair will likely continue the downward momentum to the 1.1350 in the next few days.
XBR/USD
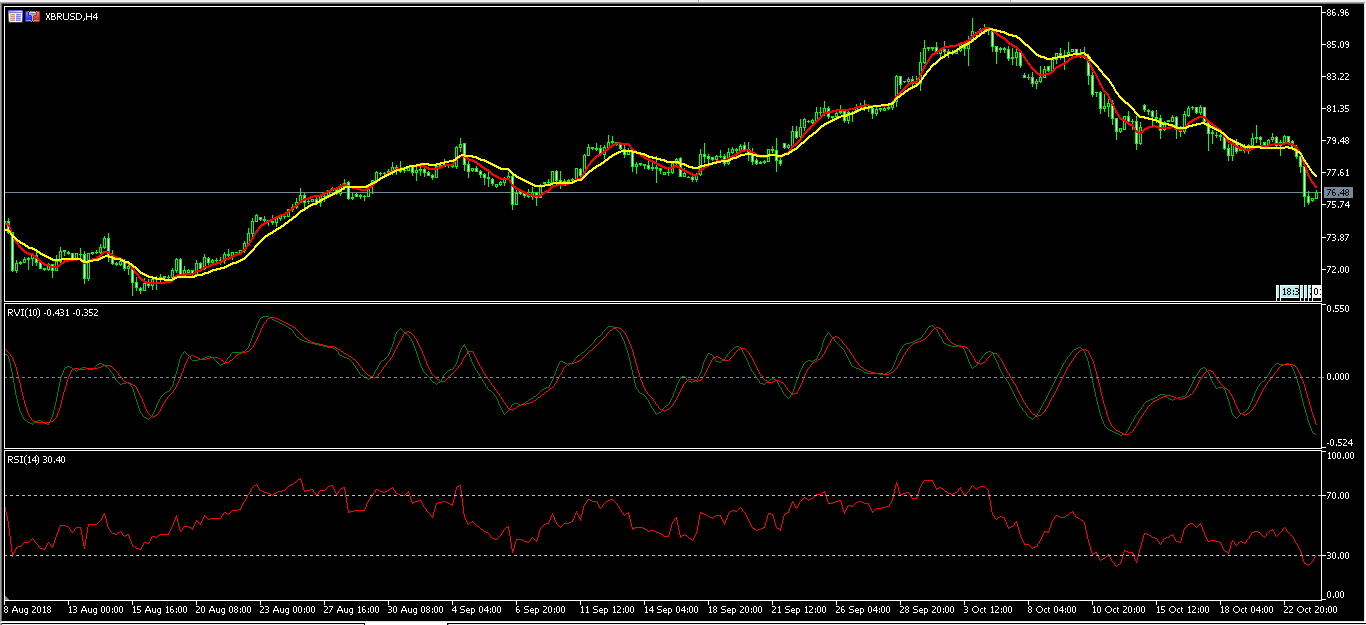
The price of crude declined sharply yesterday after data from the American Petroleum Institute (API) showed an increase buildup in inventories. The inventories rose to 9.88 million barrels, which was higher than last week’s drawdown. In the Asian session, the price of Brent declined to a low of $75.65. This was a continuation of the falling prices that started on October 8. The moving average indicators point to a more sustained decline. This is confirmed by the RSI and Relative Vigor Index indicators as shown below. Today’s movement will be mostly influenced by the EIA data.
EUR/CHF Daily Outlook
Daily Pivots: (S1) 1.1398; (P) 1.1414; (R1) 1.1430; More...
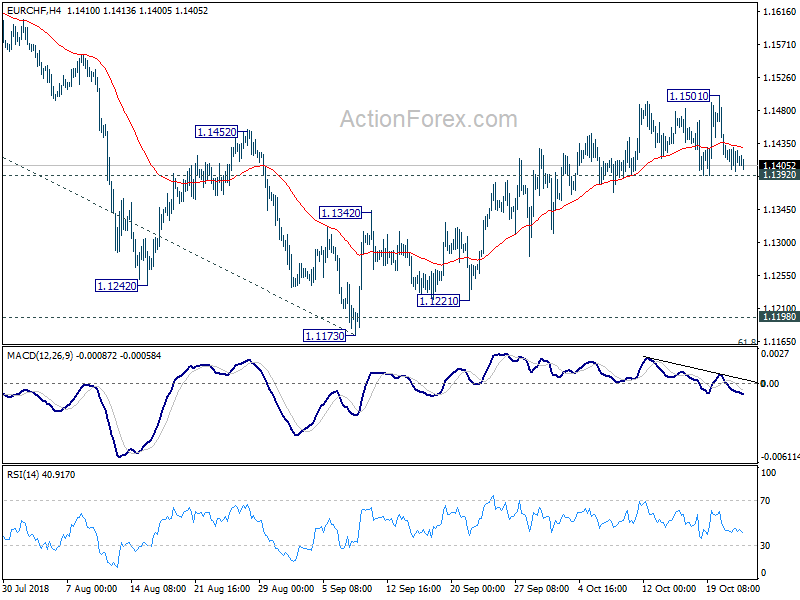
Intraday bias in EUR/CHF remains neutral at this point. With 1.1392 minor support intact, further rise is mildly in favor in the cross. On the upside, above 1.1501 will extend the rise from 1.1173 to 1.1713 resistance next. However, break of 1.1392 minor support will argue that the rebound has completed and turn bias back to the downside for 1.1154/98 zone again.
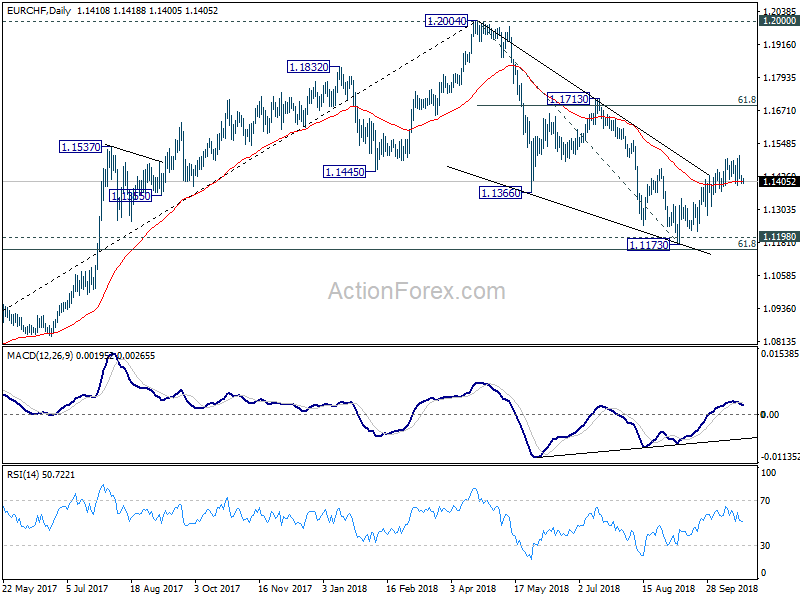
In the bigger picture, price actions from 1.2004 medium term top is seen as a correction only. Downside should be contained by support zone of 1.1198 (2016 high) and 61.8% retracement of 1.0629 to 1.2004 at 1.1154 to complete it and bring rebound. This cluster level is in proximity to long term channel support (now at 1.1234) too. A break of 1.2 key resistance is still expected in the medium term long term. However, sustained break of the mentioned support zone will mark reversal of the long term trend. In that case, 1.0629 key support will be back into focus.
Markets Pare Losses As Shanghai Rises, China State Planner Pledges To Support Employment In Trade Impacted Regions
General Trend:
- Asian equity markets generally move between gains and losses in early trading
- MSCI Asia Pacific index nears bear market territory
- Japan TOPIX index hits lowest level since Sept 2017, marine transportation firms decline
- Markets later pare losses as Shanghai rises
- China steelmakers rise, Henan Province comments on environmental checks
- Recent China bank earnings in focus, CCB and Ping An Bank
- China liquor names extend declines amid regulatory concerns
- LG Display moves been gains and losses, reported Q3 results
- Australian gold miner Newcrest rises over 2%, issued quarterly production update
- Tokyo Steel rises over 6%, raised FY profit guidance
- Automaker Subaru declines over 5%, cut H1 guidance
- Komatsu declines following earnings form Caterpillar
- Chip-related name SUMCO declines over 9% amid broker downgrade
- China State Planner pledges to support employment in trade impacted regions
- Japan Oct PMI Manufacturing hits the highest since April, trade-related concerns noted
- Ford announces management shakeup in China ahead of earnings
- Upcoming European bank earnings in focus Deutsche Bank, Barclays
- US companies expected to report earnings on Wed (including afterhours) include AMD, AT&T, Boeing, Ford, Freeport-McMoran, Microsoft, UPS, Visa and Whirlpool
- Japan PM Abe’s upcoming trip to China in focus (Oct 25-27th)
Headlines/Economic Data
Japan
- Nikkei 225 opened +0.7%
- 8606.JP Planning a partnership with CITIC and Sinosure in 3rd markets - Nikkei
- 8001.JP Makes investment into UK based car sharing start up, Hiyacar; no financial terms disclosed - Nikkei
- (JP) JAPAN OCT FLASH PMI MANUFACTURING: 53.1 V 52.5 PRIOR FINAL
- (JP) Japan Fin Min Aso: Supplementary budget aimed at disaster relief, does not know the specific numbers for the disaster damage as of yet
Korea
- Kospi opened +0.6%
- (KR) South Korea Fin Min Kim: With increasing trade war between China and US, South Korea should further diversify its trade channels and seek multilateral ties
- LG Display, 034220.KR Reports Q3 (KRW) Net 3.4B v 7.0Be; Op 140B v 79Be; Rev 6.1T v 6.3Te; Guides Q4 panel prices to fall q/q
- (KR) South Korea to cut transportation fuel tax by 15%, effective Nov 6th for 6 months
- (KR) South Korea to provide more financial assistance and tax incentives to boost sluggish facility investment, accelerate deregulation, stimulate innovation-led growth and create jobs
China/Hong Kong
- Hang Seng opened +0.2%, Shanghai Composite -0.6%
- (CN) Certain companies in Shenzhen (China) have received funds from the government - China Securities Times
- (CN) Said to be a shift in comments from China officials, who are now talking less about a potential peace with the US and more about stabilizing relationship to avoid escalation - US press
- (CN) China President Xi and Japan PM Abe to meet Friday, deals to be signed between Chinese and Japanese companies – Nikkei
- (CN) China PBoC Open Market Operation (OMO): To inject CNY150B in 7-day reverse repos v CNY120B prior: Net: CNY150B injection v CNY120B prior
- (CN) China PBOC sets Yuan Reference Rate: 6.9357 v 6.9338 prior
- (CN) China State Planner (NDRC): Approved fixed asset investment projects worth CNY697.7B in Jan-Sept
- (CN) China NDRC: Reiterates prices remain within a reasonable range, no signs of a rising trend in consumer inflation; to increase support to support to stabilize jobs in regions most impacted by US/China trade war
- (CN) China has halted special approval process for new video games, weighing on video gaming stock names (Tencent, NetEase, Shanda, Kongzhong, The9, Netdragon, Giant Interactive, Perfect World, ChangYou)
- (CN) China State Council: Industrial sector facing downward pressure, but overall operation of the industrial economy is still in a reasonable range, and there is no need to worry too much - Chinese press
Australia/New Zealand
- ASX 200 opened 0.0%
- (AU) Australia Oct Prelim CBA Manufacturing PMI: 54.3 v 54.0 prior; Services: 50.8 v 52.2 prior; Composite: 51.2 v 52.5 prior
- (AU) Australia Sept Skilled Vacancies m/m: -0.6% v -0.2% prior
- (AU) Australia Treasury Sec GAETJENS: A lot of household debt is held by wealthy, get some comfort from debt distribution
Other Asia
- (PH) Philippine Central Bank (BSP): CPI to ease 0.2% if oil tax halted for entire 2019
North America
- US equity markets ended lower: Dow -0.5%, S&P500 -0.6%, Nasdaq -0.4%, Russell 2000 -0.8%
- (US) Weekly API Oil Inventories: Crude: +9.9M v -2.1M prior
- (US) SEMI: Sept North America Billings $2.09B v $2.24B prior, -6.5% m/m and 1.8% y/y
- (US) US President Trump reiterates criticism of Fed Chairman Powell, says too early to tell if he regrets hiring Fed Chair Powell - US financial press interview
Europe
- (UK) Cabinet reportedly warned that Brexit transition to last for years; could have long-running multi-year transition; Northern Ireland to be in separate VAT area
- UK press
- (IT) Italy PM to meet with Russia's Putin and Medvedev to discuss bilateral cooperation
- (IT) Italy Cabinet Undersecretary Giorgetti: Reiterates govt view that BTP/Bund 10-year spread near 400bps would mean bank recap - press
Levels as of 01:30ET
- Hang Seng +0.1%; Shanghai Composite +0.9%; Kospi -0.4%; Nikkei225 +0.4%; ASX 200 -0.2%
- Equity Futures: S&P500 -0.2%; Nasdaq100 -0.3%, Dax +0.9%; FTSE100 +0.5%
- EUR 1.1462-1.1475; JPY 112.32-112.65 ; AUD 0.7080-0.7106;NZD 0.6546-0.6567
- Dec Gold -0.2% at $1,234/oz; Dec Crude Oil +0.2% at $66.61/brl; Dec Copper +1.4% at $2.78/lb
EURUSD Still Struggling With 1.1480 Level
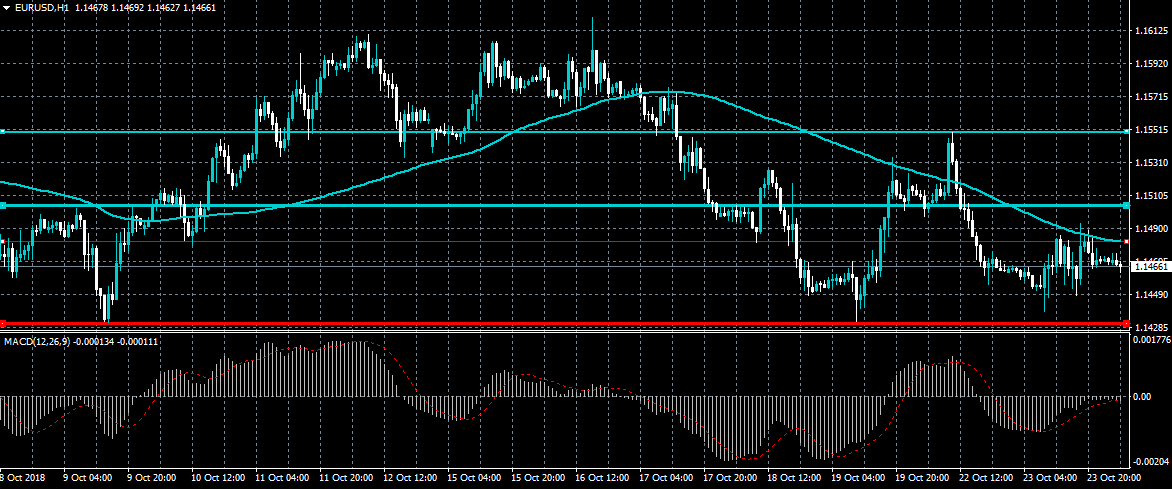
The euro continues to struggle to build upside momentum against the US dollar, with the 1.1480 resistance level remaining a technical barrier for buyers. The EURUSD pair is now forming smaller and larger head and shoulders patterns across the lower time frames. Intraday EURUSD traders still await a sustained directional breakout from the 1.1431 to 1.1480 price range.
The EURUSD pair remains intraday bearish while trading below the 1.1480 level, key technical support is found at the 1.1431 and 1.1380 levels.
If the EURUSD pair trades above the 1.1480 level, key intraday resistance is found at the 1.1500 and 1.1550 levels.
GBPUSD Bearish Pattern Forming
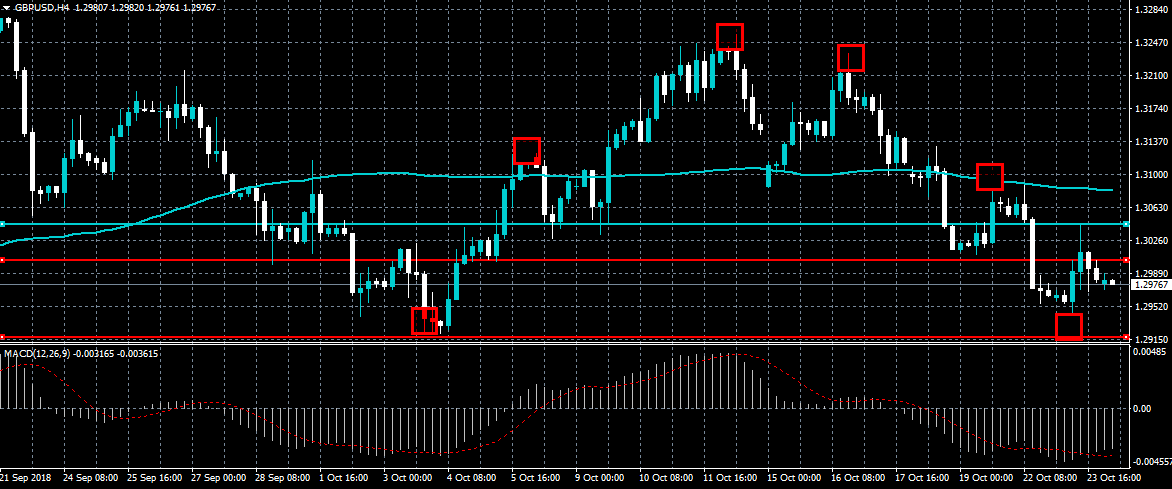
The British pound is once again probing the downside against the US dollar after a minor bullish corrective move above the 1.3000 level on Tuesday. The GBPUSD pair is looking increasingly bearish as a head and shoulders pattern is now starting to form across the four-hour time frame. Sellers will likely target the 1.2918 level, while buyers will aim to move price above the 1.3000 level.
The GBPUSD pair remains strongly bearish while trading below the 1.3000 level, key support is found at the 1.2918 and 1.2860 levels.
If the GBPUSD pair moves above the 1.3000 level, buyers are likely to test the 1.3045 and 1.3080 resistance levels.
Bitcoin Price Consolidate As The Sec Considers ETF Proposal
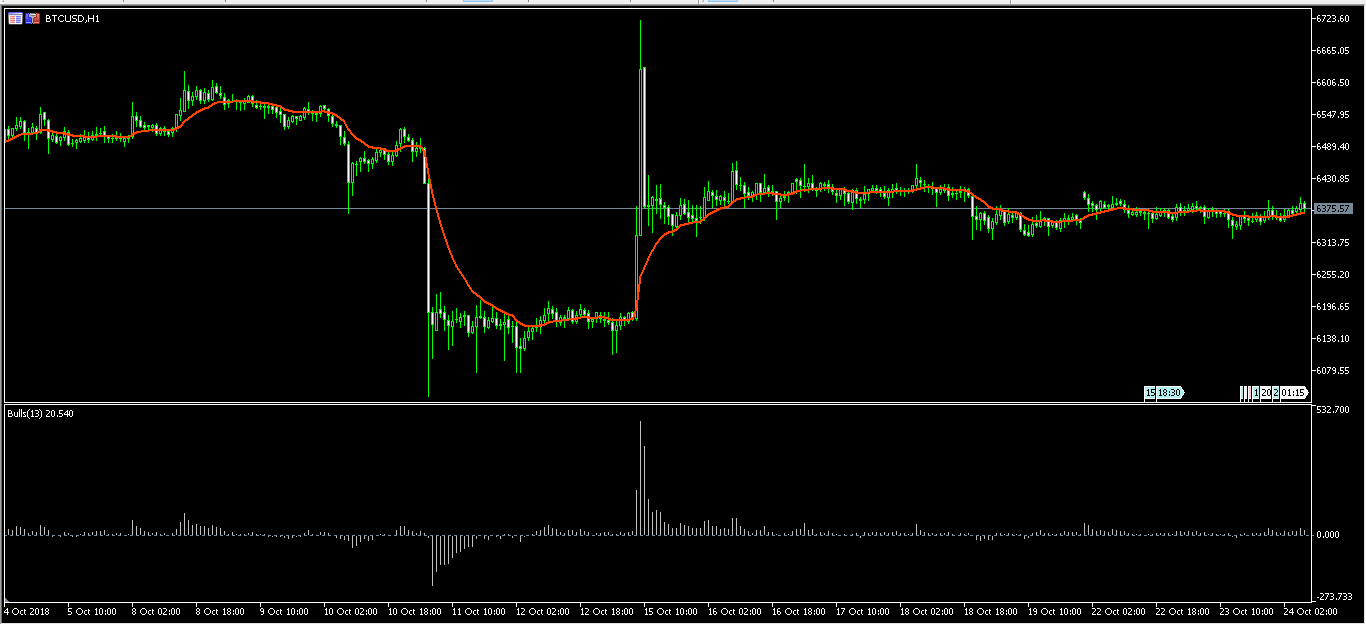
This week, the price of Bitcoin remained unchanged following large swings that were experienced early in the month. On October 10th 2018, the price declined from $6525 and reached a low of $6030. A week later, the price moved from $6170 to a high of $6720. This was the biggest intraday change in months. After that, it declined to $6325. It has been largely unmoved since then.
Discussions surrounding Bitcoin ETFs have continued after the SEC met with top representatives from VanEck and SolidX to talk through their ETF proposals. The meeting was also attended by representatives from CBOE, which will list the ETF.
In the presentation made by VanEck, the company said that it had started working on the ETF in 2015. After the SEC rejected the initial ETF proposal in 2015, the company went on to tweak it based on the guidelines issued. Even with the tweaks, the ETF proposal was rejected again this year. Each share of the VanEck SolidX Bitcoin Trust is set to cost a hefty $200,000. This means that it’s aimed at large institutional investors rather than retail investors.
It is likely that the SEC will accept the ETF proposal by VanEck. This is mostly because due to the reputation the company has built over the years. It has more than $48 billion in assets under management and runs some of the biggest ETFs in the industry.
However, there is no clear indication that the ETF will attract demand from institutional investors.
The BTC/USD pair is trading at 6376. It has been largely unchanged as shown in the chart below. This consolidation means that the pair could see a breakout in either direction.
AUDUSD Hovers Near 32-Month Bottom, Remains Below Moving Averages
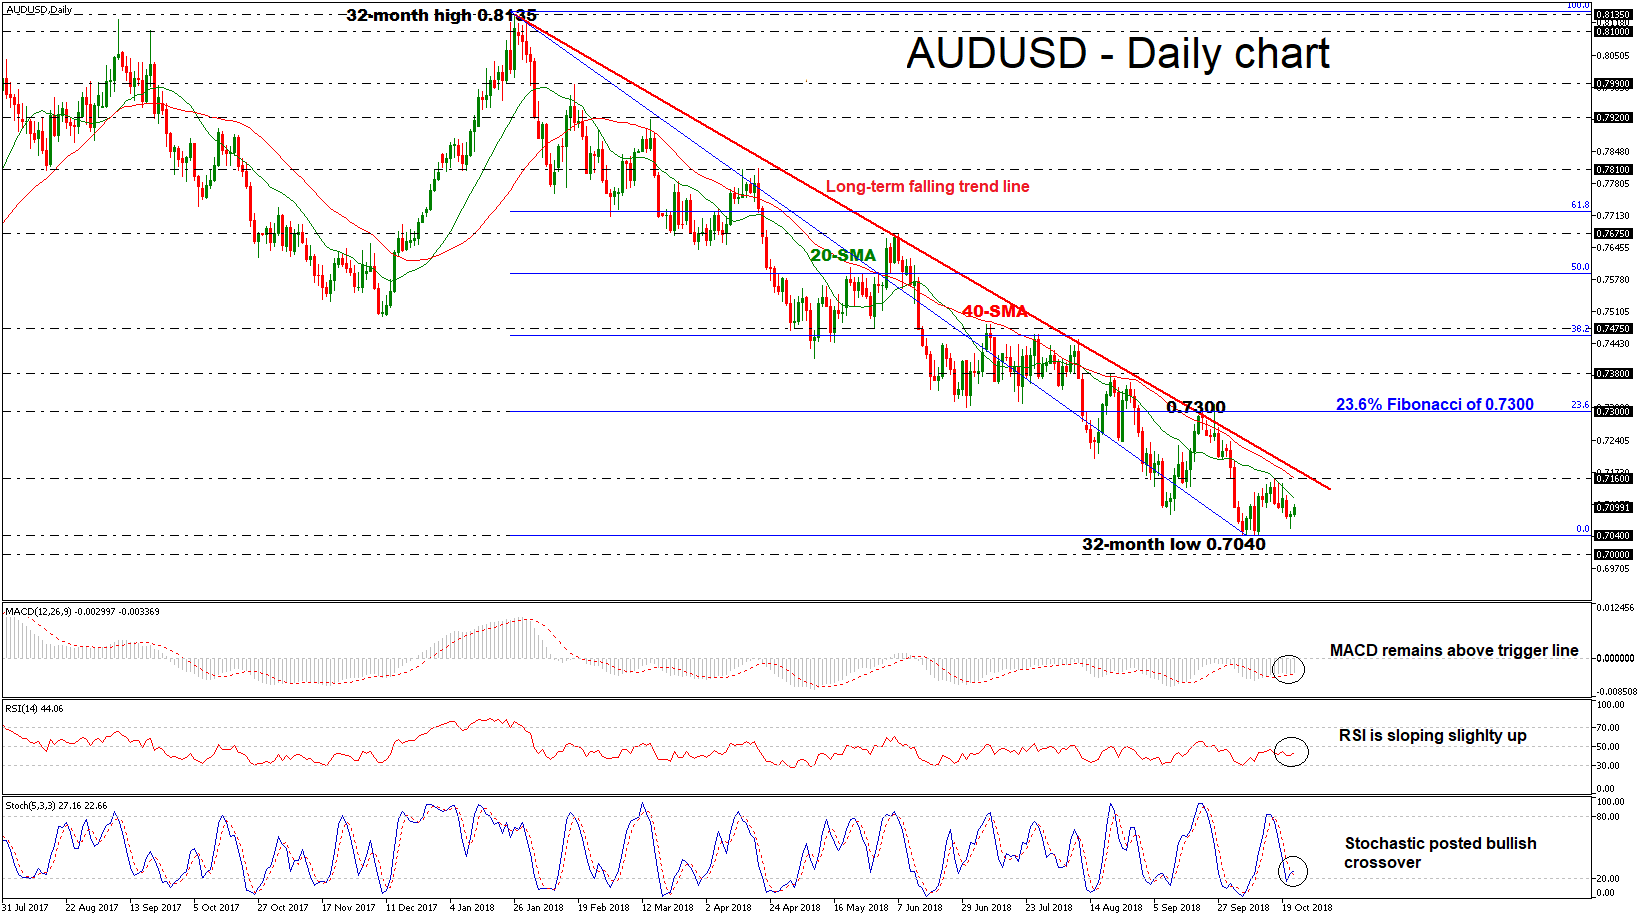
AUDUSD is flirting with the 32-month low over the last couple of sessions and holds below the 20- and 40-simple moving averages (SMAs) in the daily timeframe. The bearish trend though could stay in place given that prices continue to fluctuate beneath the long-term descending trend line.
According to the RSI, the market could maintain neutral to positive momentum in the very short-term as the indicator is sloping up, though the fast stochastics suggest that the market is looking more bullish above the oversold area; the blue %K line is fluctuating around the red %D line. Furthermore, the MACD oscillator is standing above the trigger line below the zero line.
On the upside, the price could attempt to overcome the 20-SMA at 0.7117 and retouch the falling trend line, which is just above the 40-SMA and the 0.7160 resistance level. Should traders continue to buy the pair above that significant obstacle, shifting the long-term downtrend to a more neutral one, resistance could then run towards the 0.7300 handle, which coincides with the 23.6% Fibonacci retracement level of the downleg from 0.8135 to 0.7040.
A continuation of the downside movement could find immediate support at the 0.7040 barrier, achieved on October 8. If the latter fails to halt bearish movements, the next target could be the 0.7000 round figure, identified by the bottom on February 2016. A sharp bearish rally below this hurdle could open the door for the 0.6830 support, reached on January 2016.
Overall, AUDUSD remains under negative pressure over the last nine months after it hit the 0.8135 level and failed to create a noteworthy bullish retracement.