Sample Category Title
AUD/USD Daily Outlook
Daily Pivots: (S1) 0.7063; (P) 0.7077; (R1) 0.7099; More...
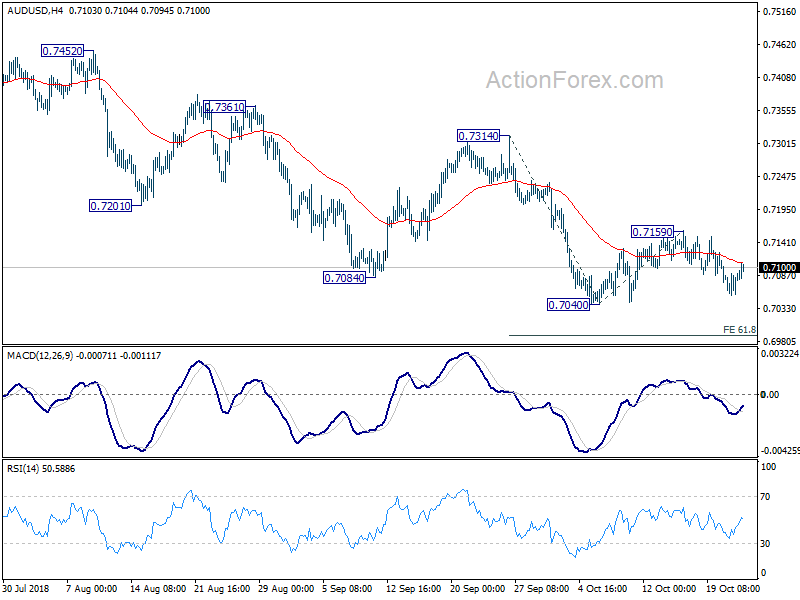
AUD/USD recovered ahead of 0.7040 low and intraday bias is turned neutral again. Consolidation from 0.7040 might extends with another recovery. By upside should be limited by 0.7159 resistance to bring fall resumption eventually. on the downside, break of 0.7040 will resume recent down from 0.8135. Next target will be 61.8% projection of 0.7314 to 0.7040 from 0.7159 at 0.6990 and then 100% projection at 0.6885.
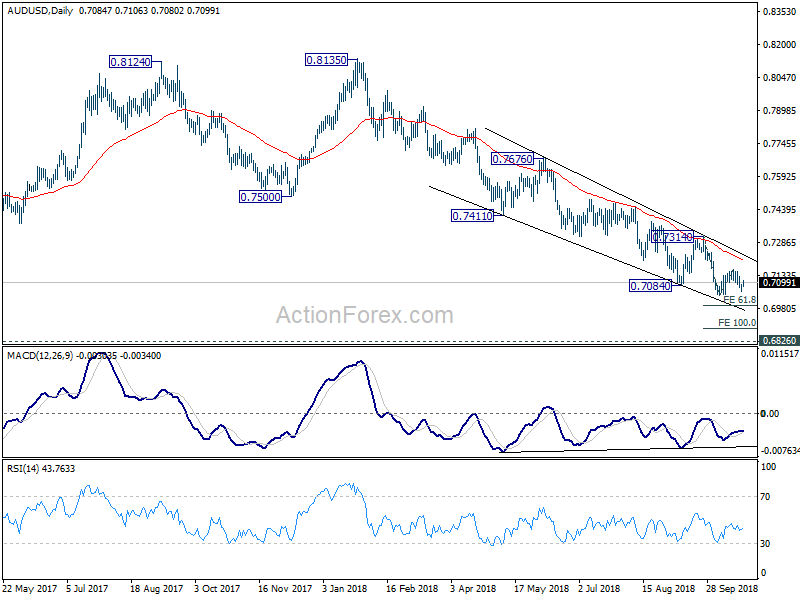
In the bigger picture, fall from 0.8135 is tentatively treated as resuming long term down trend from 1.1079 (2011 high). Decisive break of 0.6826 will target 0.6008 key support next (2008 low). On the upside, break of 0.7314 resistance is needed to be the first sign of medium term bottoming. Otherwise, outlook stays bearish even in case of strong rebound.
Elliott Wave Analysis: EURJPY More Downside Expected
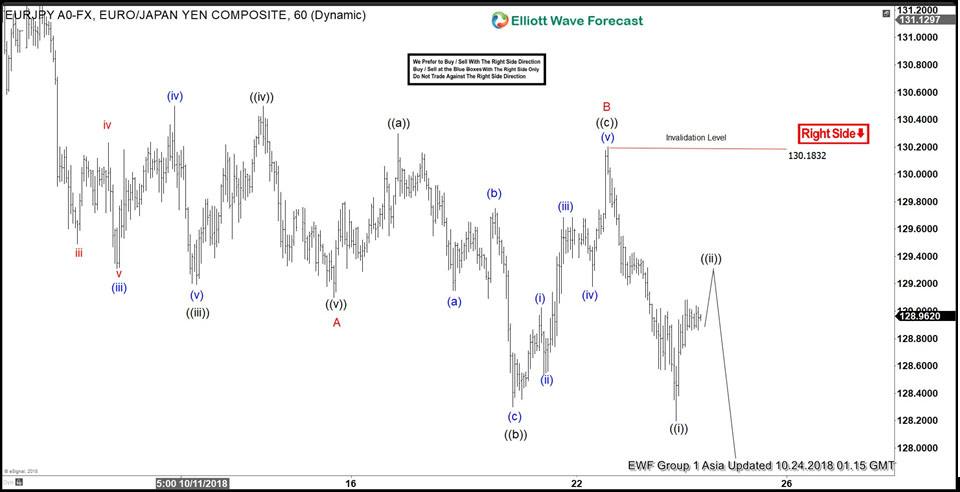
EURJPY short-term Elliott wave analysis suggests that the decline to 129.13 low ended Minor wave A. The internals of that decline unfolded in 5 waves impulse structure in a lesser degree cycle. Thus suggests that the pair can be doing a Zigzag correction lower. Up from there, a bounce to 130.18 high ended Minor wave B bounce as a Flat correction where Minute wave ((a)) ended in 3 swings at 130.30. A decline to 128.32 low ended 3 waves in Minute wave ((b)). Then a rally to 130.18 high ended 5 waves in Minute wave ((c)) & also completed Minor wave B bounce. Down from there, Minor wave C remain in progress & has managed to make a new low below 128.32 low confirming the next extension lower. Where Minute wave ((i)) of C ended in lesser degree 5 waves at 128.22 low. Up from there, pair is doing a 3 wave bounce in Minute wave ((ii)) of C towards 129.64-129.84 area. Then as far as a pivot from 130.18 high stays intact pair is expected to fail for more downside. We don’t like buying it and prefer more downside against 130.18 high.
EURJPY 1 Hour Elliott Wave Chart
Riksbank To Signal A December Hike
Market movers today
The main event today is the Riksbank meeting which will also see the release of new forecasts. On the back of inflation prints on track with its forecasts and inflation expectations close to the target, we expect the Riksbank to stick to its intentions set out in September, i.e. it will basically signal an intention to raise the repo rate by 25bp in December and then twice a year going forward.
The euro area flash PMIs for October are due today. In September, manufacturing numbers continued this year's declining trend and fell to 53.2, while services rose slightly to 54.7. We expect services PMI to extend the pickup and rise to 54.9; in contrast, we see a downside risk for manufacturing PMI, declining further to 53.0 due to the deteriorating new orders component in the latest reading.
Selected market news
Unleashed risk-off sentiment has spread through the markets pushing stocks and major yields lower. Oil price sank, while Europe's periphery spreads widened further. The global sentiment has been weighed by declining Chinese stocks, which lost the rest of their recent rebound, spilling over the contagion to Asian markets. As the EU published 'a negative opinion' on Italian budget, country's spreads started leading widening across the rest of European periphery.
In emerging markets yesterday, the Turkish lira was under pressure as domestic politics hit the sentiment: the President Recep Erdogan's AK Party and the nationalist MH Party seem to face a rift. The AKP needs other parties in the parliament to pass laws. The MHP's leader told that he would terminate a voting union with Erdogan. Also yesterday Erdogan got tough on Saudis claiming that the Saudi journalist Jamal Khashoggi's murder was a part of planned operation. (Geo)politics seem to be the main driver for Turkish assets in the near term
USD/CAD Daily Outlook
Daily Pivots: (S1) 1.3066; (P) 1.3094; (R1) 1.3112; More...
Intraday bias in USD/CAD is neutral as consolidation from 1.3132 temporary top extends. As long as 1.3027 minor support holds, further rally is expected. On the upside, above 1.3132 will target 1.3225 resistance first. Decisive break there will confirm that corrective decline from 1.3385 has completed at 1.2781. In that case, retest of 1.3385 high should be seen next. On the downside, however, break of 1.3027 minor support will suggest rejection by channel resistance. Intraday bias will be turned back to the downside for 1.2916 and below.
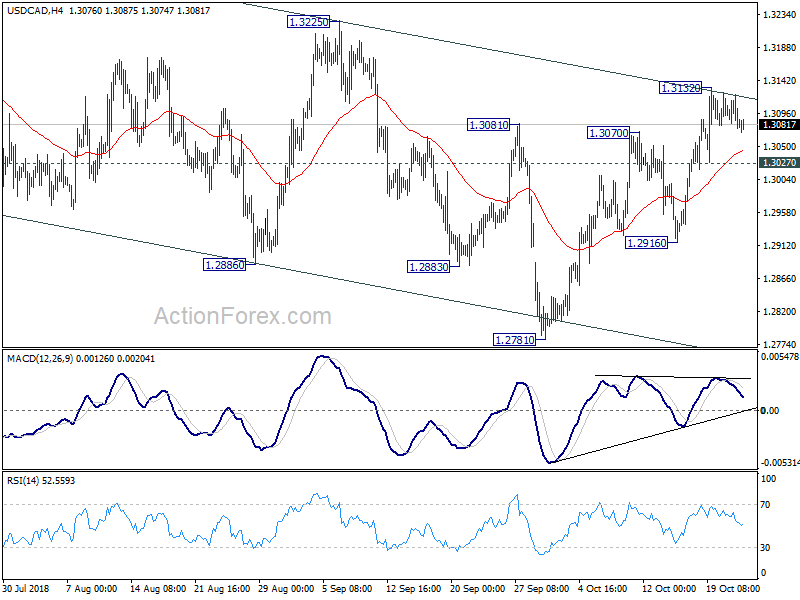
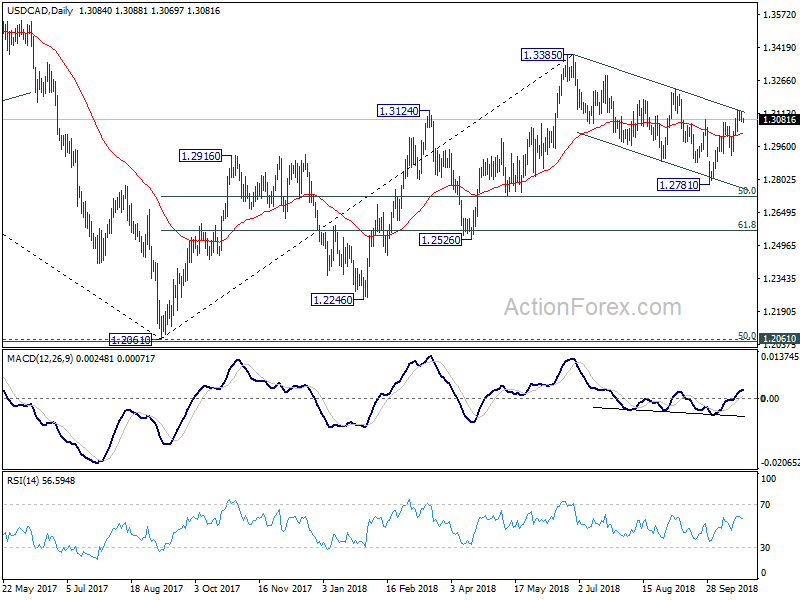
In the bigger picture, current development argues that choppy corrective fall from 1.3385 has completed at 1.2781 already. And that in turns suggests that the up trend from 1.2061 is still in progress. Decisive break of 1.3385 will pave the way to 61.8% retracement of 1.4689 to 1.2061 at 1.3685. On the downside, though, break of 1.2916 support will likely extend the fall from 1.3385 to 61.8% retracement of 1.2061 to 1.3385 at 1.2567 before completion.
EUR/USD Daily Outlook
Daily Pivots: (S1) 1.1442; (P) 1.1468; (R1) 1.1496; More....
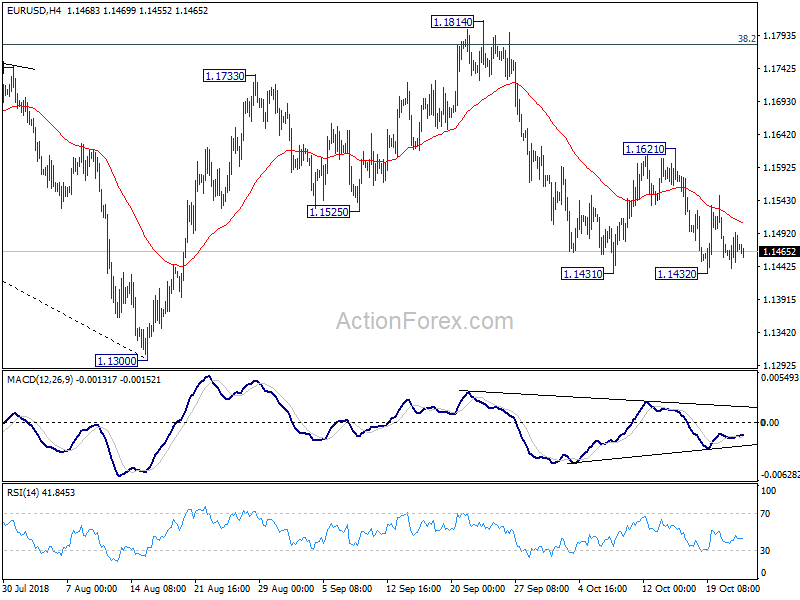
Intraday bias in EUR/USD remains neutral at this point as range trading continues. On the downside, break of 1.1431 will resume the fall from 1.1814. Intraday bias would then be turned back to the downside for retesting 1.1300 low next. In case of another recovery, upside should be limited by 1.1621 resistance to bring fall resumption eventually. However, break of 1.1621 will turn focus back to 1.1814 resistance instead.
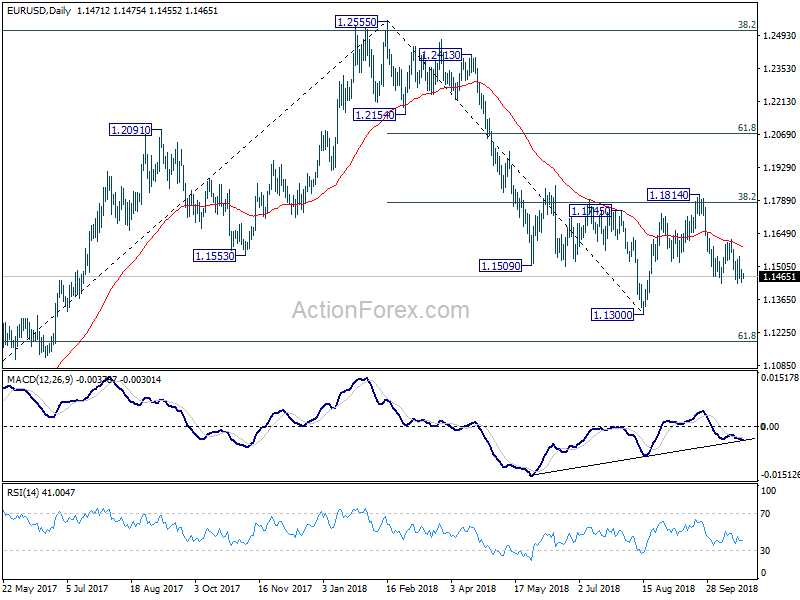
In the bigger picture, corrective pattern from 1.1300 could have completed at 1.1814 after hitting 38.2% retracement of 1.2555 to 1.1300 at 1.1779. Decisive break of 1.1300 will resume the down trend from 1.2555 to 61.8% retracement of 1.0339 (2017 low) to 1.2555 at 1.1186 next. Sustained break there will pave the way to retest 1.0339. On the upside, break of 1.1814 will delay the bearish case and extend the correction from 1.1300 with another rise before completion.
GBP/USD Daily Outlook
Daily Pivots: (S1) 1.2933; (P) 1.2988; (R1) 1.3040; More...
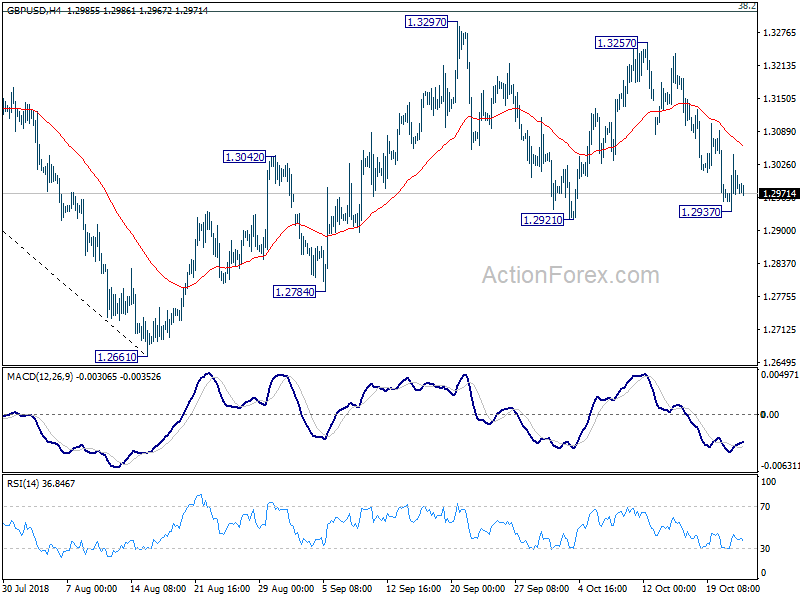
Intraday bias in GBP/USD remains neural for the moment and outlook is unchanged. Rise from 1.2661 is seen as a corrective move. In case of another rebound, upside should be limited by 1.3316 key fibonacci level to bring down trend resumption eventually. On the downside, break of 1.2921 support will add to the case that corrective rise from 1.2661 has completed. Next target will be 1.2661/2784 support zone.
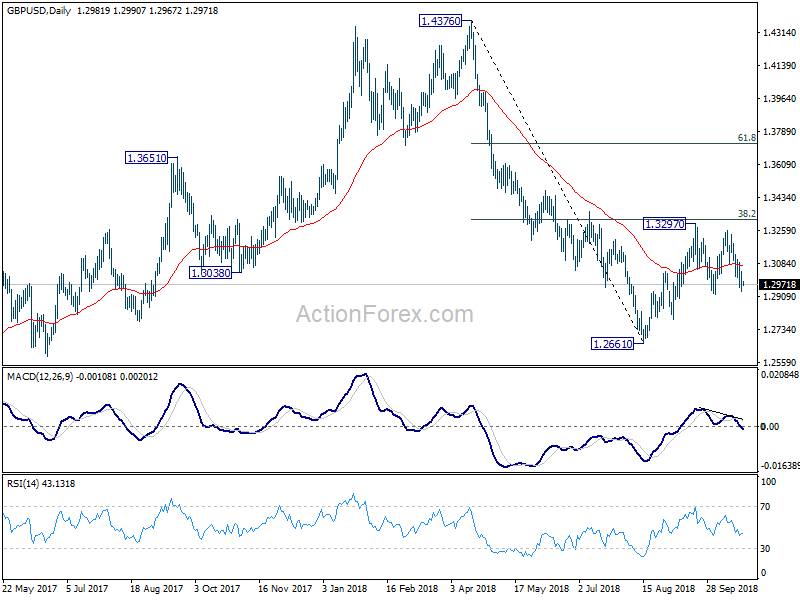
In the bigger picture, whole medium term rebound from 1.1946 (2016 low) should have completed at 1.4376 already, after rejection from 55 month EMA. The structure and momentum of the fall from 1.4376 argues that it's resuming long term down trend. And this will be the preferred case as long as 38.2% retracement of 1.4376 to 1.2661 at 1.3316 holds. However, firm break of 1.3316 would bring stronger rebound to 61.8% retracement at 1.3721. And, the eventual depth of the fall from 1.4376, and the chance of hitting 1.1946 low, will depend on the strength of the interim corrective rebound from 1.2661.
USD/CHF Daily Outlook
Daily Pivots: (S1) 0.9934; (P) 0.9952; (R1) 0.9967; More...
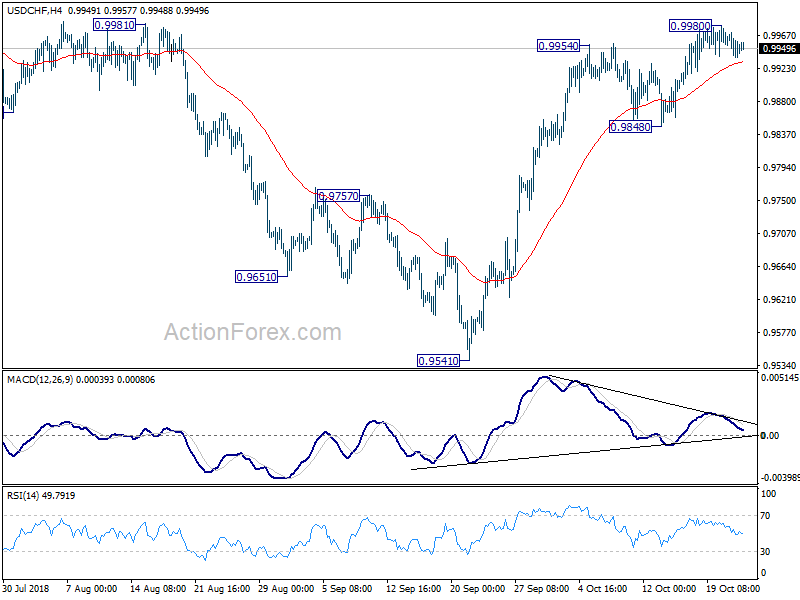
No change in USD/CHF's outlook as it's staying in consolidation below 0.9980 temporary top. Intraday bias remains neutral first. As long as 0.9848 support holds, further rally is expected. on the upside, break of 0.9980 will extend the rally from 0.9541 to 1.0067 key resistance. However, considering bearish divergence condition in 4 hour MACD, break of 0.9848 will indicate reversal and turn outlook bearish.
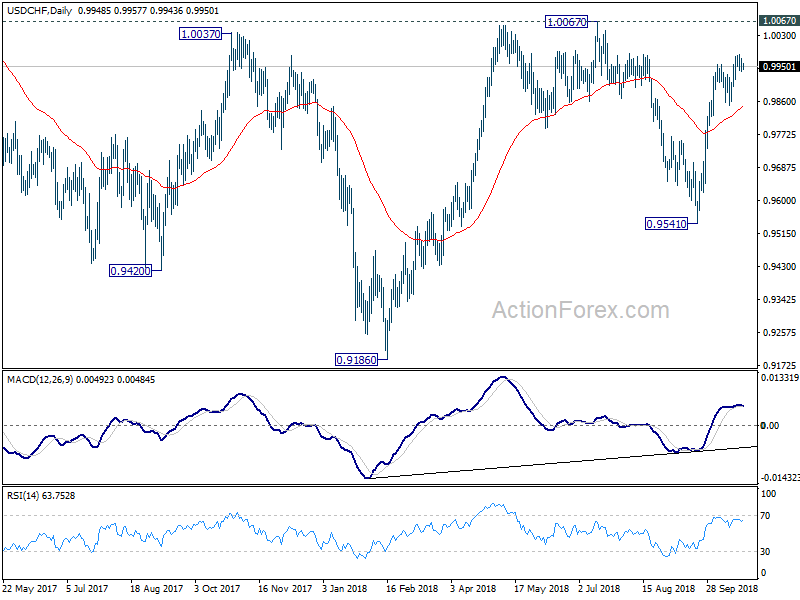
In the bigger picture, the pullback from 1.0067 has completed at 0.9541 already. And rise from 0.9186 is likely resuming. Firm break of 1.0067 will pave the way to retest 1.0342 key resistance. We'd be cautious on strong resistance from there to limit upside to bring another medium term fall to extend long term range trading.
GBP/USD Develops Bearish Wave 3 Or ABCDE Triangle
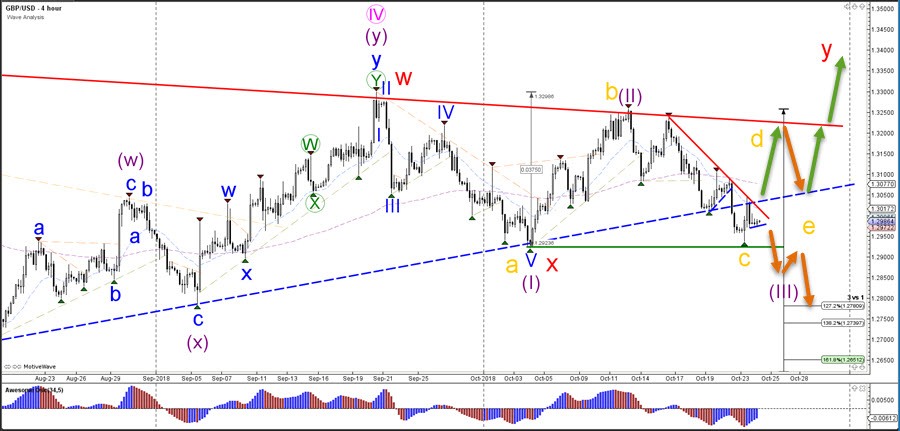
The GBP/USD broke the support trend line (blue) for a bearish breakout but price needs to push below the previous bottom (green) before a wave 3 (purple) has a higher chance of becoming confirmed.
If the GBP/USD fails to break below the previous bottom (green) and manages to rebreak above the broken support line, then price has probably invalidated the wave 3.In that case a bullish ABCDE (gold) triangle pattern is taking place.
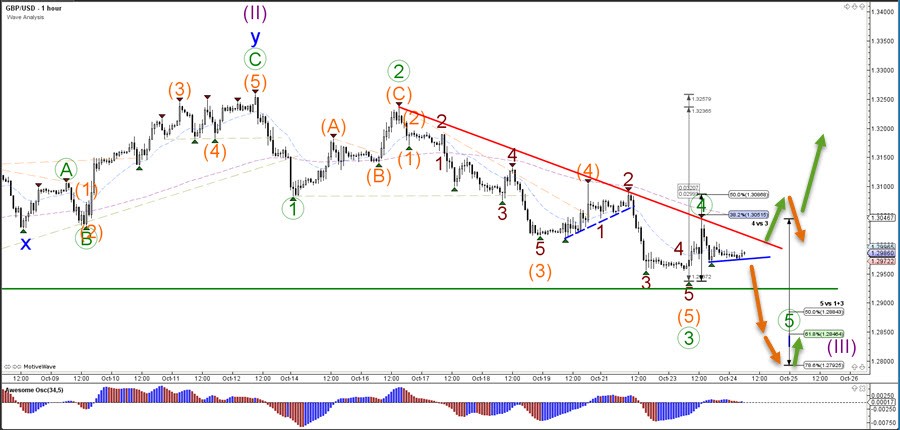
The GBP/USD is in a potential wave 4 (green) as long as price stays below the 50% Fibonacci resistance level. A break above the 50% Fibonacci level could see price move up higher where as a break below support could see price move lower as part of the downtrend.
Euro-Zone’s Consumer Confidence Index Surprisingly Climbed In October
For the 24 hours to 23:00 GMT, the EUR marginally rose against the USD and closed at 1.1470.
On the macro front, the Euro-zone's preliminary consumer confidence index unexpectedly rose to a level of -2.7 in October, confounding market expectations for a fall to a level of -3.2. In the previous month, the index had registered a level of -2.9.
Moreover, in Germany, the producer price index (PPI) jumped 3.2% on an annual basis in September, more than market expectations for an advance of 3.0%. The PPI had recorded a gain of 3.1% in the prior month.
In the US, data showed that US Richmond Fed manufacturing index fell to a level of 15.0 in October, compared to market anticipations for a drop to a level of 24.0. The index had registered a reading of 29.0 in the prior month.
In the Asian session, at GMT0300, the pair is trading at 1.1463, with the EUR trading 0.06% lower against the USD from yesterday's close.
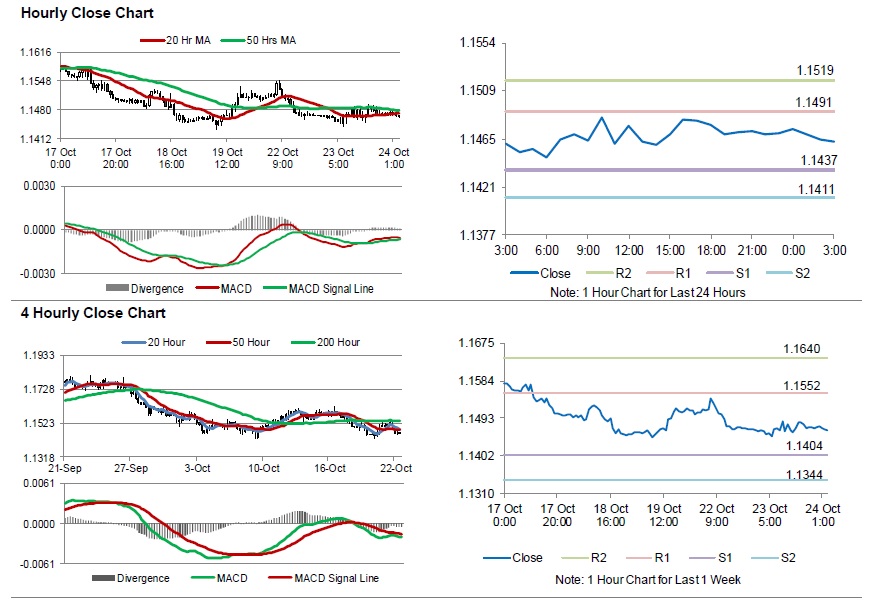
The pair is expected to find support at 1.1437, and a fall through could take it to the next support level of 1.1411. The pair is expected to find its first resistance at 1.1491, and a rise through could take it to the next resistance level of 1.1519.
Moving ahead, traders would closely monitor the Markit manufacturing and services PMIs for October, due to be released in a few hours across the euro bloc. Later in the day, the US MBA mortgage applications followed by the Markit manufacturing and services PMIs for October, the house price index for August and new home sales for September will keep traders on their toes. Additionally, the Federal Reserve's Beige Book release will also attract significant market attention.
The currency pair is trading below its 20 Hr and 50 Hr moving averages.
UK’s Factory Orders Declined At Its Fastest Pace In Three-Years In October
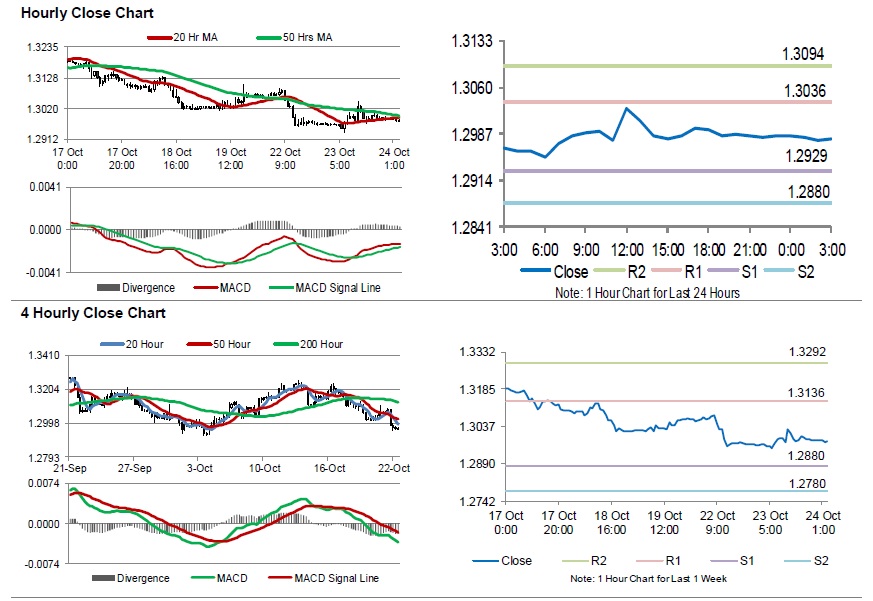
For the 24 hours to 23:00 GMT, the GBP rose 0.12% against the USD and closed at 1.2983.
Data indicated that UK's business optimism climbed 16.0% in 4Q 2018, as compared to a decline of 3.0% in the prior quarter. Market participants had envisaged a fall of 4.0%.
On the other hand, CBI total trends orders unexpectedly eased at its fastest pace in three-years to a level of -6.0 in October, compared to market consensus for an advance to a level of 2.0. In the preceding month, the total trends orders had recorded a level of -1.0.
In the Asian session, at GMT0300, the pair is trading at 1.2979, with the GBP trading slightly lower against the USD from yesterday's close.
The pair is expected to find support at 1.2929, and a fall through could take it to the next support level of 1.2880. The pair is expected to find its first resistance at 1.3036, and a rise through could take it to the next resistance level of 1.3094.
Trading trend in the Sterling today is expected to be determined by the release UK's BBA mortgage applications for September, scheduled to release in a while.
The currency pair is showing convergence with its 20 Hr and 50 Hr moving averages.