Sample Category Title
GOLD Faces Consolidation Threats On Price Halt
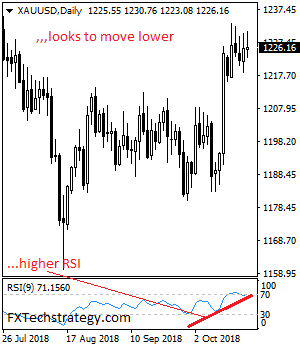
GOLD faces consolidation threats following a price halt on Friday. On the downside, support comes in at the 1,215.00 level where a break will turn attention to the 1,205.00 level. Further down, a cut through here will open the door for a move lower towards the 1,200.00 level. Below here if seen could trigger further downside pressure targeting the 1,100.00 level. On the upside, resistance resides at the 1,230.00 level where a break will aim at the 1,240.00 level. A turn above there will expose the 1,250.00 level. Further out, resistance stands at the 1,260.00 level. All in all, GOLD looks to decline further lower on price halt.
EURUSD Downside Pressure Stalls, Bounces Off 1.1531 Support
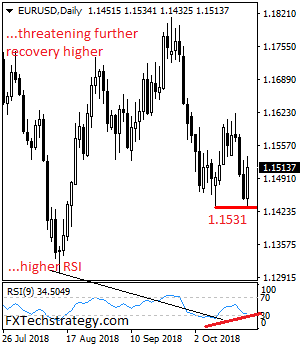
EURUSD downside pressure stalled as it saw a bounce off its key support at 1.1531 to close higher on Friday. While that level holds as support it faces the risk of a move further higher nearer term. On the upside, resistance comes in at 1.1550 level. A break through there opens the door for more upside towards the 1.1600 level. Further up, resistance lies at the 1.1650 level where a break will expose the 1.1700 level. On the downside, support lies at the 1.1450 level where a violation will aim at the 1.1400 level. A break of here will aim at the 1.1350 level. Below here will open the door for more weakness towards the 1.1300. All in all, EURUSD still faces a downside pressure medium term but with recovery threats.
Eco Data 10/22/18
[php_everywhere instance="1"]
Forex Forecast and Cryptocurrencies Forecast
First, a review of last week’s events:
EUR/USD. As expected, the past week was filled with all sorts of events. These included macroeconomic statistics from the USA, data on inflation in Europe, the UK and China, indices of current economic sentiments in Germany and the EU, the meeting of the US Federal Reserve Committee on Open Market, data on China’s GDP and the EU Brexit summit.
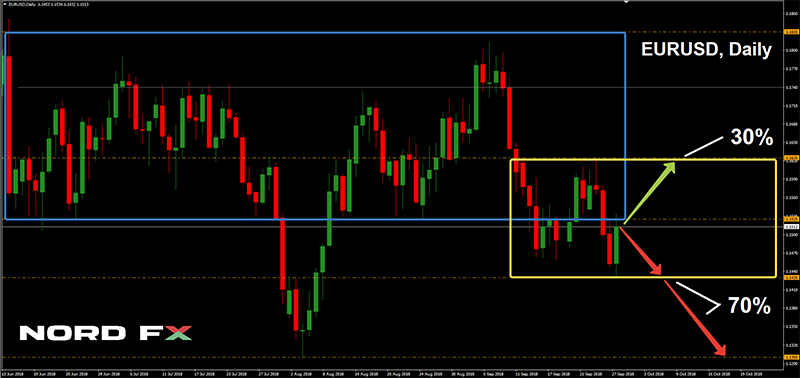
All of these could affect the trends formation. Therefore, our experts considered two main scenarios. The first, "bullish" one, was the growth of the pair, first to the center of the medium-term channel 1.1525-1.1830, and then to its upper border. And the second, the “bearish”, the strengthening of the dollar and its decline to support 1.1430.
So, all these events happened, everything that could have happened, did happen. And what was the result? Well, there was no result. First, the pair implemented half of the “bullish” forecast, having risen to the level of 1.1621, then the “bearish” one, having touched the bottom in the 1.1430 zone, after which it returned to where it had already been two weeks before, as well as in August, in June, and even in May, to the level 1.1513;
GBP/USD. The forecast given by most analysts and confirmed by 80% of the trend indicators and 70% of the oscillators on D1, has come true by 100%. According to the experts, the pair was supposed to reach the height of 1.3225, which it did on Tuesday, October 16.
In the medium term, the initiative should have passed into the hands (or paws) of the bears, who were supposed to have dropped it to the lows of early October in the 1.2920 zone. All this really happened in the second half of the week, the trend turned south, but so far, the pair was able to achieve only support 1.3010, after which a rebound followed, and it ended the session in 1.3065 zone;
USD/JPY. Last week, it was not possible to give any clear recommendations on this pair: 45% of the experts voted for its decline, 20% for its growth, and 35% were for the sideways movement. These 35% turned out to be right: the maximum range of fluctuations of the pair did not exceed 110 points. The result was even more modest: having started from the level of 112.20, the pair finished the week at 112.55. Thus, the dollar managed to win back from the yen only 3 5 points in five days;
Cryptocurrencies. We constantly write that the main factor determining the cryptocurrencies rates is not the economy and not the technical analysis figures, but the news and the rumors. The past week was a clear confirmation of this.
On the morning of Monday, October 15, most bitcoin owners jumped out of their beds, shouting "Hallelujah!" it started finally: the rate of this reference currency on some exchanges soared from the mark of $6,380 to $7,700 in just a couple of hours, that is, more than 20%!
This news was caused by problems with the Tether (USDT) cryptocurrency. Ordinary traders began to urgently sell off the stablecoin, buy up the bitcoin, as a result of which, the BTC/USD rate literally rushed into space.
But the happiness didn't last long. It became clear soon that all this was just a provocation, after which a no less sharp collapse followed, and the rate returned to the usual values of the past month and a half. As a result, the authors of these fake news earned good money, and those who bought into this fake, lost a lot. Those whose Stop Loss or Margin Call worked as a result of the jump are also sad.
We did not know what could happen on Monday October 15. But the forecast that the bitcoin, pushing off from the lowest point of its amplitude, should return to $6,325-6,835, turned out to be absolutely correct: the BTC/USD met Saturday at $6.535.
The bitcoin fate was repeated by the rest of the top cryptocurrencies: many, like, for example, the ripple (XRP/USD) and the ethereum (ETH/USD), ended the week with a slight increase, other, like the litecoin (LTH/USD), finished with the nil result.
As for the forecast for the coming week, summarizing the opinions of a number of analysts, as well as forecasts made on the basis of a variety of methods of technical and graphical analysis, we can say the following:
EUR/USD. Although some analysts talk about five, and even about ten key events of the coming week, in our opinion, it is not worth focusing on the economic calendar in this case, and it will not bring any special surprises for traders. Therefore, it may be worthwhile to pay more attention to longer-term forecasts and technical analysis.
Giving a forecast for the EUR/USD pair, most experts (70%) assess the outlook for the dollar positively. In their opinion, the goals of the pair are still the support levels of 1.1430 and 1.1300. About 70% of trend indicators and oscillators on H4 and more than 80% on D1 agree with this scenario.
The remaining experts, supported by graphical analysis on H4, believe that the pair has just moved one level down, and now the lower limit of the medium-term corridor 1.1525-1.1830 has become a Pivot Point for the new side channel 1.1430-1.1625, in which the pair will move for some time;
GBP/USD. Negotiations on Brexit reached another deadlock last week. It became clear that it will not be possible to complete the deal between London and Brussels by mid-November. Against this background, more than 90% of the experts, supported by the absolute majority of indicators, expect the British pound to go further down. The closest support is 1.3010, the goal is 1.2900. The nearest resistance is at 1.3100-1.3130, the following is much higher, at 1.3215;
USD/JPY. If for the pair GBP/USD the experts expect the dollar to strengthen, the picture for the USD/JPY is reversed: in their opinion, the Japanese yen should strengthen. Both 65% of analysts, graphical analysis, and oscillators on D 1 agree with this. The goals are 112.00, 111.65 and 110.70.
An alternative point of view is presented by 35% of analysts and 70% of indicators on H4. The resistance levels 112.75 and 113.50;
Cryptocurrencies. It is clear that we, similar to most analysts, cannot predict the stuffing of the next fake news. However, there circulate sustained rumors that the Wall Street is preparing a second wave of invasion to the crypto market. One of the largest holding companies Fidelity Investments, Goldman Sachs, as well as other investment banks can become a “shock force”. However, these are all hopes of the blockchain apologists.
At the moment, the market is in a state of consolidation, and therefore we can only repeat the previous forecast with minor adjustments: the movement of the pair BTC/USD in the range $6,325-$6,900. At the same time, major players may still attempt to bring down the rate to the level of mining profitability in the region of $6,100, where they are beginning to actively buy coins.
A provocation similar to the one that happened on October 15, is unlikely in the near future.
EUR/USD Weekly Outlook
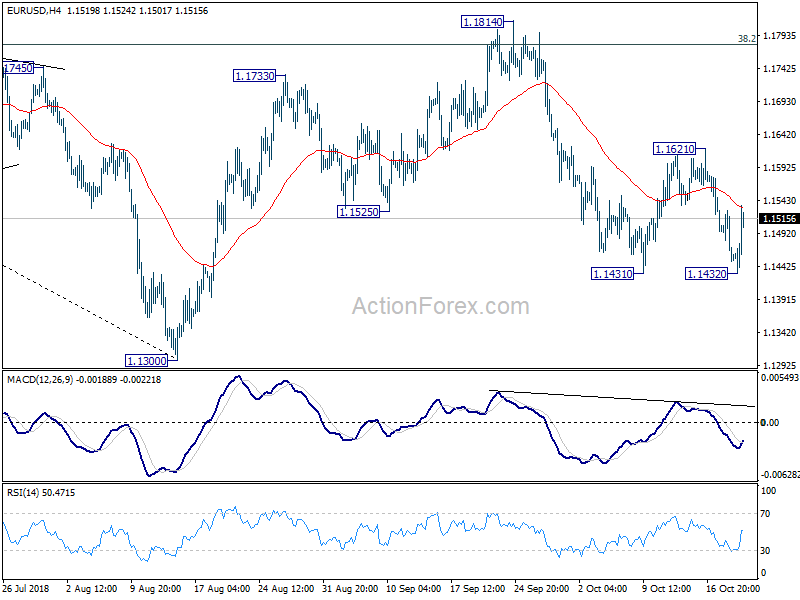
Despite dipping to 1.1432, EUR/USD drew support from 1.1431 low and recovered. The development suggests that consolidation from 1.1431 is extending with another leg. Initial bias is neutral this week first. Near term outlook will remain mildly bearish as long as 1.1621 resistance holds. Below 1.1431 will resume the fall form 1.1814 to retest 1.1300 low. Nonetheless, break of 1.1621 will turn focus back to 1.1814 instead.
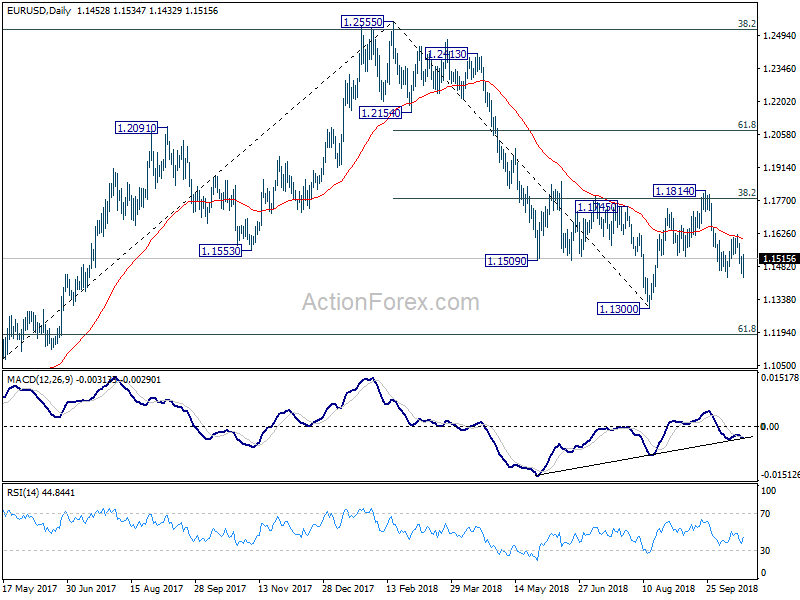
In the bigger picture, corrective pattern from 1.1300 could have completed at 1.1814 after hitting 38.2% retracement of 1.2555 to 1.1300 at 1.1779. Decisive break of 1.1300 will resume the down trend from 1.2555 to 61.8% retracement of 1.0339 (2017 low) to 1.2555 at 1.1186 next. Sustained break there will pave the way to retest 1.0339. On the upside, break of 1.1814 will delay the bearish case and extend the correction from 1.1300 with another rise before completion.
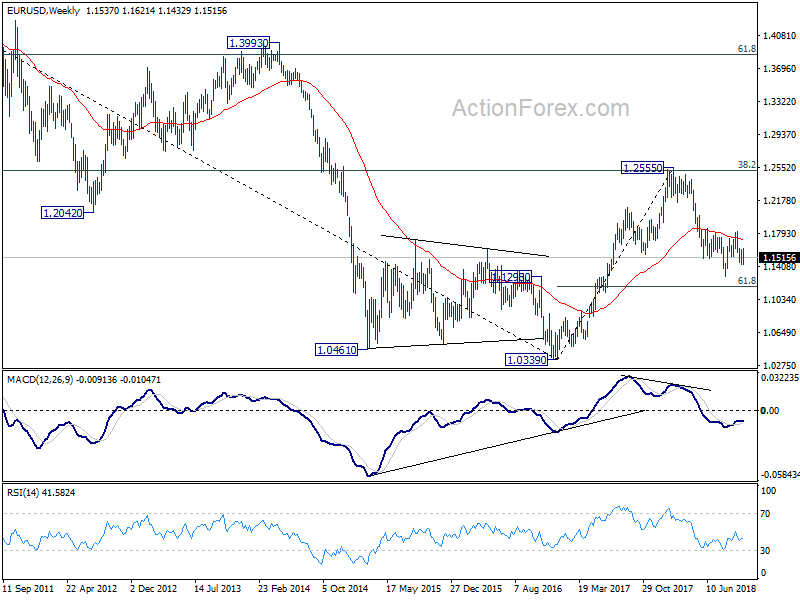
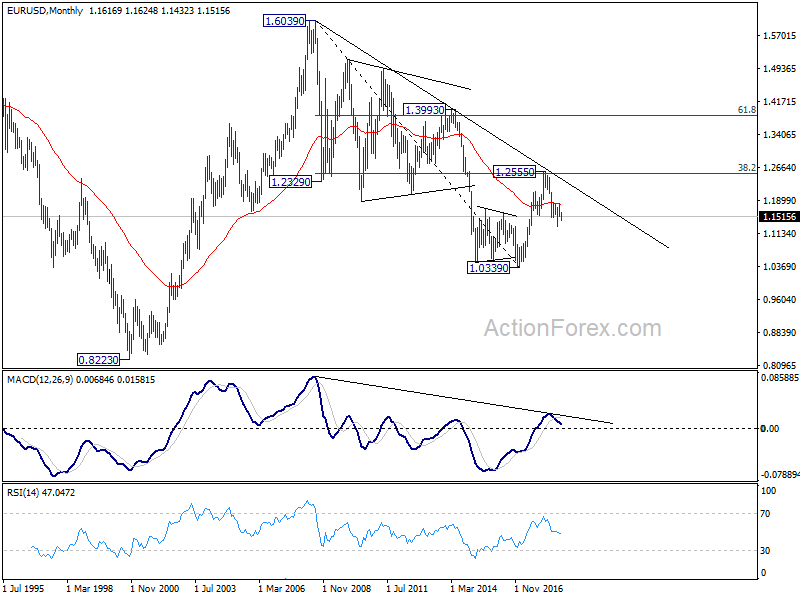
In the long term picture, the rejection from 38.2% retracement of 1.6039 to 1.0339 at 1.2516 argues that long term down trend from 1.6039 (2008 high) might not be over yet. EUR/USD is also held below decade long trend line resistance. Firm break of 61.8% retracement of 1.0339 to 1.2555 at 1.1186 should at least bring a retest on 1.0339 low.
USD/JPY Weekly Outlook
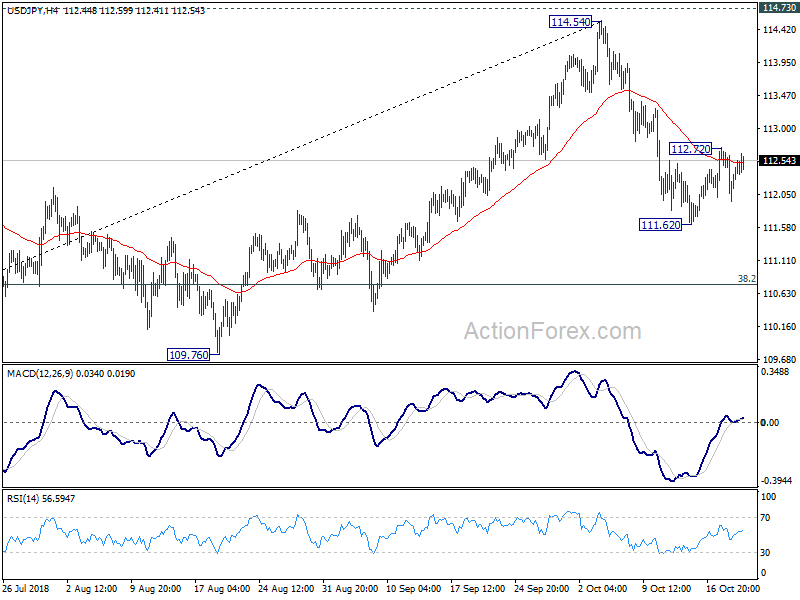
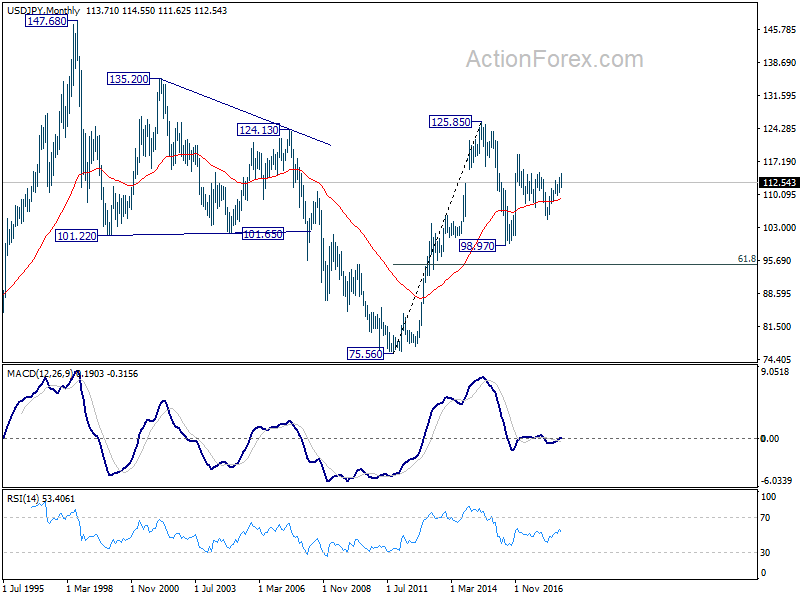
USD/JPY edged lower to 111.62 last week, formed a short term bottom there and recovered. Initial bias is neutral this week first but further rebound is mildly in favor. ON the upside, above 112.71 turn bias to the upside for 114.54 high. On the downside, below 111.62 will resume the correction from 114.54 to 38.2% retracement of 104.62 to 114.54 at 110.75. We'll look for bottoming signal above 109.76 key support in that case.
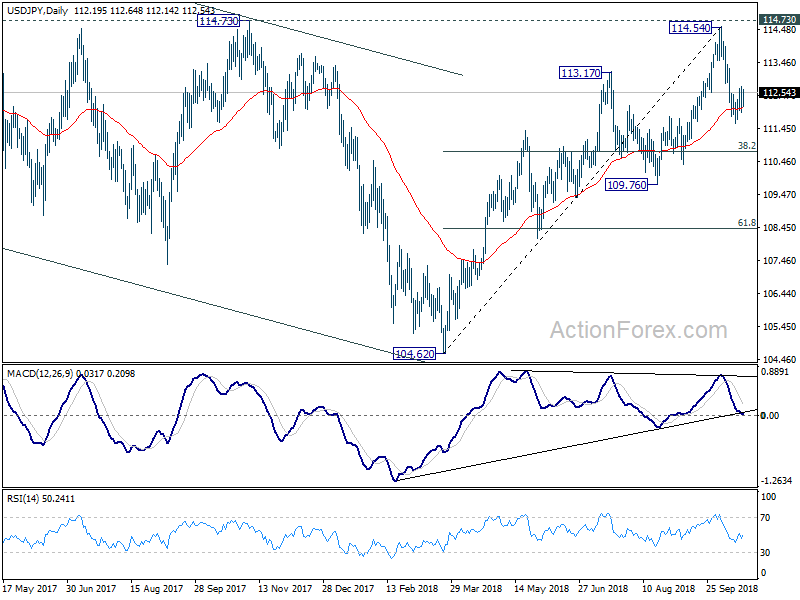
In the bigger picture, corrective fall from 118.65 (2016 high) should have completed with three waves down to 104.62. Decisive break of 114.73 resistance will likely resume whole rally from 98.97 (2016 low) to 100% projection of 98.97 to 118.65 from 104.62 at 124.30, which is reasonably close to 125.85 (2015 high). This will stay as the preferred case as long as 109.76 support holds. However, decisive break of 109.76 will dampen this bullish view and turns outlook mixed again.
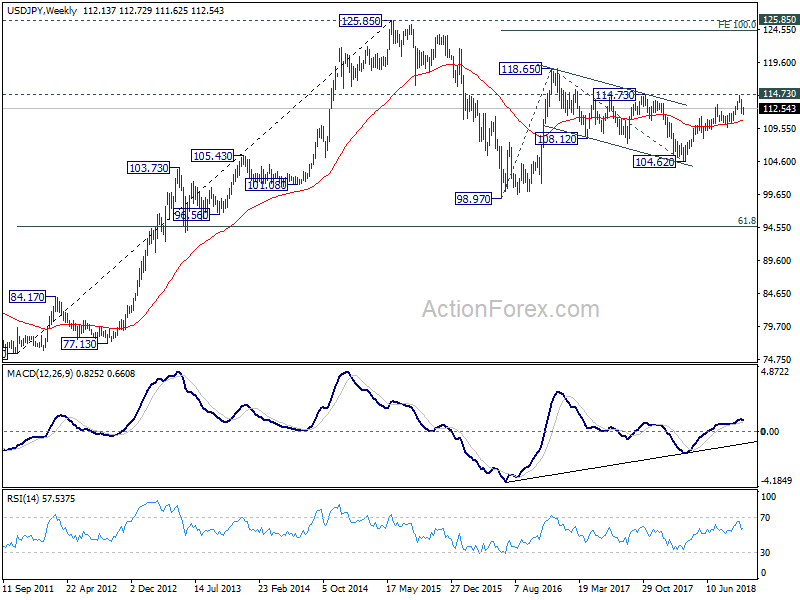
In the long term picture, the rise from 75.56 (2011 low) long term bottom to 125.85 top is viewed as an impulsive move, no change in this view. Price actions from 125.85 are seen as a corrective move which could still extend. In case of deeper fall, downside should be contained by 61.8% retracement of 75.56 to 125.85 at 94.77. Up trend from 75.56 is expected to resume at a later stage for above 135.20/147.68 resistance zone.
GBP/USD Weekly Outlook
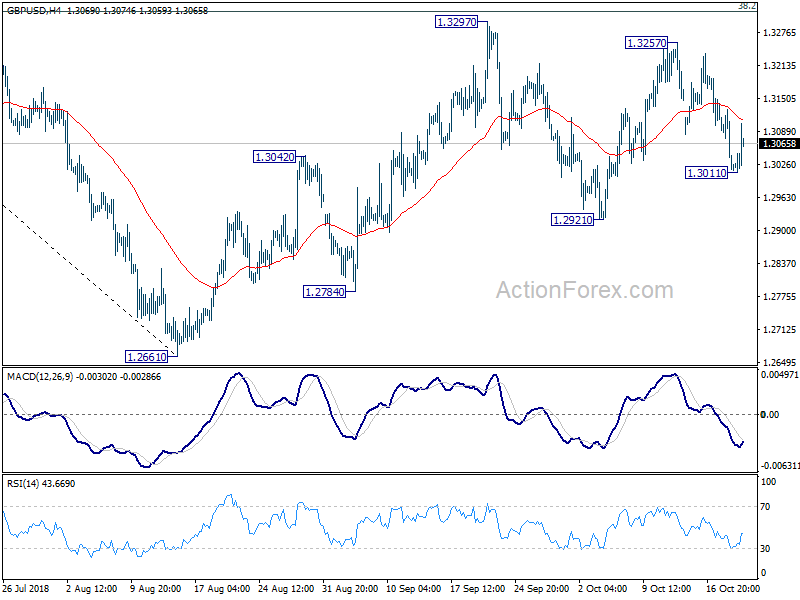
GBP/USD dipped to 1.3011 last week but quickly recovered. Initial bias is turned neutral this week first and overall outlook is unchanged. Price actions from 1.2661 are seen as a corrective move. In case of another rise, upside should be limited by 1.3316 key fibonacci level to bring down trend resumption eventually. On the downside, below 1.3011 will target 1.2921 support first. Break will target 1.2661/2784 support zone. However, sustained break of 1.3316 would pave the way to next fibonacci level at 1.3721.
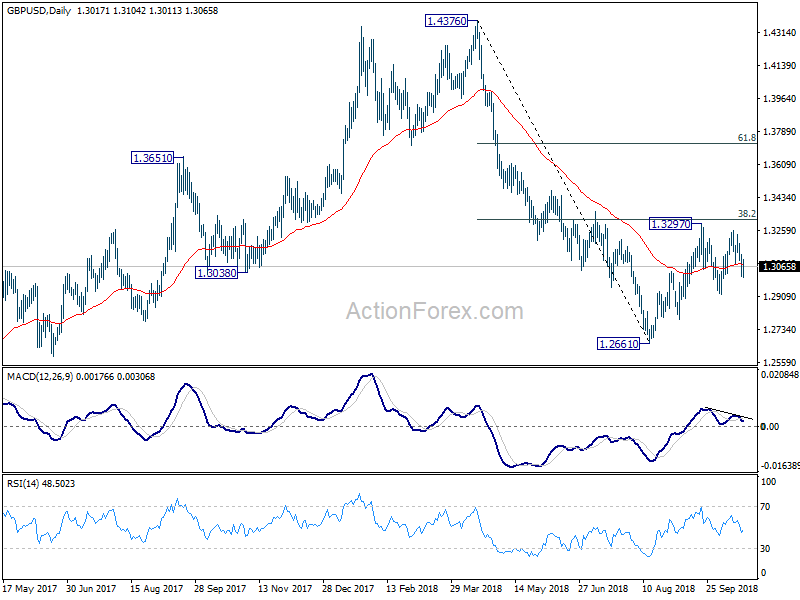
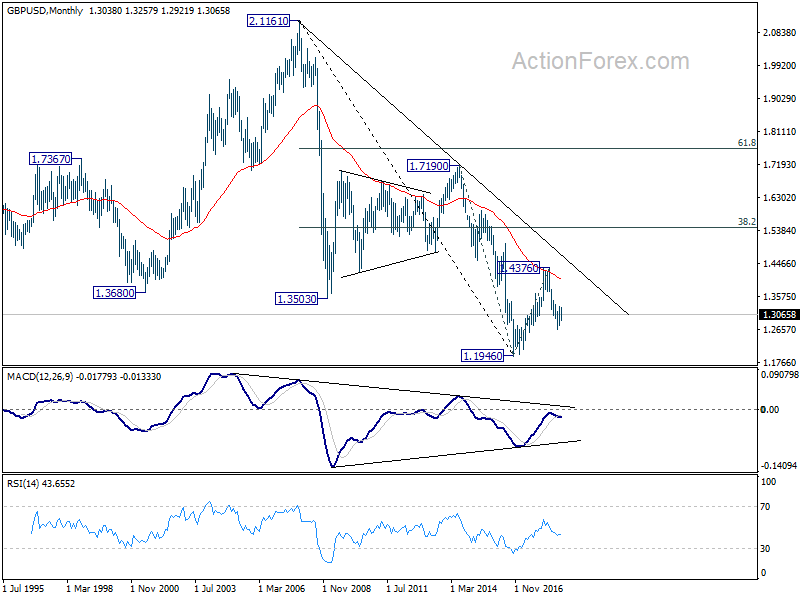
In the bigger picture, whole medium term rebound from 1.1946 (2016 low) should have completed at 1.4376 already, after rejection from 55 month EMA. The structure and momentum of the fall from 1.4376 argues that it's resuming long term down trend. And this will be the preferred case as long as 38.2% retracement of 1.4376 to 1.2661 at 1.3316 holds. However, firm break of 1.3316 would bring stronger rebound to 61.8% retracement at 1.3721. And, the eventual depth of the fall from 1.4376, and the chance of hitting 1.1946 low, will depend on the strength of the interim corrective rebound from 1.2661.
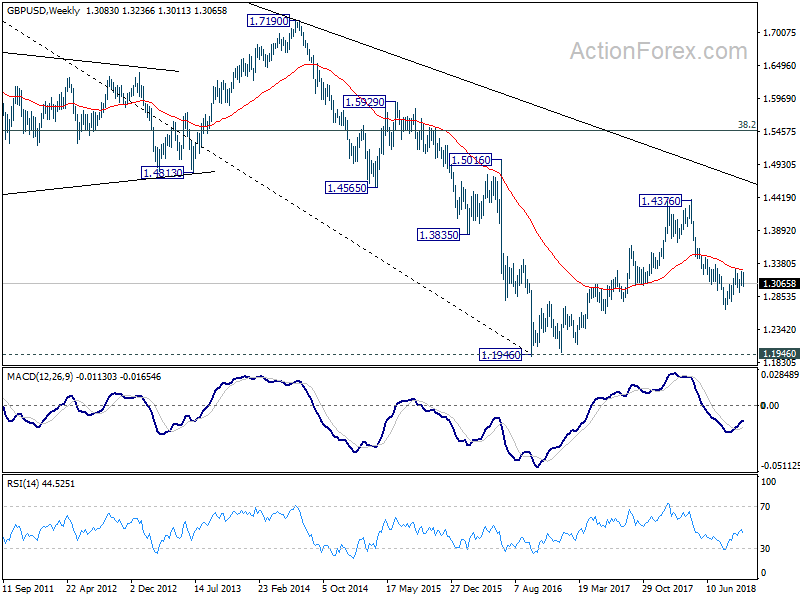
In the longer term picture, outlook in GBP/USD is held bearish. Rebound from 1.1946 was rejected solidly by falling 55 month EMA. The pair was limited well below 38.2% retracement of 2.1161 (2007 high) to 1.1946, as well as the decade long falling trend line. On break of 1.1946, next target will be 61.8% projection of 1.7190 to 1.1946 from 1.4376 at 1.1135.
USD/CHF Weekly Outlook
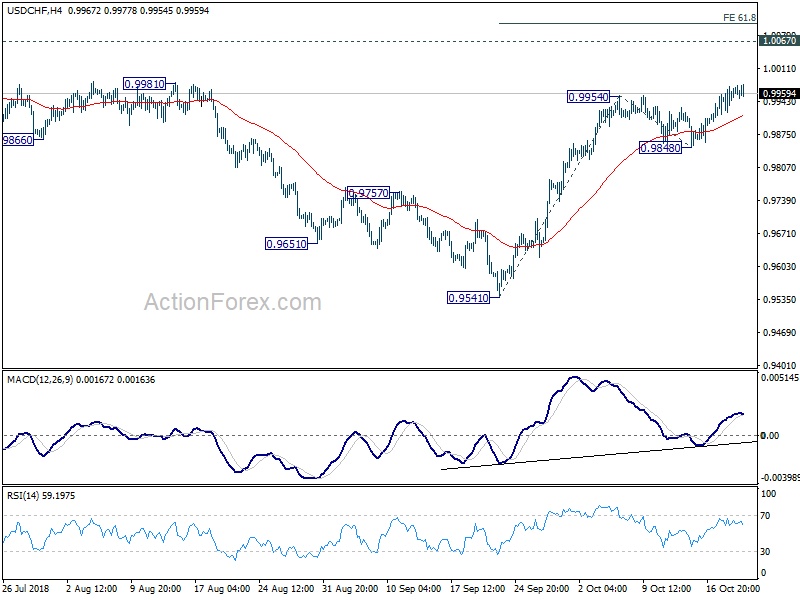
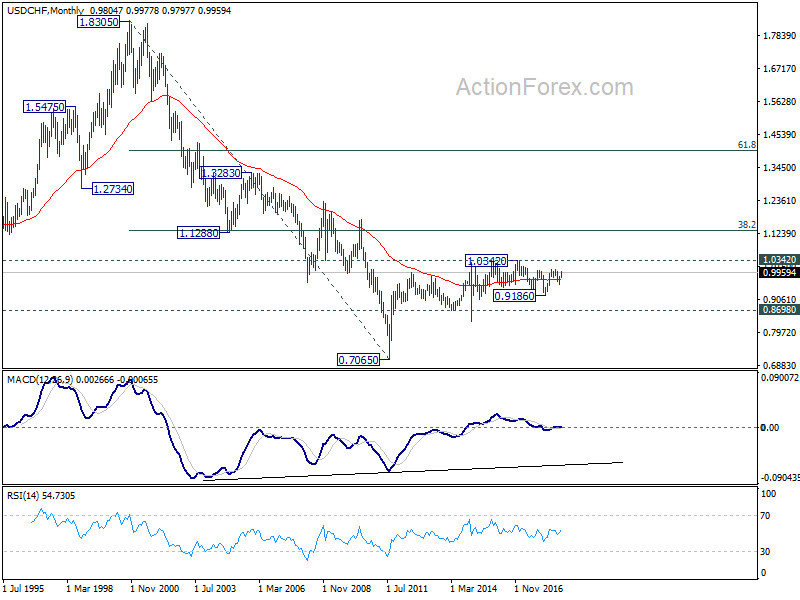
USD/CHF's rise from 0.9541 resumed last week and edged higher to 0.9977. Initial bias stays on the upside this week for 1.0067 key resistance and then 61.8% projection of 0.9541 to 0.9954 from 0.9848 at 1.0103. On the downside, break of 0.9848 support is needed to indicate short term topping. Otherwise, further rally will be expected even in case of retreat.
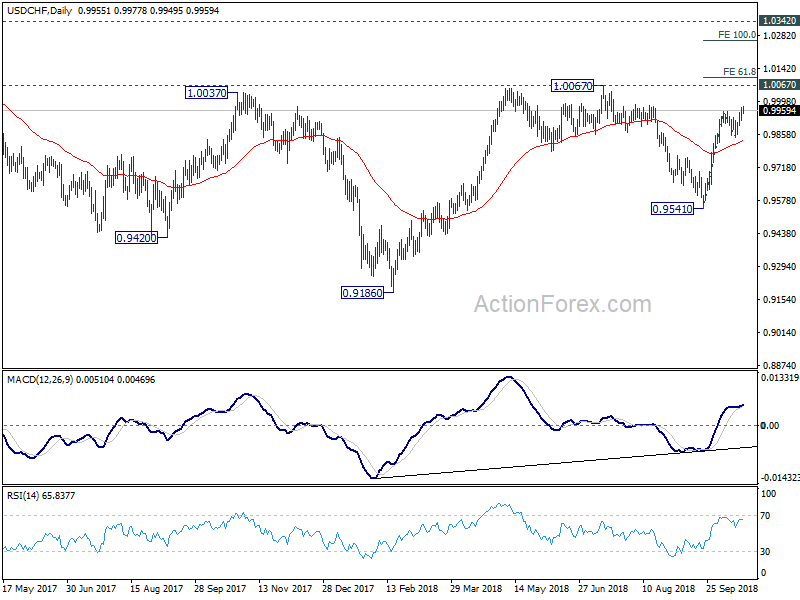
In the bigger picture, the pullback from 1.0067 has completed at 0.9541 already. And rise from 0.9186 is likely resuming. Firm break of 1.0067 will pave the way to retest 1.0342 key resistance. We'd be cautious on strong resistance from there to limit upside to bring another medium term fall to extend long term range trading.
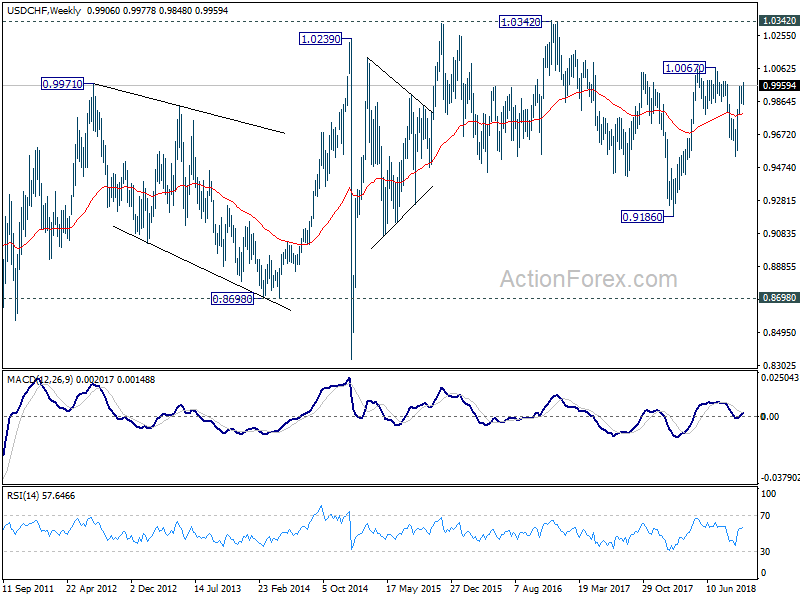
In the long term picture, price actions from 0.7065 (2011 low) are not clearly impulsive yet. Thus, we'll treat it as developing into a corrective pattern, at least, until a firm break of 1.0342 resistance.
AUD/USD Weekly Outlook
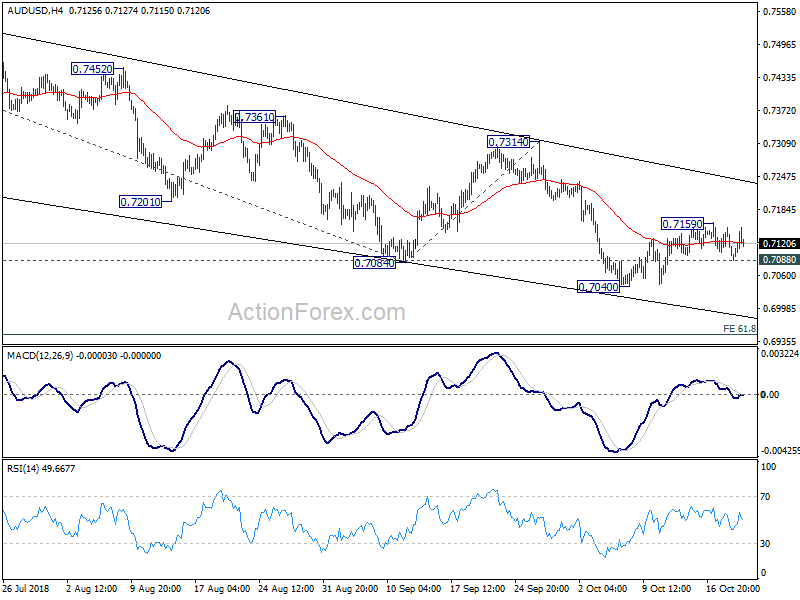
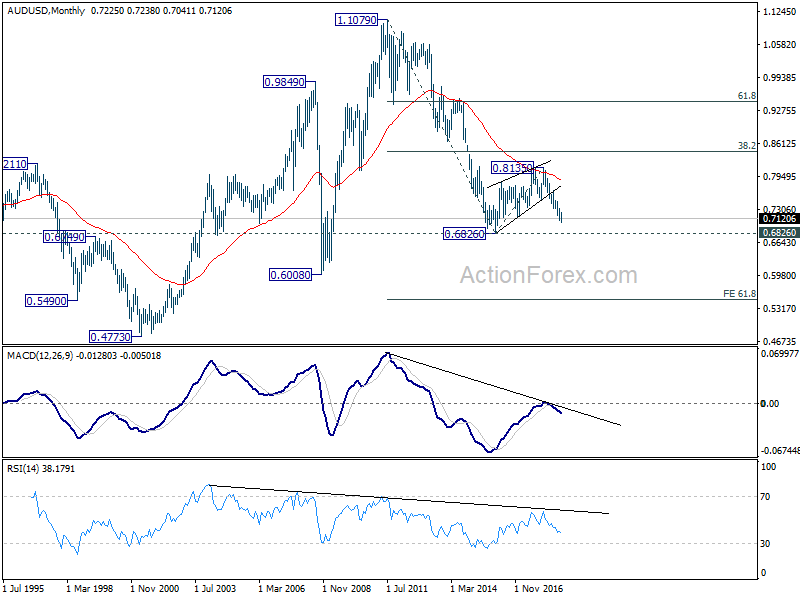
AUD/USD's consolidation from 0.7040 extended last week. While there was a dip to 0.7088 after hitting 0.7159, the pair quickly recovered on lack of follow through selling. Initial bias is neutral this week first. Above 0.7159 will extend the correction. But upside should be limited well below 0.7314 resistance to bring fall resumption. On the downside, break of 0.7088 minor support will bring retest of 0.7040 low first. Decisive break there will resume recent down trend to 61.8% projection of 0.7676 to 0.7084 from 0.7314 at 0.6948 next.
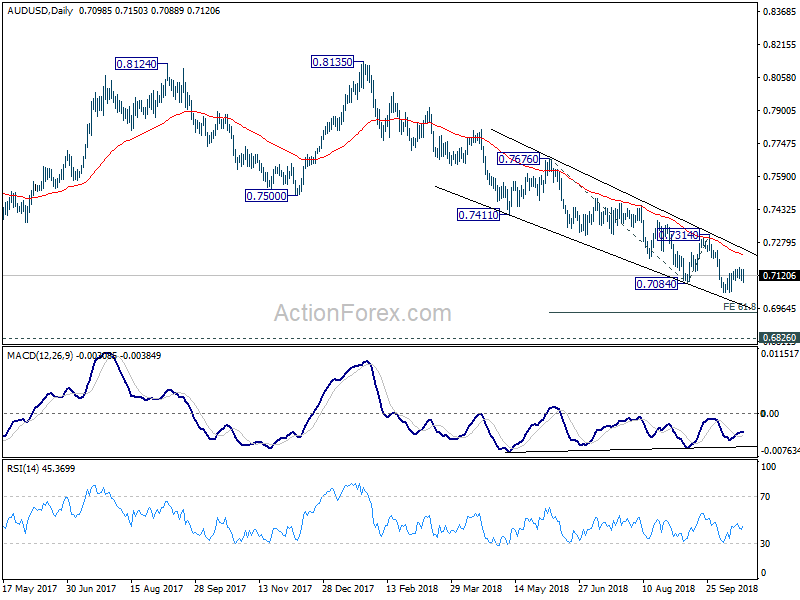
In the bigger picture, fall from 0.8135 is tentatively treated as resuming long term down trend from 1.1079 (2011 high). Decisive break of 0.6826 will target 0.6008 key support next (2008 low). However, break of 0.7500 support turned resistance will argue that the corrective pattern from 0.6826 is going to extend with another rising leg before completion.
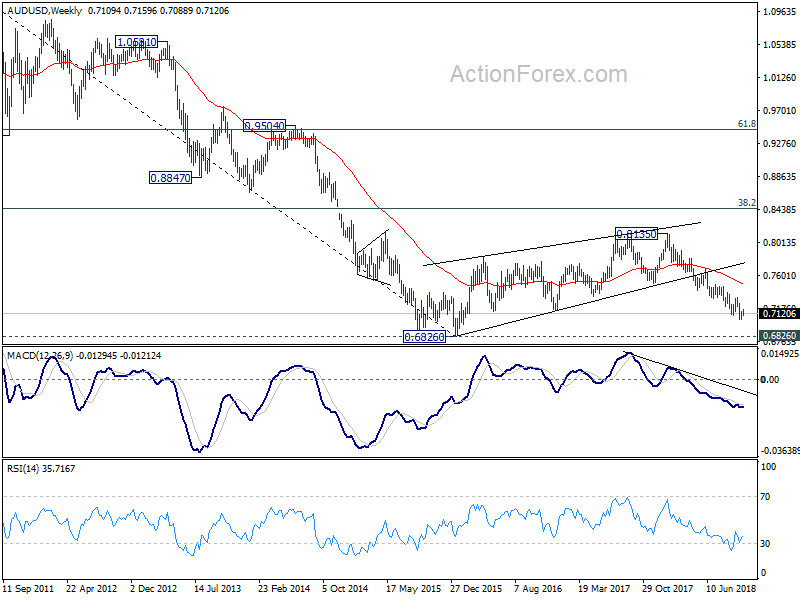
In the longer term picture, the corrective structure of rebound from 0.6826 (2016 low) to 0.8135, and the failure to break 38.2% retracement of 1.1079 (2011 high) to 0.6826 at 0.8451, carry bearish implications. AUD/USD was also rejected by 55 month EMA. Now, the down trend from 1.1079 is in favor to extend. On break of 0.6826, next target will be 61.8% projection of 1.1079 to 0.6826 from 0.8135 at 0.5507.
USD/CAD Weekly Outlook
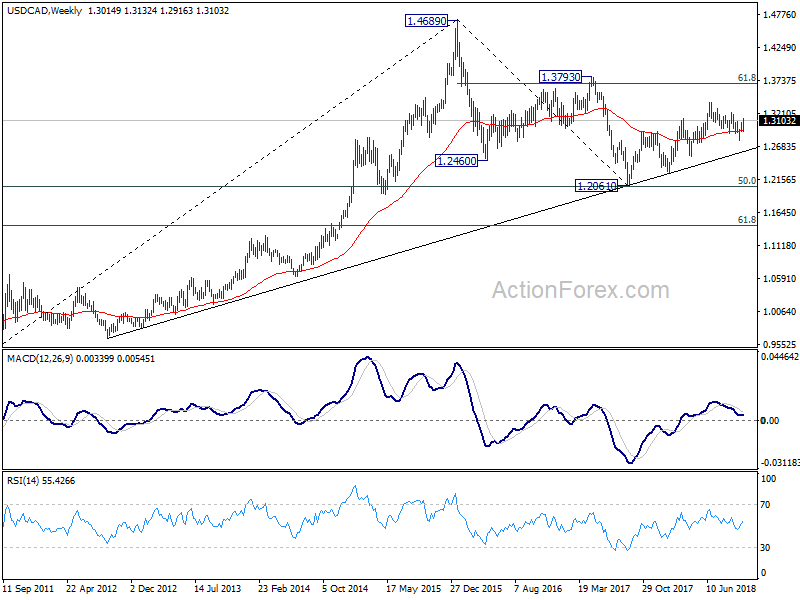
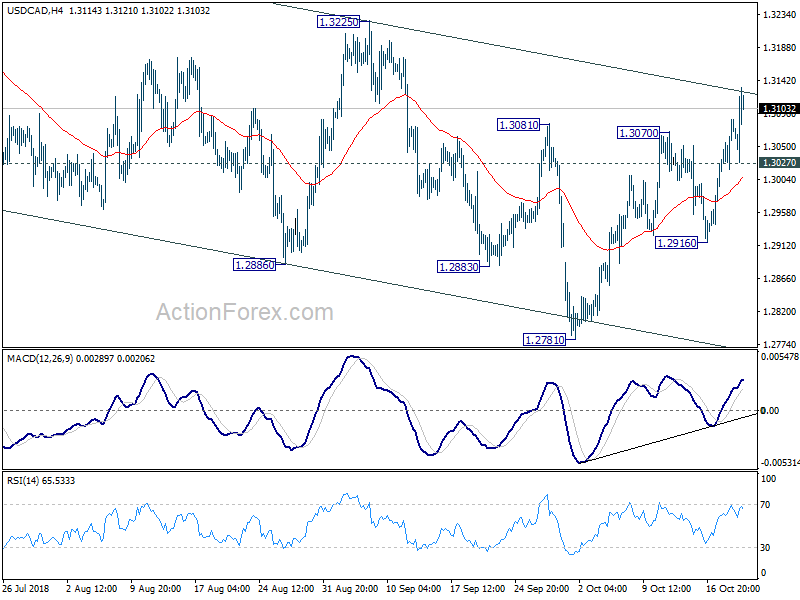
USD/CAD's rebound from 1.2781 extended to as high as 1.3132 last week. The break of 1.3081 minor resistance argues that whole choppy fall from 1.3385 has completed at 1.2781. Initial bias stays on the upside this week for 1.3225 first. Break will confirm this bullish case and target 1.3385 high next. On the downside, below 1.3027 minor support will turn intraday bias neutral first. But as long as 1.2916 support holds, further rally will remain mildly in favor in case of retreat.
In the bigger picture, current development argues that choppy corrective fall from 1.3385 has completed at 1.2781 already. And that in turns suggests that the up trend from 1.2061 is still in progress. Decisive break of 1.3385 will pave the way to 61.8% retracement of 1.4689 to 1.2061 at 1.3685. On the downside, though, break of 1.2916 support will likely extend the fall from 1.3385 to 61.8% retracement of 1.2061 to 1.3385 at 1.2567 before completion.
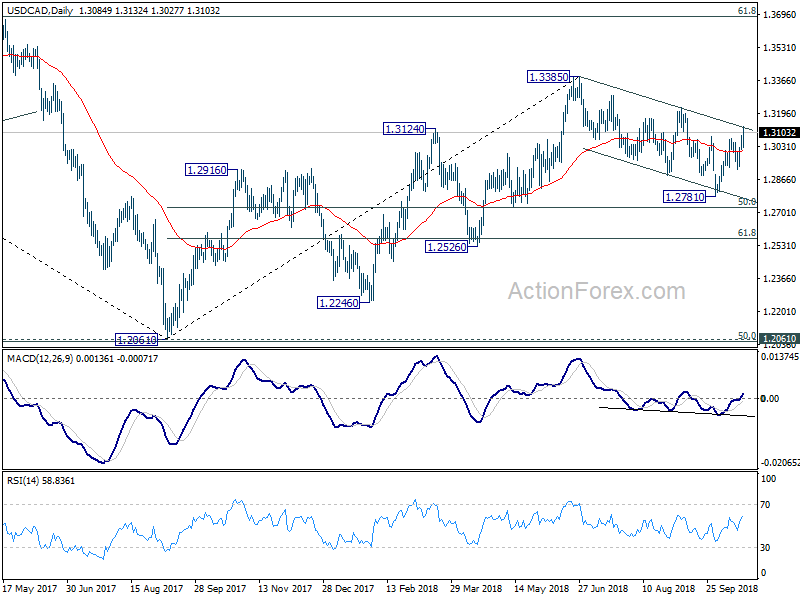
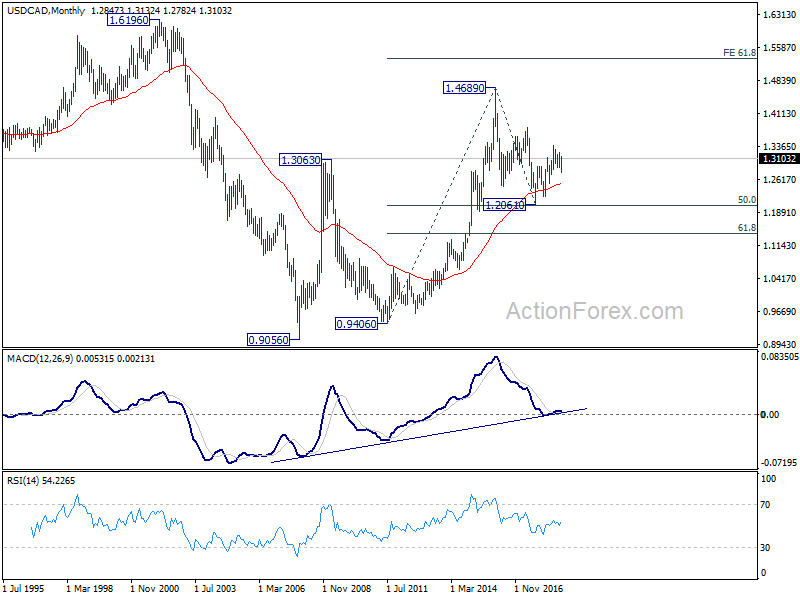
In the longer term picture, corrective fall from 1.4689 (2015 high) should have completed with three waves down to 1.2061, just ahead of 50% retracement of 0.9406 (2011 low) to 1.4689 (2015 high) at 1.2048. The development keeps long term up trend from 0.9406 and that from 0.9056 (2007 low) intact. For now, there is prospect of extending the long term up trend to 61.8% projection of 0.9406 to 1.4689 from 1.2061 at 1.5326 in medium to long term.