Sample Category Title
EUR/JPY Weekly Outlook
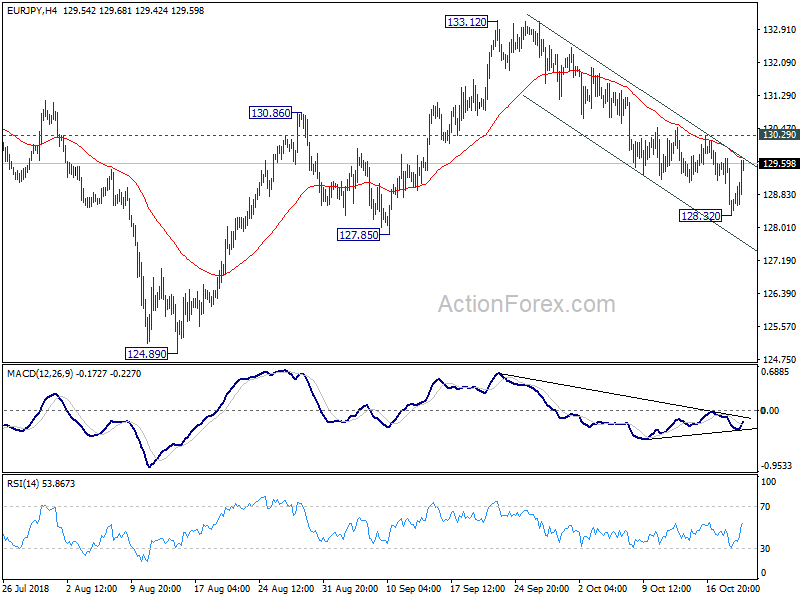
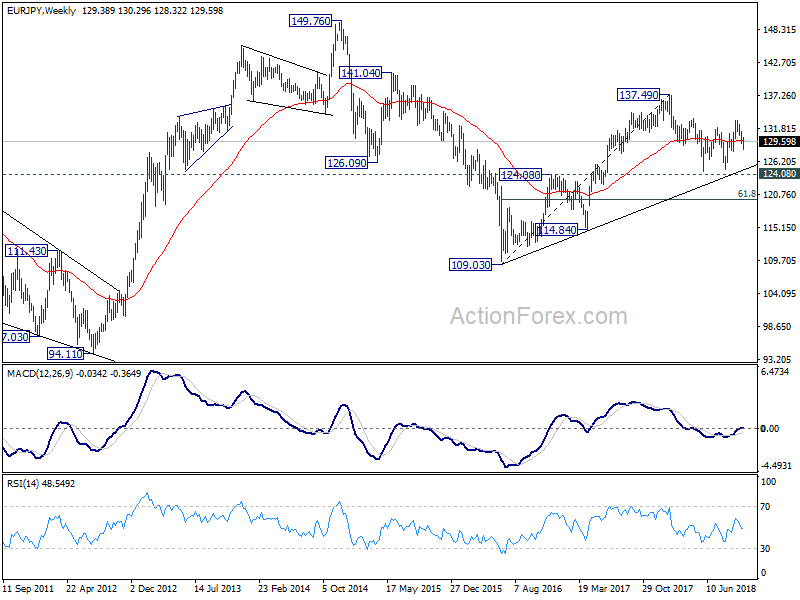
EUR/JPY's decline form 133.12 extended to as low as 128.32 last week but recovered. Initial bias is neutral this week first. Another fall is in favor as long as 130.29 minor resistance holds. Below 128.32 will target 127.85 support first. Break will confirm completion of rebound from 124.89 at 133.12 and bring retest of this low. However, considering bullish convergence condition in 4 hour MACD, break of 130.29 will in turn suggest completion of fall from 133.12. In this case, intraday bias will be turned back to the upside for retesting 133.12 high.
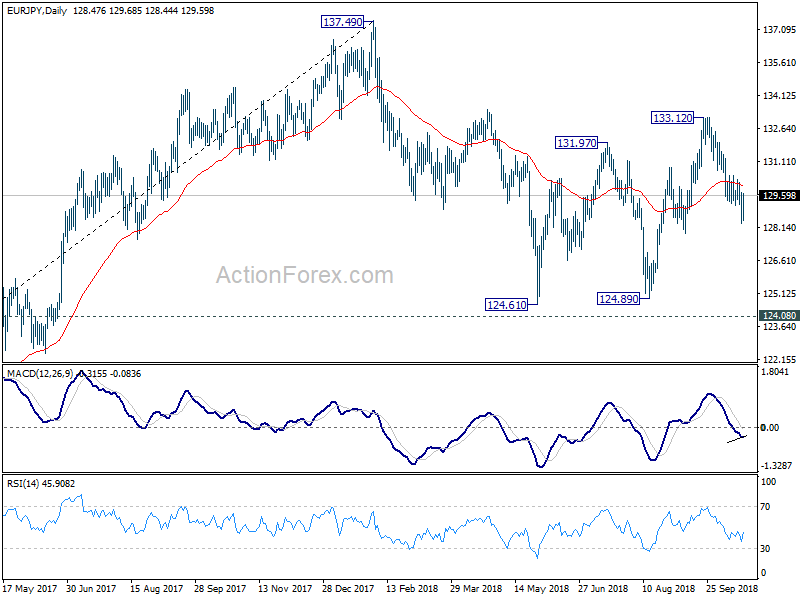
In the bigger picture, current development suggests that EUR/JPY could have defended key support level of 124.08 key resistance turned support. And, the larger up trend from 109.03 (2016 low) is still in progress. Firm break of 137.49 structural resistance will target 141.04/149.76 resistance zone next. This will be the preferred case as long as 127.85 near term support holds. However, break of 127.85 will turn focus back to 124.08 key support level.
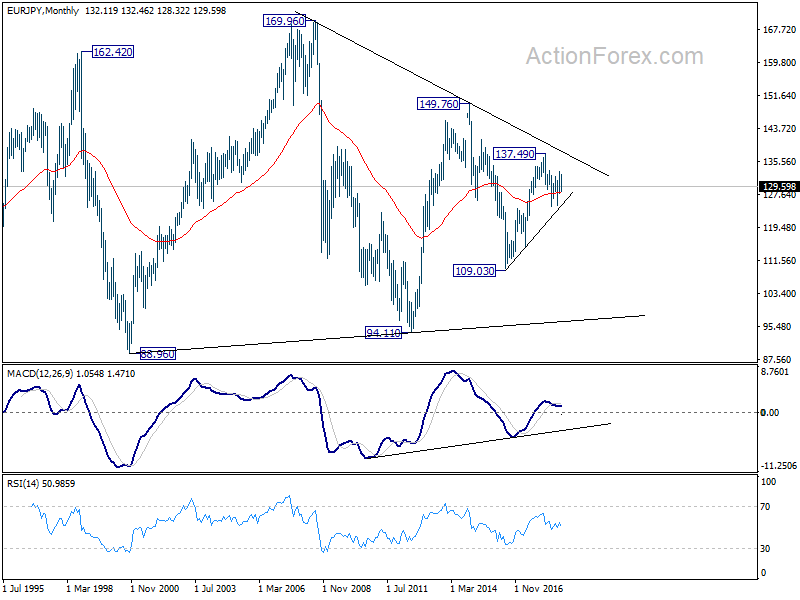
In the long term picture, at this point, EUR/JPY is staying in long term sideway pattern, established since 2000. Rise from 109.03 is seen as a leg inside the pattern. As long as 124.08 support holds, further rally is in favor in medium to long term through 149.76 high. However, break of 124.08 could extend the fall through 109.03 low instead.
EUR/GBP Weekly Outlook
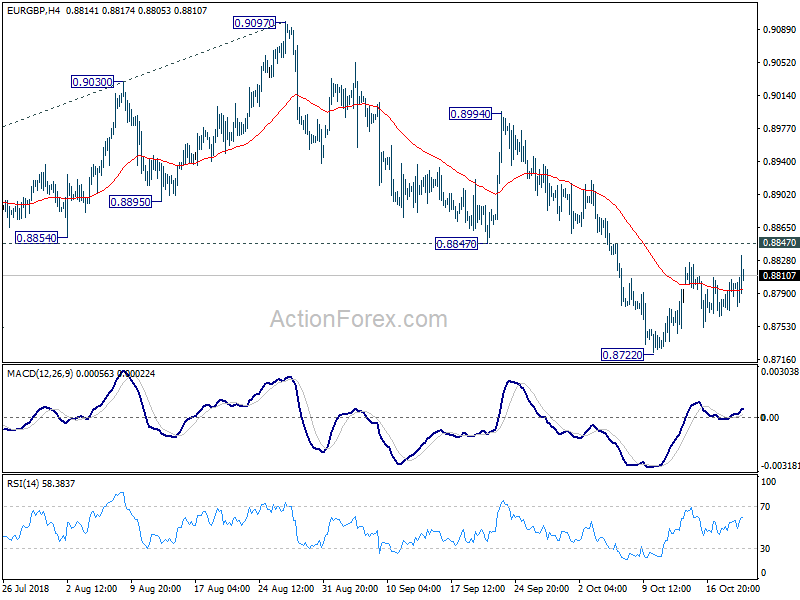
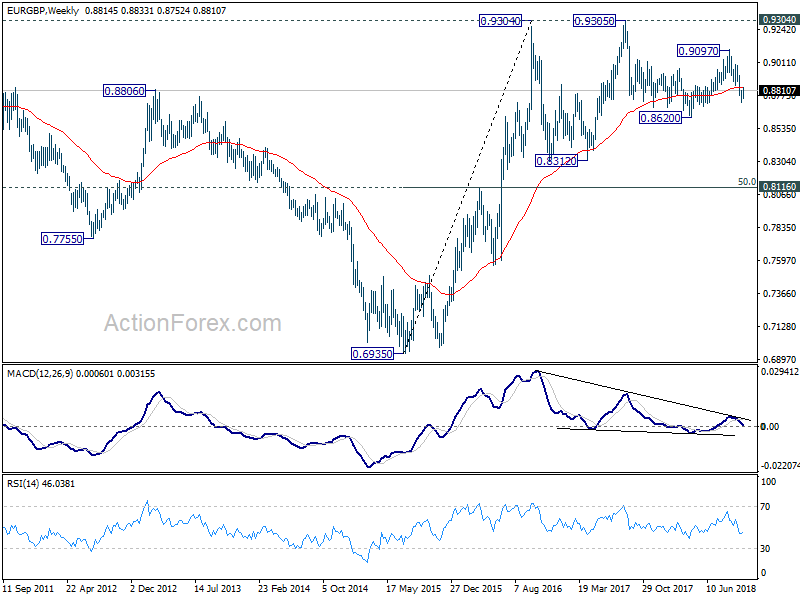
EUR/GBP stayed in consolidation above 0.8722 last week and outlook is unchanged. Initial bias stays neutral this week first. Upside of recovery should be limited by 0.8847 resistance to bring fall resumption. On the downside, break of 0.8772 will target 0.8620 low first. Decisive break there will resume whole down trend from 0.9304. In that case, next target will be 100% projection of 0.9305 to 0.8620 from 0.9097 at 0.8412. However, firm break of 0.8847 will indicate near term reversal and target 0.8994 resistance instead.
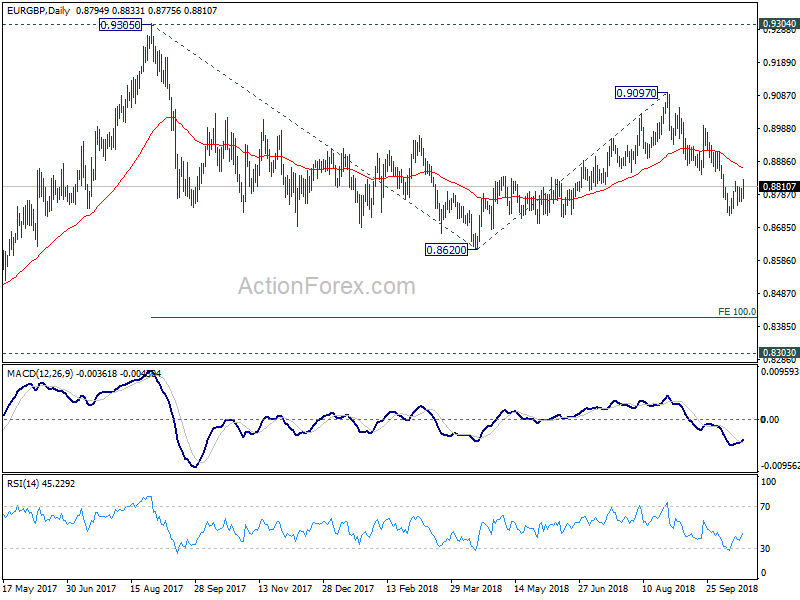
In the bigger picture, EUR/GBP is seen as staying in long term range pattern started at 0.9304 (2016 high). Current development suggests that fall from 0.9303, as a down leg in the pattern, is still in progress. But in case of deeper fall, downside should be contained by 0.8116 cluster support, 50% retracement of 0.6935 (2015 low) to 0.9304 at 0.8120, to bring rebound. On the upside, break of 0.9097 will target 0.9304 resistance instead.
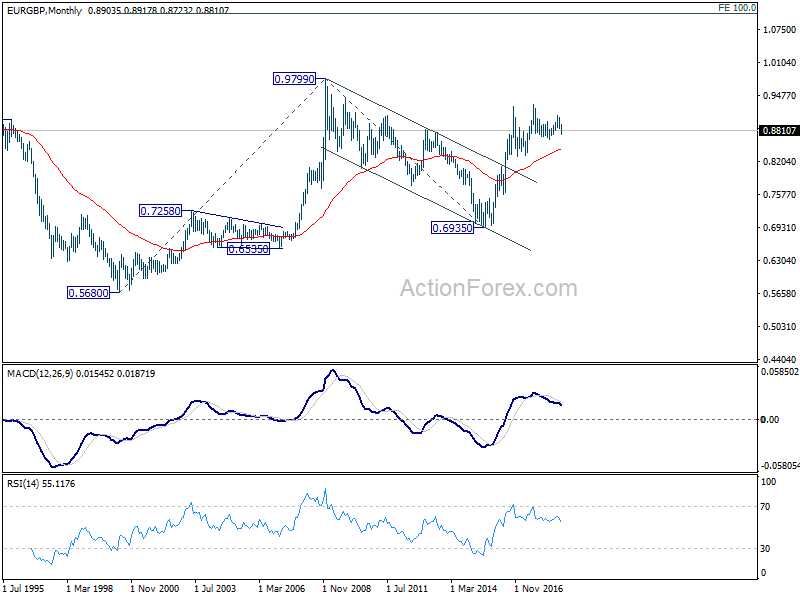
In the long term picture, we're holding on to the view that rise from 0.6935 (2015 low) is resuming the up trend from 0.5680 (2000 low). Hence, after the consolidation from 0.9304 completes, we'd expect another medium term up trend through 0.9799 to 100% projection of 0.5680 to 0.9799 from 0.6935 at 1.1054.
EUR/AUD Weekly Outlook
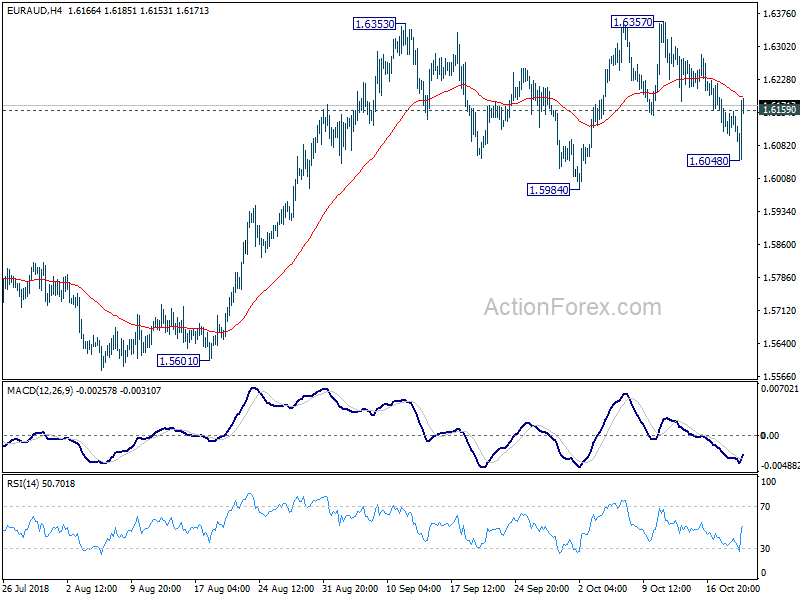
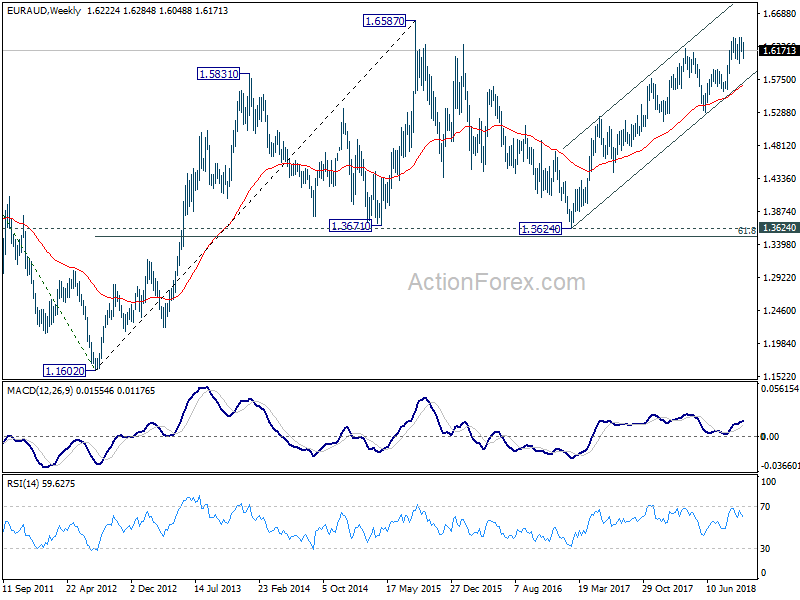
Last week's development suggests that consolidation fro 1.6353 is extending. Though, with 1.5984 support intact, outlook stays bullish and larger up trend is expected to extend later. As the falling leg from 1.6357 should have completed at 1.6048 already, initial bias is back on the upside this week for 1.6357. Firm break there will resume up trend for target 1.6587 key resistance next.
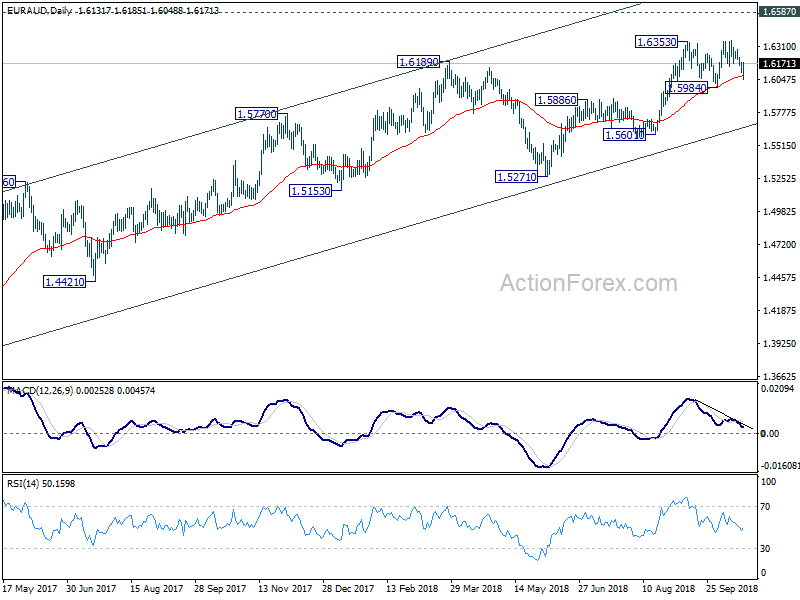
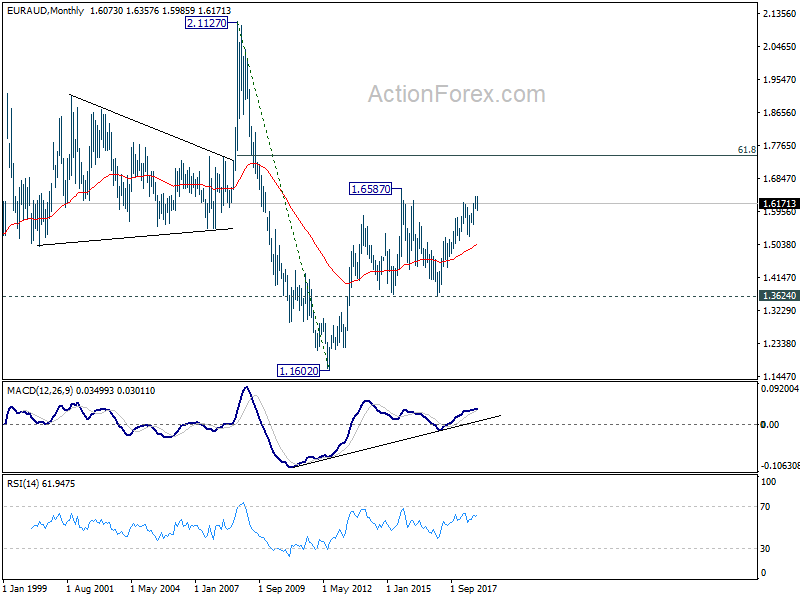
In the bigger picture, up trend from 1.3624 (2017 low) is still in progress. Further rise should be seen to retest 1.6587 (2015 high). Decisive break there will resume the long term rally and target 1.7488 fibonacci level. On the downside, break of 1.5984 support is need to be the first sign of medium term reversal. Otherwise, outlook will remain bullish in case of deep pull back. However, sustained break of 1.5984 will be an early sign of trend reversal.
In the longer term picture, the rise from 1.1602 long term bottom (2012 low) isn't over yet. We'll keep monitoring the development but there is prospect of extending the rise to 61.8% retracement of 2.1127 to 1.1602 at 1.7488 and above. However, sustained trading below 1.3624 key support should indicate long term reversal and target 1.1602 long term bottom again.
EUR/CHF Weekly Outlook
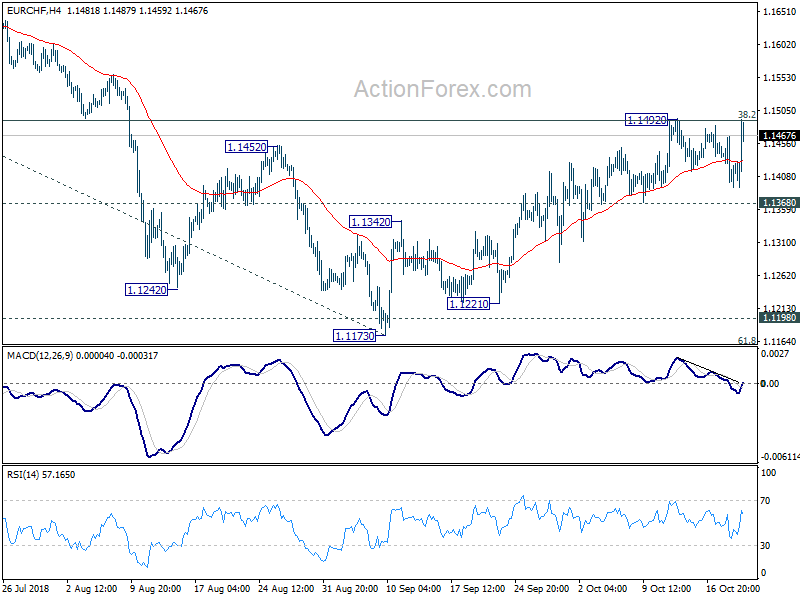
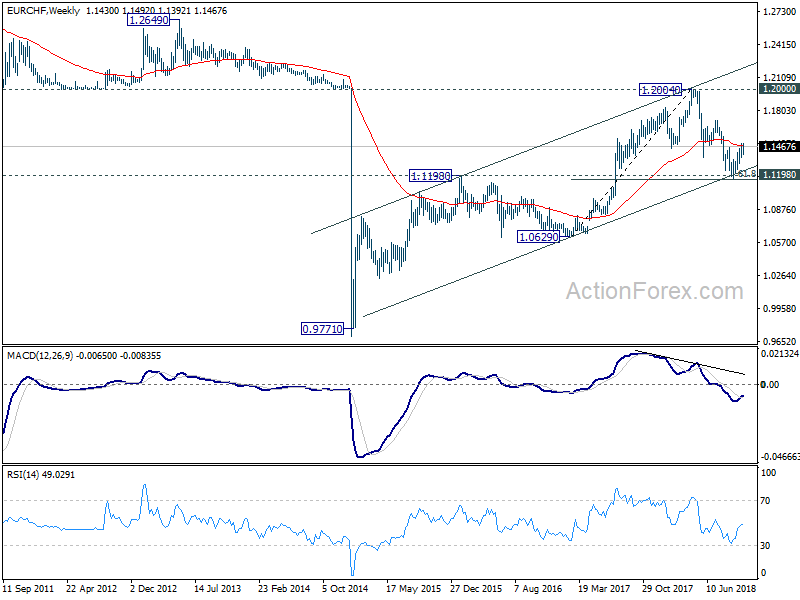
EUR/CHF stayed in consolidation below 1.1492 last week but retreated was contained above 1.1368 minor support. Initial bias stays neutral with mildly bullish outlook. On the upside, above 1.1492 will extend the rebound from 1.1173 to 1.1713 resistance. Decisive break there will confirm completion of whole fall from 1.2004 and target a test on this high. On the downside, however, break of 1.1368 minor support will argue that the rebound has completed and turn bias back to the downside for 1.1154/98 zone again.
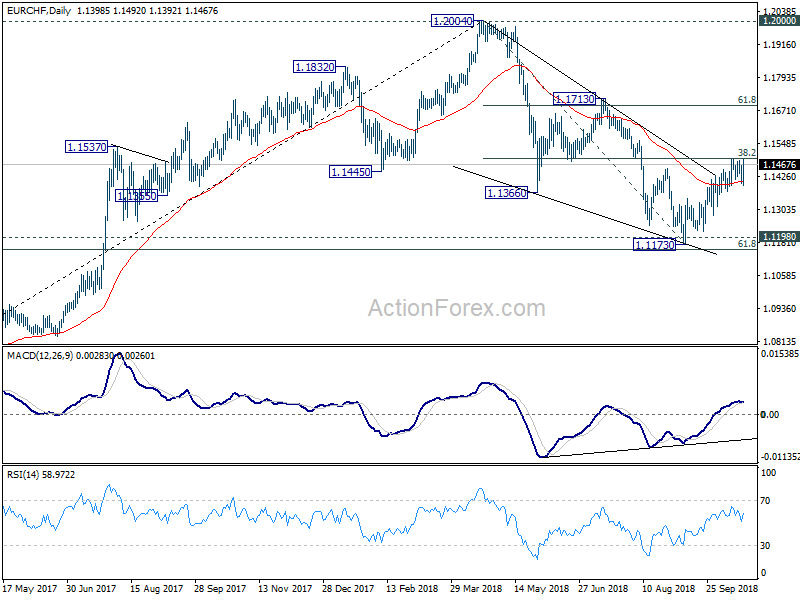
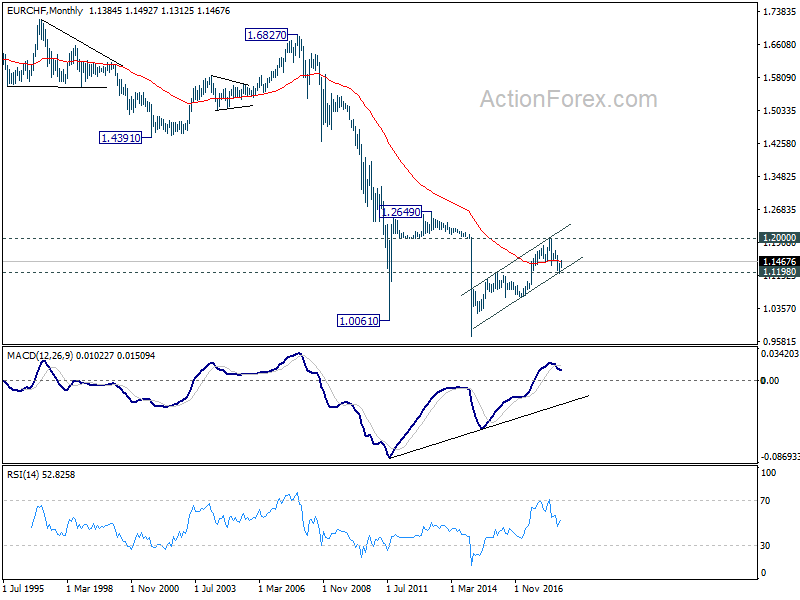
In the bigger picture, price actions from 1.2004 medium term top is seen as a correction only. Downside should be contained by support zone of 1.1198 (2016 high) and 61.8% retracement of 1.0629 to 1.2004 at 1.1154 to complete it and bring rebound. This cluster level is in proximity to long term channel support (now at 1.1234) too. A break of 1.2 key resistance is still expected in the medium term long term. However, sustained break of the mentioned support zone will mark reversal of the long term trend. In that case, 1.0629 key support will be back into focus.
Multiple Themes in Markets, More Upside in Euro after Surviving Italy Rating Downgrade
The markets were driven by multiple themes last week. Dollar ended up broadly higher as supported by hawkish FOMC minutes and rebound in treasury yields. However, it's outshone by New Zealand and then Australian Dollar. Kiwi was boosted by stronger than expected CPI. Meanwhile, the Aussie was pulled up by iron ore prices, which countered the negative impact of falling Chinese stocks. Yen was the mixed despite risk aversion.
On the other hand, Sterling was the weakest one as pressured by Brexit impasse, weaker than expected CPI and retail sales. In particular, UK Prime Minister Theresa May achieved nothing in the EU summit. The deadlock of Irish border backstop remains a deadlock. And EU leaders even avoided calling an unscheduled summit in November to close the deal. Canadian Dollar was the second weakest one as weighed down by falling oil price as well as sharp deceleration in headline CPI. While BoC is still expected to hike this week, the path beyond is now far less certain.
Euro was originally very weak on Italian budget concerns. EU's warning letter to Italy should have formally started the clash. Nonetheless, the common currency was later saved as EU expressed the intention to de-dramatize the situation. Also, Moody's downgrade of Italy with stable outlook was well received. The common currency ended the week mixed and should have some room for recovery this week. But the situation is not solved unless Italy revises its budget, which will not happen. So, the recovery in Euro is likely only temporary.
Fed hike pricing firmed up again after hawkish FOMC minutes
The minutes of September FOMC meeting came in slightly more hawkish than expected. Firstly, the minutes noted that "participants generally anticipated that further gradual increases in the target range for the federal funds rate would most likely be consistent with a sustained economic expansion, strong labor market conditions and inflation near 2 percent over the medium term." That is, it's a consensus for rate hikes to continue.
Secondly, "a substantial majority of participants expected that the year-end 2020 and 2021 federal funds rate would be above their estimates of the longer-run rate." And, "a few participants expected that policy would need to become modestly restrictive for a time and a number judged that it would be necessary to temporarily raise the federal funds rate above their assessments of its longer-run level".
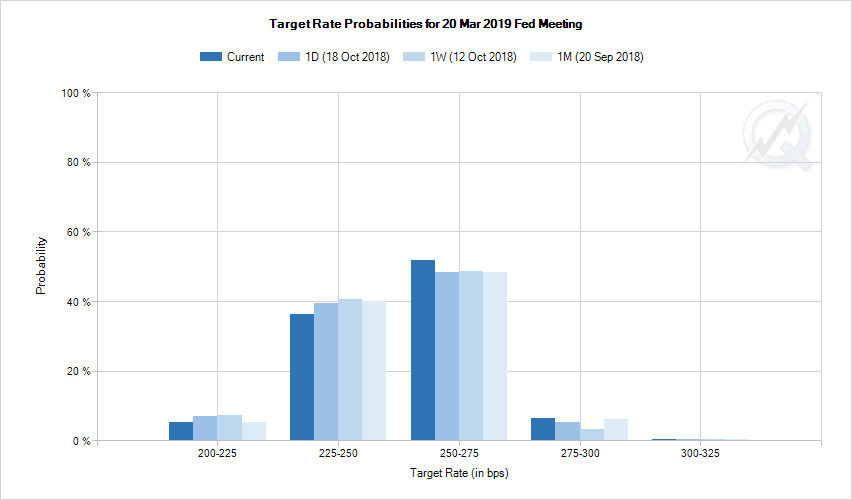
Market pricing on Fed's rate path firmed up a little bit. Beyond the next hike in December, Fed funds futures indicate 58% chance of another hike to 2.50-2.75%, up from 52% a week ago. There is 37.3% change of another hike to 2.75-3.00%, up from 32.7% a week ago. And there is 18.4% chance of yet another hike to 3.00-3.25%, up from 15.3% a week ago.
Dollar index's rebound on track to retest 96.98
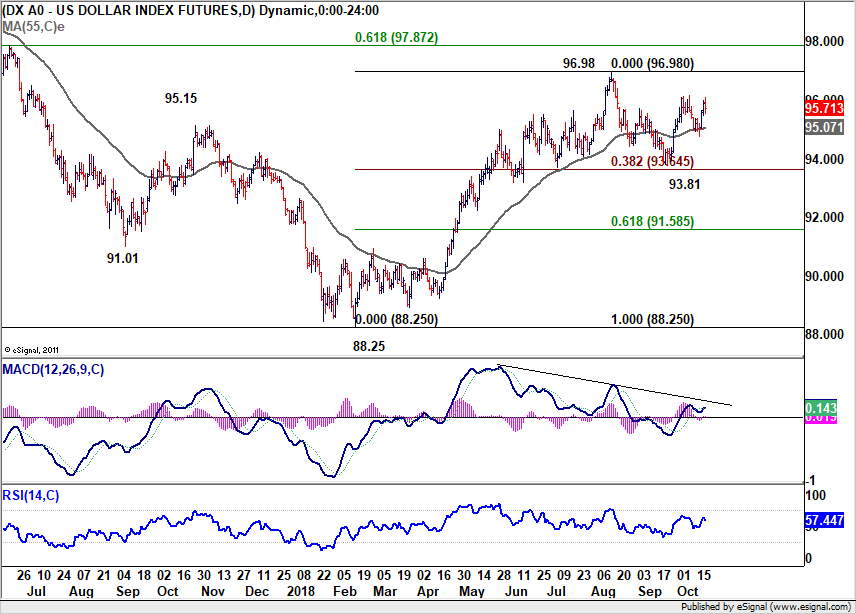
Dollar index drew strong support from 55 day EMA and rebounded yesterday. The rise from 93.81 is still in progress and should extend to retest 96.98 resistance first. For now, there is not enough evidence to suggest up trend resumption yet. Hence, we'd be cautious on topping below 96.98 high. On the downside, sustained trading below 55 day EMA might indicate completion of the rebound from 93.81. That would extend the consolidation pattern from 96.98 with another falling leg. But again, the range of the consolidation should have been set already. That is, another downside attempt should be contained by 38.2% retracement of 88.25 to 96.98 at 93.64, which is also close to 55 week EMA.
10 year yield recovered as consolidation extends
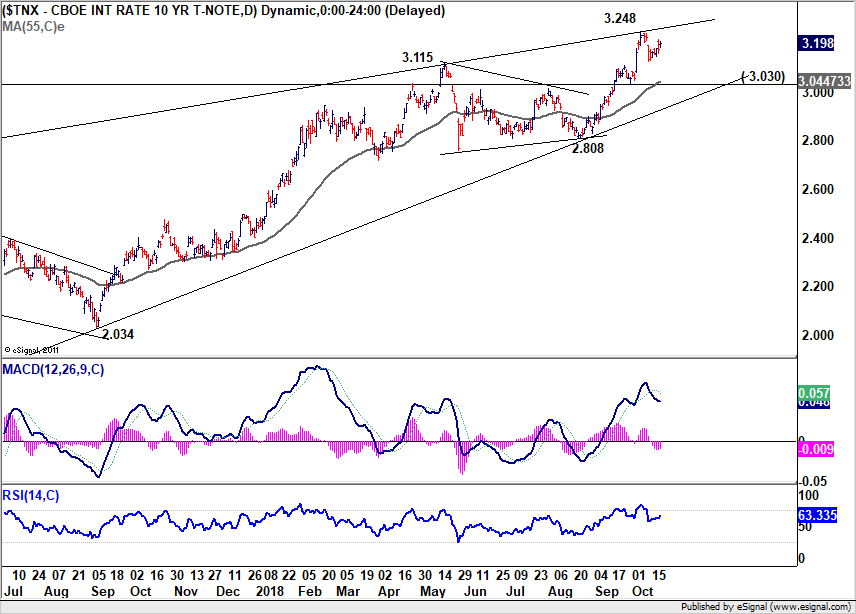
10 year yield closed higher at 3.198 last week and we might see further rise to retest 3.248 in near term. But for now, we'd expect consolidation from 3.248 to extend a while longer before up trend resumption. Hence, upside attempt could be limited by 3.248 at the next rally attempt. Another fall might be seen next. But in that case, downside should be contained by 3.030 support to bring rebound, which is close to 55 day EMA at 3.044.
DOW in interim consolidation, selloff to extend sooner or later
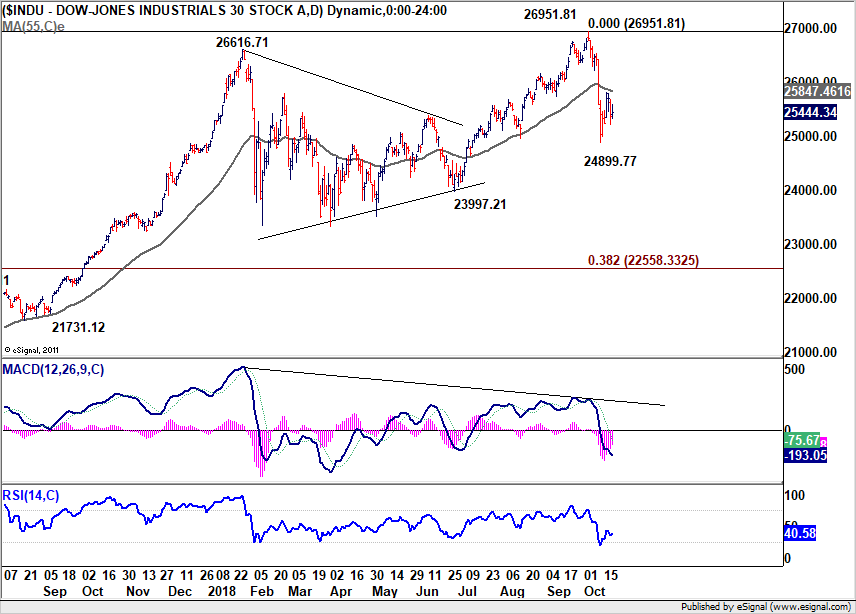
DOW's recovery from 24899.77 short term bottom extended last week. But upside is limited below 55 day EMA so far, keeping a bearish tone. While the consolidation might extends an eventual downside break of 24899.77 is expected. The correction from 26951.81 is expected to resume to 38.2% retracement of 15450.56 to 26951.81 at 22558.33 before completion.
German-Italian spread broke 330 but narrowed before close
Euro suffered heavy selling on last week but staged a strong rebound on Friday to close mixed. A key factor for the relief rebound was that Moody's downgraded Italy's rally to Baa3, a notch above junk, with a "stable" outlook. Moody's also indicated "Italy still exhibits important credit strengths that balance the weakening fiscal prospects."
Also, European Economic Affairs Commissioner Pierre Moscovici said he wanted to reduce tensions with Italy, regarding the budget, through "constructive dialogue". That came after the high profile warning letter that criticized Italy's budget as "obvious significant deviation" of the recommendations adopted by the European Council.
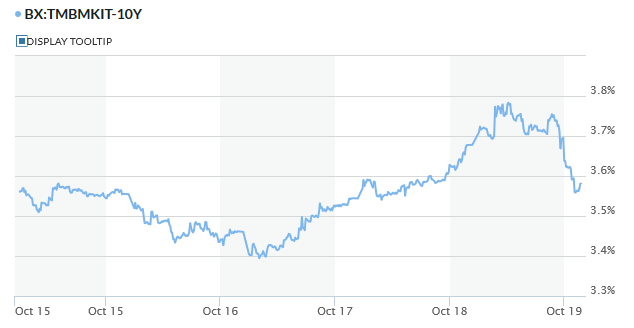
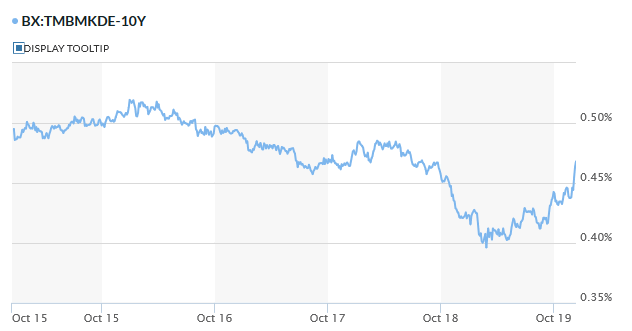
During the week, Italian 10 year yield hit as high as 3.784 and German 10 year year yield hit as low as 0.396. Spread was over 330 at the worst. Though, German 30 year yield closed at 0.464 while Italian 10 year yield closed at 3.581. Spread is still at 311 but it's already a sign of stabilization of some sort. S&P's rating review is not expected to deliver something that vastly different from Moody's. And while there will continue to be verbal exchanges between Italy and EU on the budget, the EU might want to further de-dramatize it to avoid market nervousness.
Loonie's double blow of oil price and CPI miss
Canadian Dollar dived broadly last week on oil price as well as weak data. Headline CPI slowed sharply to 2.2% in September while retail sales contracted in August. But it seems that investors are still holding on to their bets on a BoC rate hike to 1.75% on October 24 this Wednesday. Chances of that stands at 93% as implied by the money markets. However, the much tamer than expected inflation reader does raise the doubt on whether BoC should continue with more rate hikes ahead, or at least, in a more gradual way.
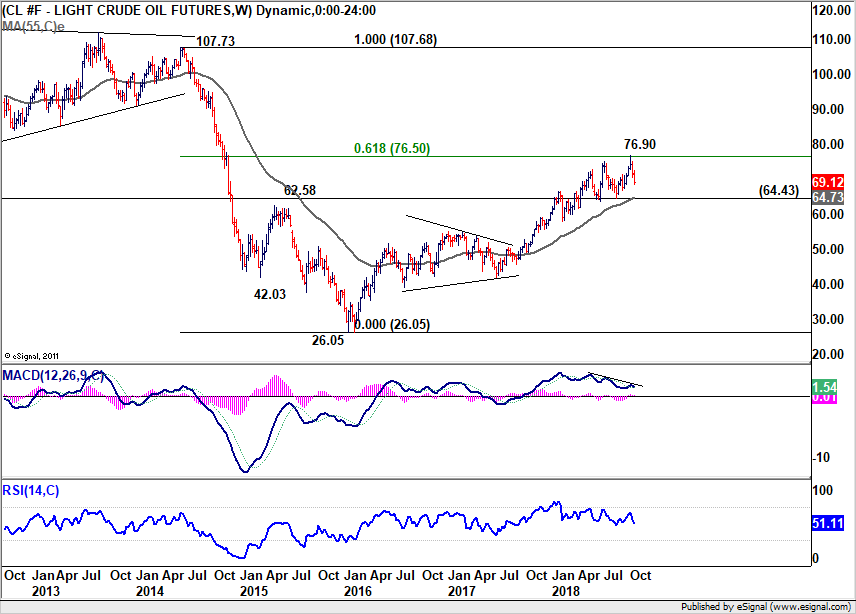
WTI crude oil hit as high as 76.90 earlier in the month but was then rejected by key fibonacci resistance of 61.8% retracement of 107.68 to 26.05 at 76.50. While bearish divergence condition is seen in weekly MACD and RSI, it's early to call for trend reversal as long as 64.43 support holds. Though, for the near term, WTI would likely gyrate downwards to 55 week EMA (now at 64.73) before bottoming. Both developments will give Canadian Dollar some downside pressure.
Aussie lifted as iron ore prices surges, but stays vulnerable
Australian Dollar ignored the selloff in Chinese stock markets and ended as the second strongest one last week. Some attributed to resilience to the fall from unemployment rate to 5.0%, lowest since 2012. But it should be noted that participation rate also dropped -0.2% to 65.4%. So, the drop in unemployment rate was more a reflection of decline in the size of labor force.
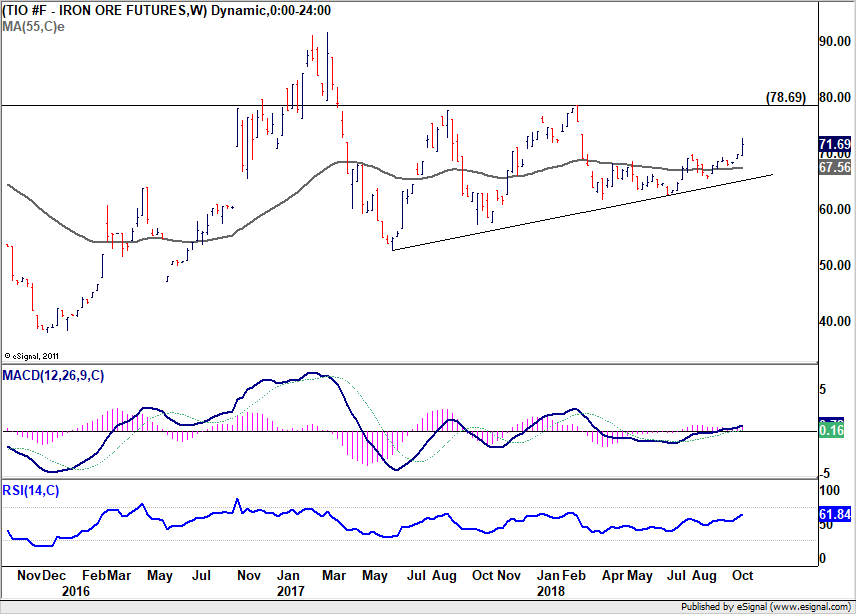
The rally in iron ore price was indeed seen as the main driver of Aussie's strength last week. It should be noted that while Australia's economy is closely tied to China, it's the term of trade that matters ultimately, which is heavily influenced by commodity prices. Iron ore futures hit as high as 72.74 last week, highest since March, before closing at 71.69. While there is room for further rise in near term, we don't expect a break of 78.69 resistance technically. And the rally could actually end earlier than that. So we don't expect the strength in Aussie to persist for long.
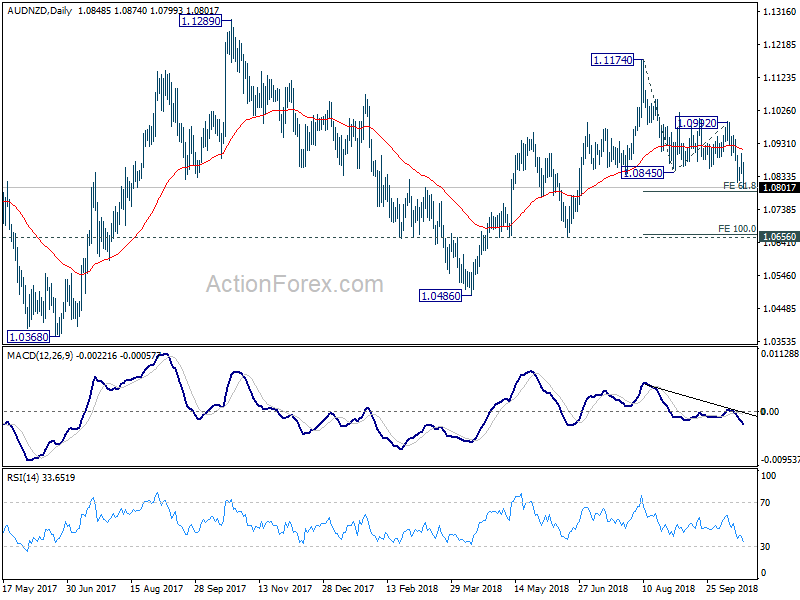
Indeed, we'd like to point to AUD/NZD as a sign of vulnerability in Aussie. The cross dived through 1.0845 support last week on stronger than expected New Zealand CPI. Up trend from 1.0486 should have completed at 1.1174. And the fall from 1.1174 is expected to extend through 61.8% projection of 1.1174 to 1.0845 from 1.0992 at 1.0789 to 100% projection at 1.0663, before bottoming.
Chinese stocks bottomed in near term but no trend reversal
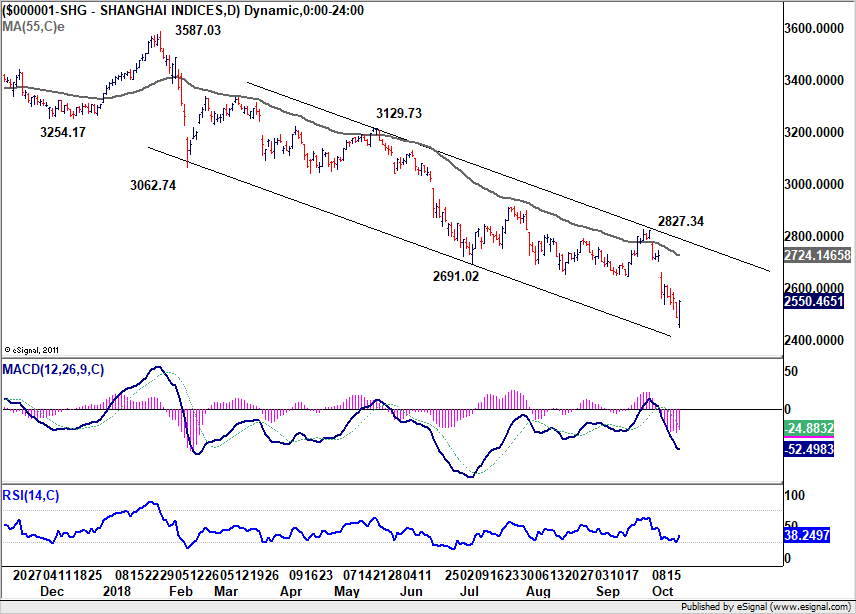
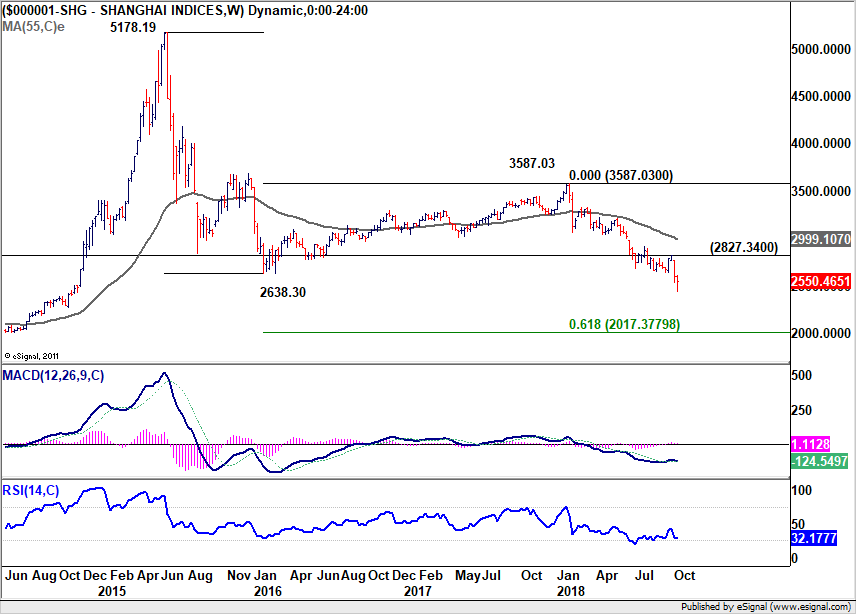
It's another terrible week in the Chinese stock markets. US Treasury Secretary Steven Mnuchin, who always appear to be the nicest guy to China in trade or currency, refrained from naming China as a currency manipulator last week. He just put China in the monitoring list along side Germany, India, Japan, Korea, and Switzerland. But that didn't stop the Shanghai SSE to extend recent down trend to as low as 2449.19.
Friday's strong rebound could be attributed to the GDP miss, which showed only 6.5% annualized growth in Q3 versus expectation of 6.6%. While it's a miss, China is still on track to hit 6.5% target this year. And, more importantly it's actually not worse than the worst that investors feared. Some also attribute to the rebounds to Vice Premier Liu He's calming words, and the rumor of Xi-Trump meeting at G20 summit next month. But after all, investors are, generally speaking, smart enough for not trusting what Chinese politicians say. The rebound, to us, is more about profit taking and guard against any surprised stimulus measures to be announced during the weekend again.
In short, has the SSE bottomed? Yes, in near term only. Has the trend reversed? Definitely no. Barring any government intervention, SSE is still on track to 61.8% projection of 5178.19 to 2638.30 from 3587.03 at 2017.37, which is very close to 2000 handle.
Position trading strategy
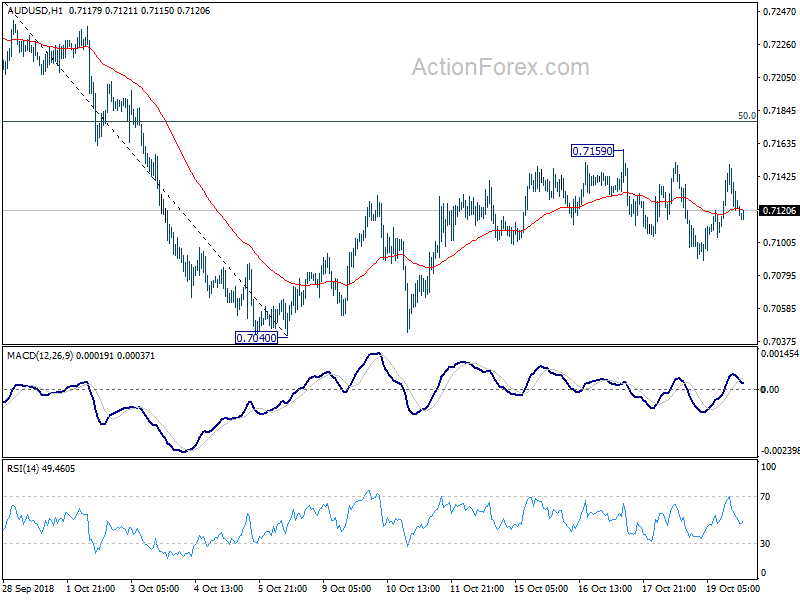
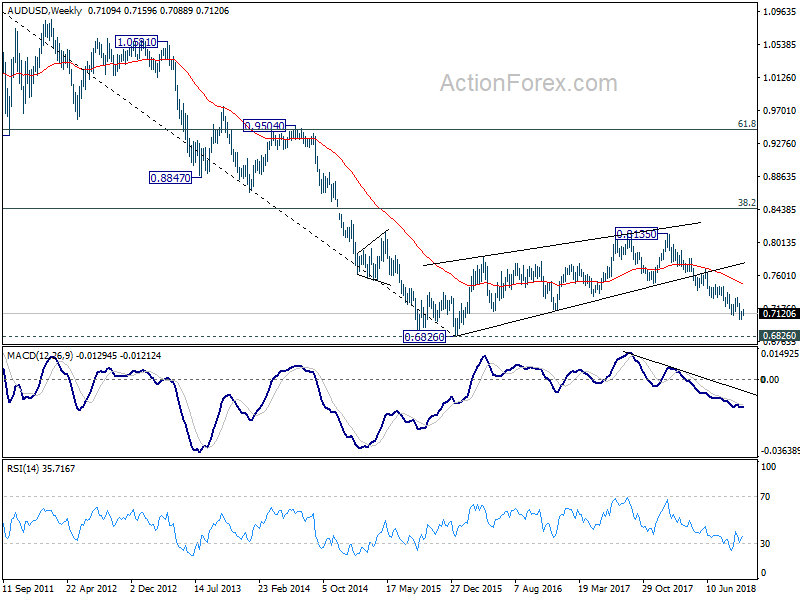
We're holding on to AUD/USD short as last updated in last weekly report. It's sold at 0.7100 with stop at 0.7185. The pair recovered further to 0.7159 last week but lost momentum there. There was decline attempts afterwards but failed. Overall outlook is unchanged price actions from 0.7040 are forming a consolidative pattern. It, admittedly, takes longer than expected to develop. But there is no sign of trend reversal yet. Hence, we'll keep the stop at 0.7185, slightly above 50% retracement of 0.7314 to 0.7040 at 0.7178. We're still expected the down trend from 0.8135 to resume sooner or later towards 0.6826 low. Whether we will exit around there will depend on the momentum of next fall.
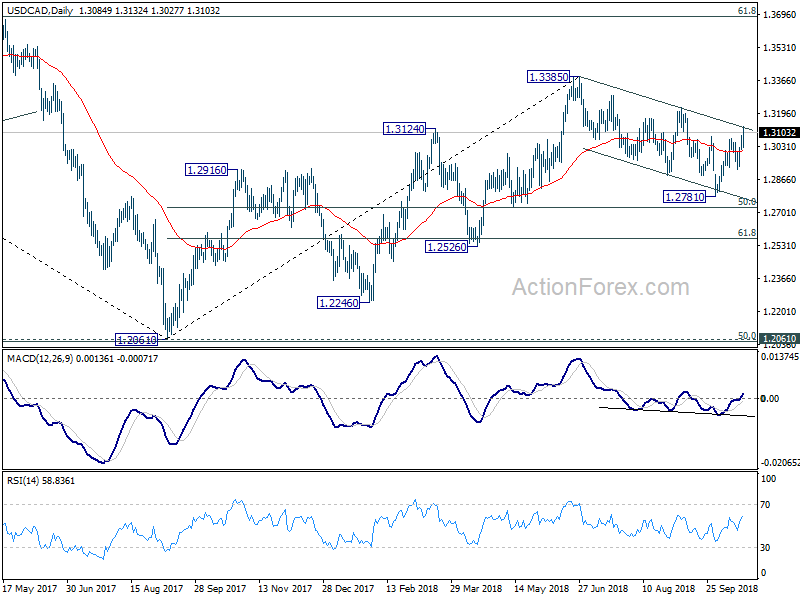
For new position, USD/CAD long is a close one to consider as the pull back from 1.3385 could have completed at 1.2781 already. And whole up trend from 1.2061 might be ready to resume. However, the pair is now pressing medium term trend line resistance, without breakthrough yet. And, there was no bullish convergence condition seen in daily MACD in the fall from 1.3385 to 1.2781. So, we'll give it a pass first.
EUR/JPY Weekly Outlook
EUR/JPY's decline form 133.12 extended to as low as 128.32 last week but recovered. Initial bias is neutral this week first. Another fall is in favor as long as 130.29 minor resistance holds. Below 128.32 will target 127.85 support first. Break will confirm completion of rebound from 124.89 at 133.12 and bring retest of this low. However, considering bullish convergence condition in 4 hour MACD, break of 130.29 will in turn suggest completion of fall from 133.12. In this case, intraday bias will be turned back to the upside for retesting 133.12 high.
In the bigger picture, current development suggests that EUR/JPY could have defended key support level of 124.08 key resistance turned support. And, the larger up trend from 109.03 (2016 low) is still in progress. Firm break of 137.49 structural resistance will target 141.04/149.76 resistance zone next. This will be the preferred case as long as 127.85 near term support holds. However, break of 127.85 will turn focus back to 124.08 key support level.
In the long term picture, at this point, EUR/JPY is staying in long term sideway pattern, established since 2000. Rise from 109.03 is seen as a leg inside the pattern. As long as 124.08 support holds, further rally is in favor in medium to long term through 149.76 high. However, break of 124.08 could extend the fall through 109.03 low instead.
Moody’s downgraded Italy to Baa3, with stable outlook
Moody's lowered Italy's credit rating to Baa3, from Baa2, on notch above junk status. Also rating outlook was assigned as "stable". The rating cut was generally expected and indeed, markets were calmed by the stable outlook.
Moody's expressed concern over the budget deficit target of 2.4% of GDP in 2019, which is three times higher than prior target of 0.8%. The shift towards an expansionary fiscal policy would make "Italy vulnerable to future domestic or externally-sourced shocks, in particular to weaker economic growth." Also, "most of the government's spending increases are structural in nature, implying that they will be difficult to reverse,"
In addition, Moody's warned that "the economic plans of the government, while supportive of growth in the near term, do not amount to a coherent program of reforms that will lift Italy's mediocre growth performance on a sustained basis."
Though, with a stable outlook, "Italy still exhibits important credit strengths that balance the weakening fiscal prospects."
BoE Carney on Brexit preparation: Not hoping for the best but preparing for the worst
BoE Governor Mark Carney said the central bank "does not focus on the most likely outlook" in Brexit preparation. Instead, BoE focuses on the possible consequences of a disorderly, cliff-edge exit from the EU, however unlikely that may be." That is, Carney added "we aren't hoping for the best, we're preparing for the worst in several ways."
On global financial regulations, Carney emphasized that "we need to tailor not taper. It is critical that the process of evaluation and adjustment does not compromise overall system resilience."
Fed Kaplan: Two or more rate hikes to reach netural
Dallas Fed President Robert Kaplan said the current monetary policy remained "modestly" accommodative. It will take two or three more rate hikes to become "neutral" which is neither accommodative nor restrictive. And he's not decided whether Fed should continue rate hikes above neutral level.
Referring to the economy, Kaplan said Fed is "basically meeting its dual mandate".Ka
Summary 10/22 – 10/26
Monday, Oct 22, 2018
[php_everywhere instance="1"]
Tuesday, Oct 23, 2018
[php_everywhere instance="2"]
Wednesday, Oct 24 2018
[php_everywhere instance="3"]
Thursday, Oct 25, 2018
[php_everywhere instance="4"]
Friday, Oct 26, 2018
[php_everywhere instance="5"]
Weekly Economic and Financial Commentary: Signs Pointing to Solid Third Quarter Growth
U.S. Review
Signs Pointing to Solid Third Quarter Growth
- Retail sales rose 0.1% in September. Less-volatile control group sales, which feed into GDP, increased 0.5%.
- Industrial production improved 0.3% in September as mining and durable goods orders advanced. Production of business equipment grew a strong 8.0% in Q3.
- Housing continues to underwhelm. Existing home sales fell 3.4% to a 5.15 million-unit pace. Total starts declined 5.3% in September due to a drop in the multifamily segment.
- The federal government ran a $779 billion deficit during FY 2018. Tax collections grew 0.4%, while spending rose 3.2%.
Signs Pointing to Solid Third Quarter Growth
An abundance of data poured in this week and largely pointed to economic growth remaining solid in the third quarter. We estimate real GDP grew at a 3.3% annualized rate in that period, driven by strong consumer spending, a substantial inventory build and an added boost from fiscal stimulus.
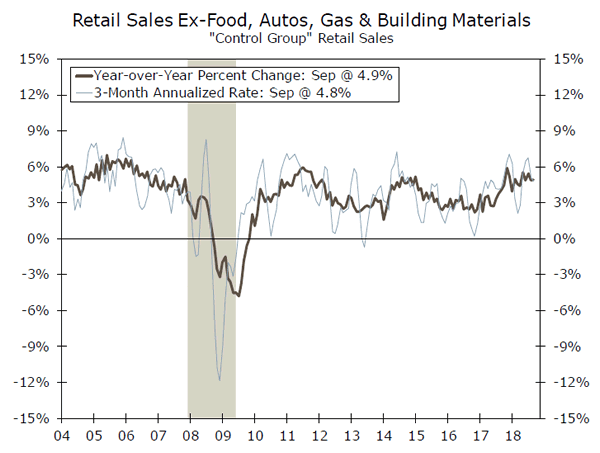
Retail sales fell short of expectations and rose 0.1% in September, primarily due to slower sales at gas stations and bars and restaurants, which dipped 0.8% and 1.8%, respectively. However, control group sales, which feed into GDP and exclude volatile categories like auto, gas and building materials, came in better than expected, increasing a solid 0.5% during the month.
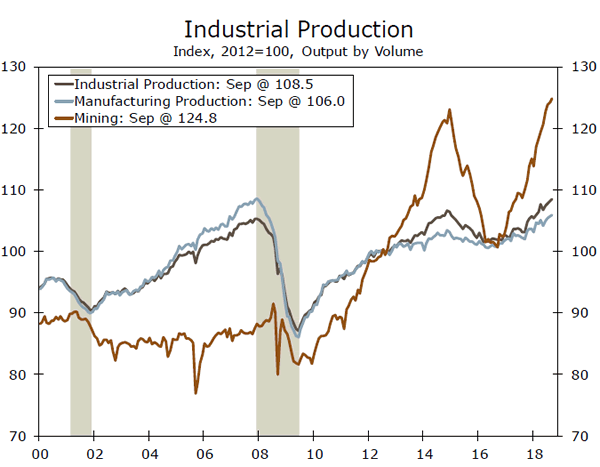
Industrial production rose 0.3% in September as mining and durable goods orders advanced. Higher oil prices continue to support mining production, while manufacturing activity was bolstered by upticks in motor vehicles and machinery. A robust 8.0% rise in production of business equipment over the past three months bodes well for equipment spending being supportive of real GDP growth in Q3.
The Leading Economic Index (LEI) climbed 0.5% higher in September, further evidence that economic growth will remain solid in the final quarter of the year. Meanwhile, the underlying strength of the labor market was apparent in the August JOLTS report, which showed a record number of job openings. The rate of workers quitting their jobs also hit the highest point since 2001, which signals that workers have a high degree of confidence in the labor market. The subject of a strengthening labor market was also discussed in the minutes for the most recent September 25-26 FOMC meeting released this week. The minutes revealed that participants generally anticipate further increases in the federal funds rate if such broadly positive conditions persist. This reaffirms our stance that the Fed will cap the year with a rate hike in December, followed by three additional hikes in 2019.
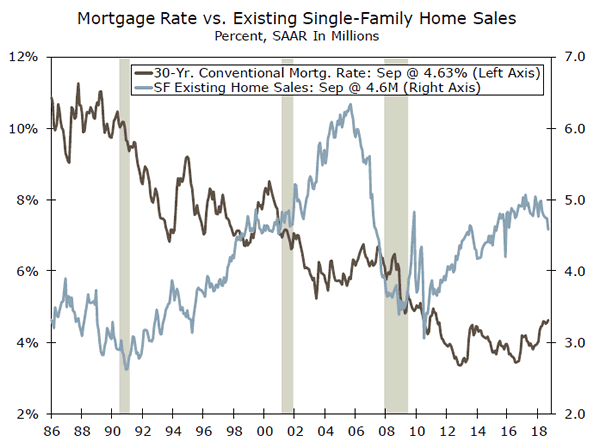
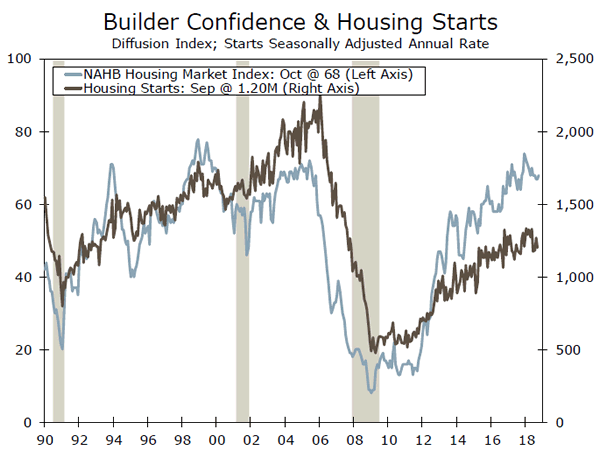
However, housing continues to lag behind the upshift in economic activity. Existing homes sales fell short of expectations and dropped 3.4% in September. Housing starts also came in slightly below consensus and declined 5.3% during that same period. Much of that decline occurred in the volatile multifamily segment, while new single-family units were essentially flat. Hurricane Florence may have had an undue influence as the South saw starts drop 13.7% during the month. The NAHB Housing Market Index edged higher, reflecting strong builder confidence surrounding current demand for new homes. Given that material prices have eased recently and demand appears to be holding its own, we expect activity to gradually improve in coming months.
Meanwhile, the federal government ran a $779 billion deficit during FY 2018, a number just slightly ahead of what we had expected given the recent budget deal and tax reform. Tax collections rose just 0.4%, while spending increased 3.2%. Given that these policy changes will be in effect for the entirety of the next fiscal year, we expect the deficit to widen further to just north of $1 trillion in FY 2019.
U.S. Outlook
New Home Sales • Wednesday
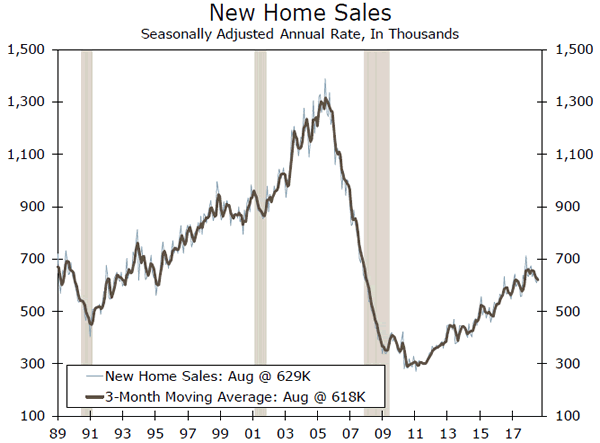
New home sales rose to a 629,000-unit pace in August, up 3.5% over the month after two consecutive months of declines. While sales are up nearly 7% year to date, rising mortgage rates could be restraining sales growth. Price appreciation has slowed from earlier this year, but the median new home price was still up 1.9% from a year ago in August. Sales in the Northeast rebounded sharply but fell 1.7% in the South, where most new sales occur, and could point to higher rates and prices weighing on buyers.
While affordability could still be a headwind, new home inventories have been steadily rising this year and should help relieve some price appreciation in coming months. Rising personal incomes and continued job growth should also be supportive of new home sales. However, a rising rate environment makes an upside breakout at this point in the cycle unlikely in our view. We look for new homes sales to fall to a 619,000-unit pace in September.
Previous: 629K Wells Fargo: 619K Consensus: 625K
Durable Goods • Thursday
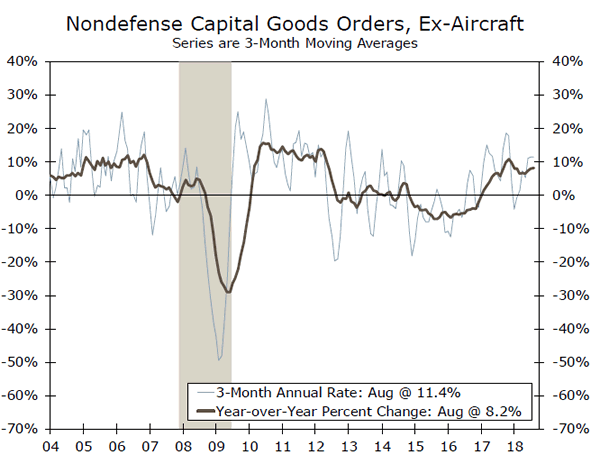
While durable goods orders rose 4.4% in August, much of the gain can be traced to a sharp pickup in the typically volatile aircraft component, up almost 70% on the month. Core capital goods orders fell 0.9%, and shipments in this category declined 0.2% in August. But data released earlier this week showed that business equipment production rose at an 8% rate in Q3, supporting a likely solid equipment spending reading in next week's GDP release. A 1.3% rise in defense capital goods shipments in August also bodes well for the Q3 pickup we forecast for government purchases.
While we look for orders to fall in September as equipment spending is likely still moderating from the highs registered in 2017, inventories look poised to contribute a sizable lift to Q3 GDP growth after proving a drag in Q2. Durable goods inventories rose at a 3.8% 3-month annualized rate in August, and we look for inventories to boost Q3 GDP growth 1.8 percentage points.
Previous: 4.4% Wells Fargo: -1.3% Consensus: -1.3% (Month-over-Month)
GDP • Friday
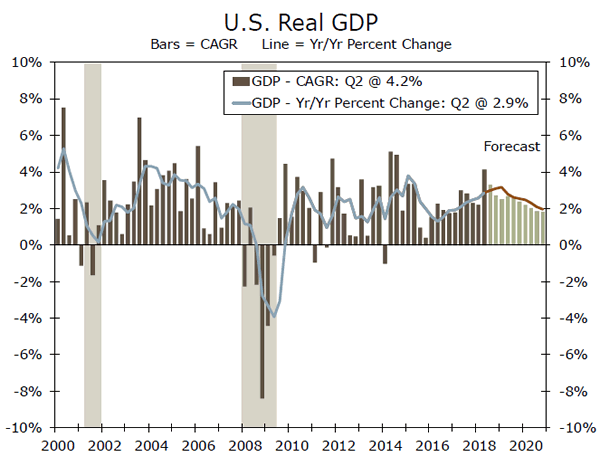
After rising at a robust 4.2% annualized rate in Q2, we look for Q3 GDP growth to clock in at a more moderate 3.3% annualized rate, as some components supporting the breakneck Q2 pace should pullback in Q3. We look for some payback in international trade after net exports contributed 1.2 percentage points to growth in Q2, partially due to record shipments for items such as soybeans as exporters attempted to get ahead of retaliatory tariffs. We expect consumer spending to register a 3.4% annualized pace in Q3, but income growth that is only slowly picking up and tightening financial conditions could weigh on spending growth in coming quarters.
Although trade should prove a drag, we look for inventories to contribute nearly 2 percentage points to topline growth after a large drawdown in Q2. Government spending should also pick up as the state and local sector continues to expand, and we see business investment maintaining a solid pace of growth in Q3.
Previous: 4.2% Wells Fargo: 3.3% Consensus: 3.4% (Quarter-over-Quarter, Annualized)
Global Review
Chinese Economic Growth Continues to Edge Lower
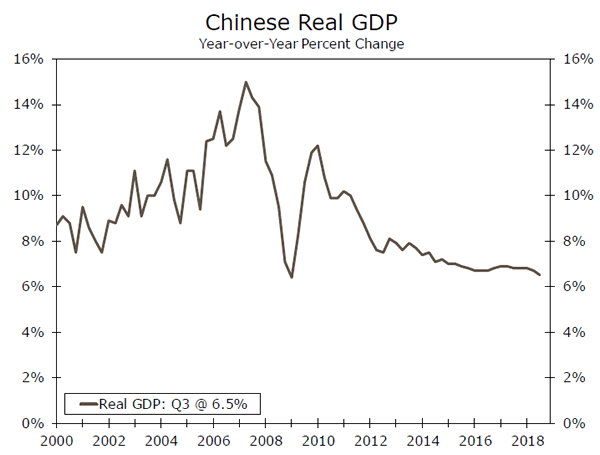
- Chinese GDP growth softened to 6.5% year over year in Q3, the slowest pace since 2009. That slowdown comes despite monetary policy easing from China's central bank this year, and highlights the potential for more central bank support going forward.
- U.K. and E.U. officials failed to reach a Brexit deal at a key E.U. leadership summit this week, adding to concerns about the potential for a "no-deal" Brexit. Uncertainty around Brexit developments should keep the Bank of England on hold for now, but it is likely watching rising U.K. wage pressures closely.
Chinese Economic Growth Continues to Edge Lower
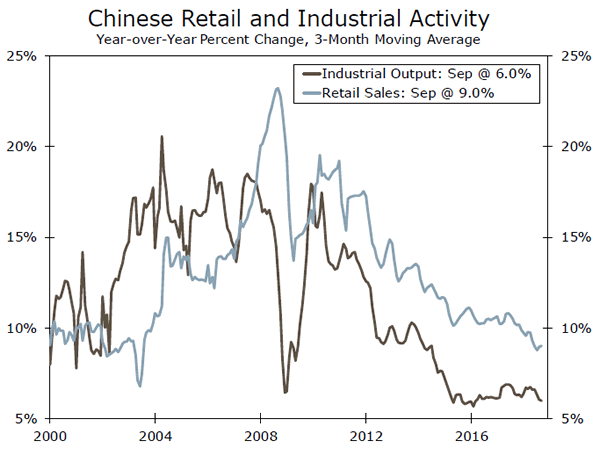
China remained at the center of market focus this week, with a number of key economic and policy developments. On the data front, China released growth and activity figures that were generally softer than expected. Real GDP growth slowed to 6.5% year over year in Q3, the slowest pace since 2009, while higher frequency activity numbers were more mixed. Retail sales accelerated slightly to 9.2% year over year in September, while growth in industrial output growth slowed to 5.8%. That mix of activity is probably a welcome development, given China's longerterm goal of rebalancing toward consumption and away from investment. However, as overall growth continues to show signs of slowing, there is potential for further monetary policy easing measures from China's central bank. As a reminder, the central bank has already cut its reserve requirement ratio (RRR) for major banks by a cumulative 250 bps to 14.50% in 2018, including a 100-bp cut at the start of this month, while interbank interest rates have generally trended lower since the start of this year. In other policy developments, the U.S. refrained from naming China a currency manipulator, although it ratcheted up its language with regard to recent Chinese currency developments.
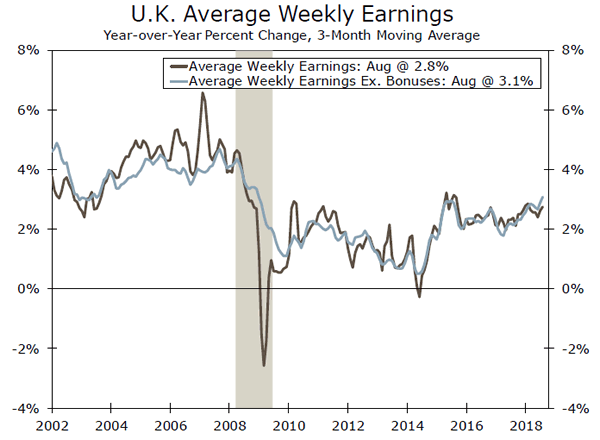
The United Kingdom was also in focus for markets this week. U.K. September inflation figures were softer than expected, with CPI inflation slowing more than expected to 2.4% year over year and core CPI inflation easing to 1.9%. However, the U.K. labor market report showed strong wage growth, telling a different story on U.K. price pressures. Excluding bonuses, wage growth during the three months to August firmed to 3.1% year over year, the quickest pace since 2009. U.K. price pressures will be important to monitor in the context of Bank of England monetary policy, which is likely hesitant to raise rates further in the near term, given ongoing Brexit uncertainty. Recent developments suggest that uncertainty around Brexit is unlikely to abate any time soon, as the E.U. and U.K. failed to strike a deal at this week's E.U. leadership summit. Officials noted that a deal may not be reached until December, although the timing and overall standing of negotiations is likely to remain fluid in the coming weeks. Meanwhile, reports indicated the U.K. parliament would not approve the withdrawal deal in its current form, a sign that even if a deal is reached by the Eurozone and United Kingdom, it may run into roadblocks when it comes to U.K. parliament for consideration.
Elsewhere, Canadian inflation and retail activity fell well short of expectations. Retail sales unexpectedly fell 0.1% month over month in August, while CPI inflation slowed sharply to 2.2% year over year in September. These weak data probably do not derail a Bank of Canada rate hike next week, but officials could adopt more cautious language with regard to future rate moves.
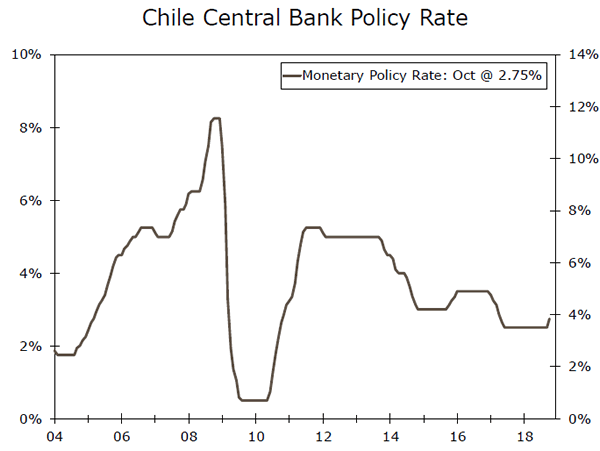
It was a mostly uneventful week for global central banks, with perhaps the one exception being Chile's central bank. After ending its rate cut cycle in early 2017, Chile's central bank raised its overnight rate target 25 bps to 2.75% amid above-trend growth and steadily rising inflation pressures.
Global Outlook
Mexico Economic Activity • Tuesday
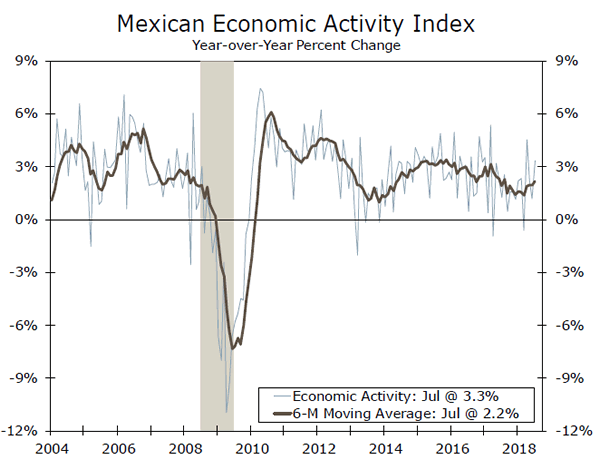
Mexico's economy has shown some resilience in recent months, with the economic activity index accelerating since the start of the year. The industrial sector has led the way, with manufacturing and mining activity rebounding over the past few months, although more recently, the services sector has also seen a pickup in activity. The resilience in Mexican growth is notable particularly given monetary policy is still tight, with the central bank's policy rate of 7.75% well above the rate of inflation. Solid U.S. growth has probably helped, given Mexico's close economic ties to the U.S. economy.
Going forward, it will be particularly interesting to monitor investment figures in Mexico now that a "new NAFTA" deal (USMCA) has been reached. That reduction in uncertainty could bring some investment that has been on the sidelines until now, while strength in the U.S. economy should also continue to support Mexico's economy.
Previous: 3.3% (Year-over-Year)
Bank of Canada • Wednesday
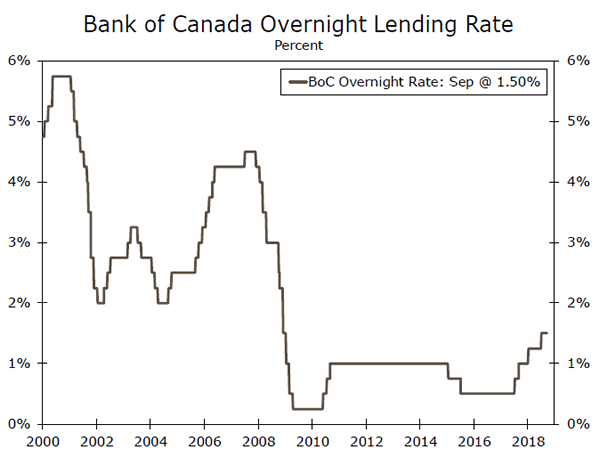
The Bank of Canada (BoC) is widely expected to raise its target for the overnight rate 25 bps to 1.75% at its meeting next week. The BoC has already raised rates a cumulative 100 bps since mid-2017, and an additional rate hike at next week's meeting would be consistent with an economy that continues to grow quicker than its potential rate of growth. While recent inflation figures were weaker than expected, core inflation remains solid in Canada and is right around the BoC's 2% target, suggesting further rate hikes are likely ahead.
Another sign the BoC will push ahead with additional rate increases in the coming quarters is the resolution of NAFTA uncertainty now that the USMCA has been agreed to by the United States, Mexico and Canada. BoC policymakers had noted that NAFTA uncertainty was a reason to be more cautious in their approach to policy, and the removal of that uncertainty should allow the central bank to return focus to constructive Canadian fundamentals.
Previous: 1.50% Wells Fargo: 1.75% Consensus: 1.75%
European Central Bank • Thursday
While the European Central Bank's (ECB) is unlikely to adjust policy at its announcement next week, the language and tone of the statement will be key to watch for clues on its next policy move. The ECB's current guidance is that it will end bond purchases in December and keep rates on hold at least through summer 2019. However, policymakers' recent comments have been leaning more hawkish, as ECB President Draghi discussed "vigorous" underlying inflation pressures and other policymakers have highlighted the possibility of bringing forward the timing of the first rate hike.
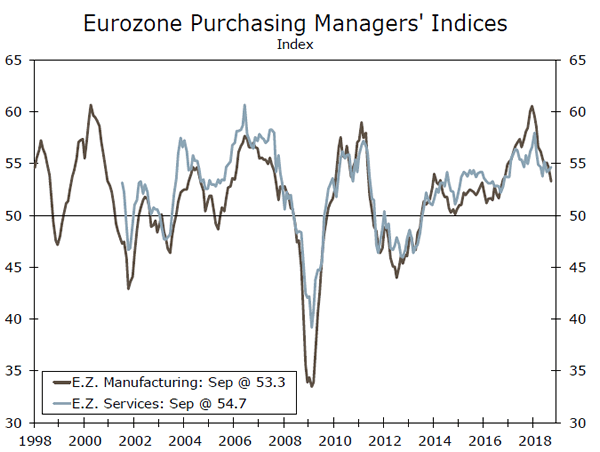
Also out next week are the manufacturing and service sector purchasing managers' indices (PMIs) for the Eurozone. These PMIs have clearly softened since the start of the year but remain firmly in expansion territory (i.e., above 50), consistent with an economy that is growing steadily, albeit modestly.
Previous: -0.40% Wells Fargo: -0.40% Consensus: -0.40% (Deposit Rate)
Point of View
Interest Rate Watch
Lost in Translation?
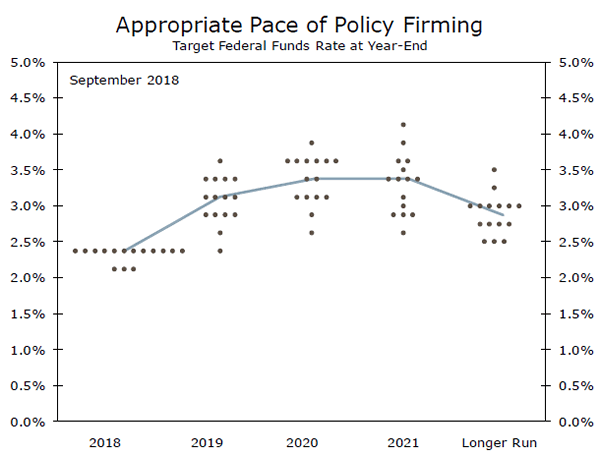
The minutes from the September FOMC meeting once again showed that the Fed's words have invoked more fear into the financial markets than their actions. Expectations for a rate hike in September were running around 100% when the Fed met. The odds of a rate hike in December, and further rate hikes in 2019, were also fairly high. What has changed since the meeting is that the rhetoric from the Fed, with the exception of a small minority of Federal Reserve Bank presidents, has become more hawkish. As a result, fears the Fed might hike rates faster, longer and to an ultimately higher level have increased.
Moral suasion or 'open mouth operations' is an important and often overlooked policy tool. The Fed's messaging to the markets is carefully crafted in policy statements and public comments. The message currently is that the economy is very strong and the majority of FOMC members believe the federal funds rate is still below its neutral level, despite removing the word accommodative from the last policy statement.
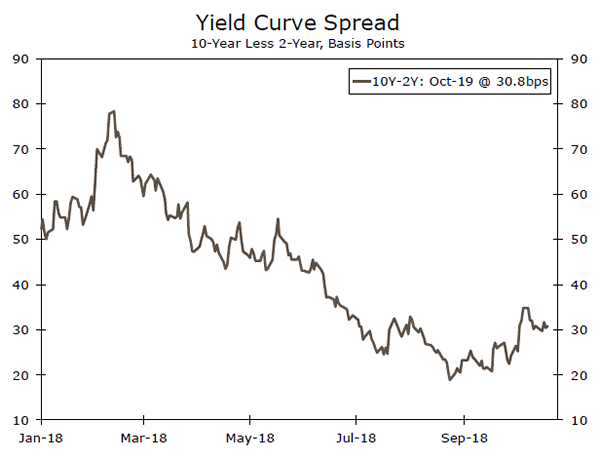
The intended target for the Fed's message is the financial markets, specifically the bond market, which appears to have been skeptical that the Fed would raise interest rates as much as implied by the Fed's dot plot. In the early years of the dot plot, the Fed overpromised and under delivered in terms of raising interest rates. This time, the Fed's rhetoric has coincided with this cycle's strongest run of economic growth and firming wage and inflation pressures. Treasury financial needs have also increased and the temporary boost in demand for securities to bolster private pensions has ended. The net result has been a pop in long-term interest rates and steepening of the yield curve.
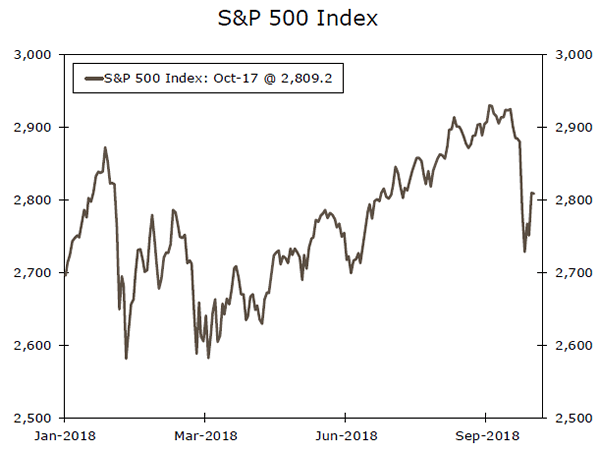
With bond yields rising, equity prices have moved broadly lower. Housing activity has also cooled further, which has slowed the pace of price increases. While the Fed is not likely targeting asset prices, the recent moderation is likely not being viewed unfavorably. Asset prices are one of the few excesses that have built up in this cycle and a pullback or pause there might help extend this business cycle even further.
Credit Market Insights
Home Turnover and Equity
Existing home sales have now fallen for six consecutive months as the housing market continues to lose steam. Facing sharply higher financing costs, 78% of respondents now view renting as more affordable than buying, according to Freddie Mac survey data released this week. This proportion is up 11 points over just the past six months, as mortgage rates reached a seven-year high of 4.9% last week. Furthermore, 58% of renters say they have no plan to buy a home.
Related to this weakness in home sales is the depressed level of housing turnover. The ratio of home sales to housing stock remains a full third below the level reached in 2005. Why are homeowners staying put? For one, there has been a marked decline in interstate migration. The propensity of many—particularly Millennials—to rent rather than buy plays a role. The legacy of the Great Recession also looms large. Many homeowners refinanced at very low rates in the aftermath and are now opting to stay in their current home and build equity. Indeed, home equity rose to a record $14.4 trillion in 2017. And unlike the bevy of housing metrics that remain below their pre-crisis peaks, home equity surpassed its 2006 level by 2016 and continues to climb.
Of course, while this household deleveraging can be viewed as a positive for the financial health of the consumer sector, it nevertheless may be a factor behind the observed slowdown in the housing market. Thus, while the broader economy charges ahead, the housing market largely stays put.
Topic of the Week
The Goose Is Getting Fat: Holiday Sales Outlook
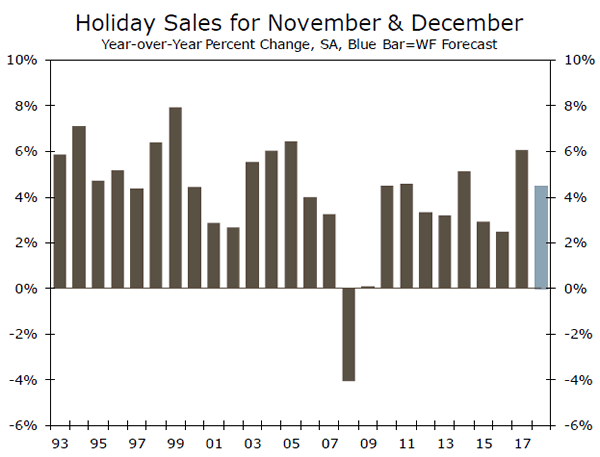
Coming off the best holiday season in more than a decade last year, retailers are poised for another good year, at least in terms of the most important measure—sales. We already have data for the first nine months on the books for 2018. If we compare that to the same period in 2017, our measure of holiday sales–which excludes motor vehicles, gasoline and receipts at bars and restaurants–is up 4.8%. With consumer confidence surging and household financial conditions improving, there is scope for holiday sales to ramp up in the remaining months of the year. Strong spending momentum exists across almost all of the categories included in our spending measure of holiday sales. That momentum, coupled with the fact that on average, every category of holiday spending–with the exception of building and garden equipment retailers–sees its largest portion of annual sales take place in the month of December, points to a merry spending season for retailers. Overall, we expect holiday sales to increase about 4.5% this season.
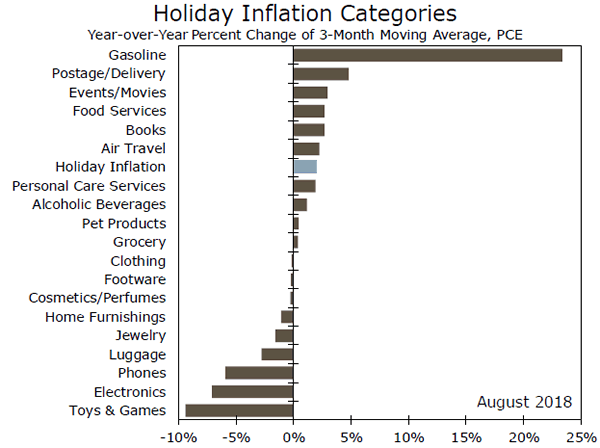
This will be a record-tying 10th consecutive holiday season without a recession. But, a booming economy brings its own challenges. With sales set for another strong season, retailers are facing a challenge they have not seen in years: finding workers. The tight labor market makes it tricky and more costly to find seasonal workers, but it also makes services, which are more labor-intensive than goods, cost more. However, headed into the holiday season, prices for many traditional gifts are down compared to a year ago. Excluding gas form our inflation index of common holiday outlays, the holidays are likely to cost about 0.5% less than last year, although, that is the smallest decline in about three years. Yet, even if consumers are not seeing the same breaks in prices as in recent years, the holidays still look like a bargain compared to the broader economy, where inflation is up 2.2%
Our full report, takes a sneak peek inside the packages, boxes and bags to help you frame your thinking for the holiday shopping season, and how the labor market backdrop and price environment provide unique challenges at this late stage of the cycle.